Grundlæggende statistik
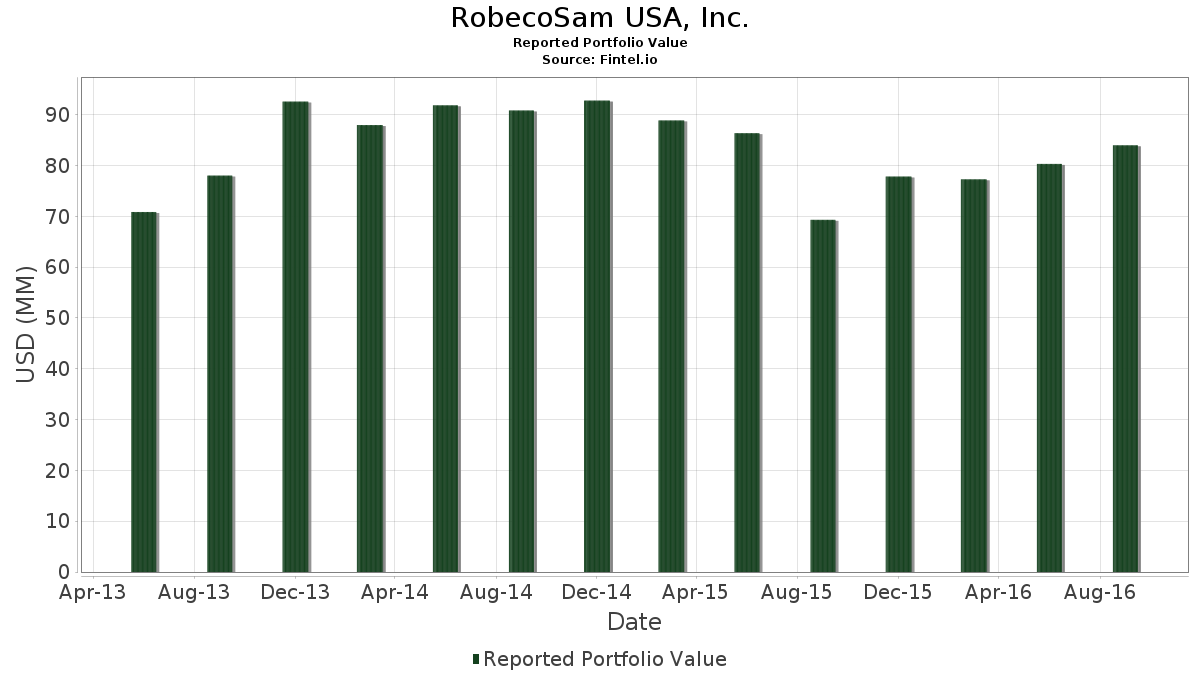
| Porteføljeværdi | $ 83.988.000 |
| Nuværende stillinger | 48 |
Seneste beholdninger, ydeevne, AUM (fra 13F, 13D)
RobecoSam USA, Inc. har afsløret 48 samlede besiddelser i deres seneste SEC-arkivering. Den seneste porteføljeværdi er beregnet til at være $ 83.988.000 USD. Faktiske aktiver under forvaltning (AUM) er denne værdi plus kontanter (som ikke er oplyst). RobecoSam USA, Inc.s største beholdninger er Danaher Corporation (US:DHR) , Thermo Fisher Scientific Inc. (US:TMO) , Xylem Inc. (US:XYL) , A. O. Smith Corporation (US:AOS) , and Waters Corporation (US:WAT) . RobecoSam USA, Inc.s nye stillinger omfatter Cintas Corporation (US:CTAS) , South Jersey Industries Inc. (US:SJI) , .
Top øger dette kvartal
Vi bruger ændringen i porteføljeallokeringen, fordi dette er den mest meningsfulde metrik. Ændringer kan skyldes handler eller ændringer i aktiekurser.
| Sikkerhed | Aktier (MM) |
Værdi (MM$) |
Portefølje % | ΔPortefølje % |
|---|---|---|---|---|
| 0,02 | 3,00 | 3,5707 | 3,5707 | |
| 0,01 | 1,53 | 1,8169 | 1,8169 | |
| 0,02 | 1,49 | 1,7788 | 1,7788 | |
| 0,03 | 1,05 | 1,2490 | 1,2490 | |
| 0,05 | 0,66 | 0,7846 | 0,7846 | |
| 0,03 | 1,91 | 2,2706 | 0,6708 | |
| 0,01 | 0,54 | 0,6382 | 0,6382 | |
| 0,05 | 4,84 | 5,7687 | 0,6007 | |
| 0,01 | 0,46 | 0,5477 | 0,5477 | |
| 0,01 | 0,45 | 0,5370 | 0,5370 |
Top falder i dette kvartal
Vi bruger ændringen i porteføljeallokeringen, fordi dette er den mest meningsfulde metrik. Ændringer kan skyldes handler eller ændringer i aktiekurser.
| Sikkerhed | Aktier (MM) |
Værdi (MM$) |
Portefølje % | ΔPortefølje % |
|---|---|---|---|---|
| 0,04 | 6,91 | 8,2226 | -1,9203 | |
| 0,00 | 0,00 | -1,2699 | ||
| 0,10 | 5,32 | 6,3354 | -0,8345 | |
| 0,03 | 0,89 | 1,0597 | -0,7244 | |
| 0,09 | 7,34 | 8,7429 | -0,6841 | |
| 0,09 | 4,03 | 4,7947 | -0,6832 | |
| 0,03 | 4,23 | 5,0388 | -0,5375 | |
| 0,00 | 0,00 | -0,3996 | ||
| 0,00 | 0,00 | -0,3623 | ||
| 0,00 | 0,00 | -0,3013 |
13F og Fondsarkivering
Denne formular blev indsendt den 2016-11-09 for rapporteringsperioden 2016-09-30. Klik på linkikonet for at se den fulde transaktionshistorik.
Opgrader for at låse op for premium-data og eksportere til Excel ![]() .
.
| Sikkerhed | Type | Gennemsnitlig aktiekurs | Aktier (MM) |
Δ Aktier (%) |
Δ Aktier (%) |
Værdi ($MM) |
Portefølje (%) |
ΔPortefølje (%) |
|
|---|---|---|---|---|---|---|---|---|---|
| DHR / Danaher Corporation | 0,09 | 24,97 | 7,34 | -3,02 | 8,7429 | -0,6841 | |||
| TMO / Thermo Fisher Scientific Inc. | 0,04 | -21,26 | 6,91 | -15,23 | 8,2226 | -1,9203 | |||
| XYL / Xylem Inc. | 0,10 | -21,33 | 5,32 | -7,61 | 6,3354 | -0,8345 | |||
| AOS / A. O. Smith Corporation | 0,05 | 4,09 | 4,84 | 16,72 | 5,7687 | 0,6007 | |||
| WAT / Waters Corporation | 0,03 | -16,17 | 4,23 | -5,51 | 5,0388 | -0,5375 | |||
| A / Agilent Technologies, Inc. | 0,09 | -13,79 | 4,03 | -8,48 | 4,7947 | -0,6832 | |||
| PH / Parker-Hannifin Corporation | 0,02 | 0,00 | 3,00 | 3,5707 | 3,5707 | ||||
| PNR / Pentair plc | 0,04 | -5,64 | 2,81 | 3,99 | 3,3505 | -0,0185 | |||
| PKI / Revvity Inc. | 0,05 | -1,76 | 2,73 | 5,20 | 3,2517 | 0,0197 | |||
| WM / Waste Management, Inc. | 0,04 | 4,09 | 2,72 | 0,18 | 3,2338 | -0,1414 | |||
| VMI / Valmont Industries, Inc. | 0,02 | 14,73 | 2,62 | 14,14 | 3,1135 | 0,2613 | |||
| TRMB / Trimble Inc. | 0,09 | -3,44 | 2,51 | 13,21 | 2,9897 | 0,2283 | |||
| RSG / Republic Services, Inc. | 0,05 | 4,09 | 2,42 | 2,33 | 2,8754 | -0,0628 | |||
| MAS / Masco Corporation | 0,07 | -11,24 | 2,31 | -1,54 | 2,7468 | -0,1702 | |||
| TTEK / Tetra Tech, Inc. | 0,06 | -10,11 | 2,24 | 3,66 | 2,6670 | -0,0234 | |||
| SEE / Sealed Air Corporation | 0,04 | 4,57 | 2,03 | 4,26 | 2,4182 | -0,0070 | |||
| IEX / IDEX Corporation | 0,02 | 4,10 | 1,93 | 18,65 | 2,2956 | 0,2725 | |||
| ITRI / Itron, Inc. | 0,03 | 14,64 | 1,91 | 48,40 | 2,2706 | 0,6708 | |||
| ANSS / ANSYS, Inc. | 0,02 | 12,98 | 1,85 | 15,29 | 2,1991 | 0,2047 | |||
| FLS / Flowserve Corporation | 0,04 | 4,08 | 1,74 | 11,20 | 2,0682 | 0,1235 | |||
| AWK / American Water Works Company, Inc. | 0,02 | 27,77 | 1,69 | 13,12 | 2,0122 | 0,1522 | |||
| CTAS / Cintas Corporation | 0,01 | 1,53 | 1,8169 | 1,8169 | |||||
| US2243991054 / Crane Co. | 0,02 | 4,08 | 1,49 | 15,63 | 1,7788 | 1,7788 | |||
| 129603106 / Calgon Carbon Corp. | 0,07 | 21,56 | 1,13 | 40,35 | 1,3419 | 0,3421 | |||
| FLOW / Global X Funds - Global X U.S. Cash Flow Kings 100 ETF | 0,03 | -10,38 | 1,05 | 6,39 | 1,2490 | 1,2490 | |||
| WTRG / Essential Utilities, Inc. | 0,03 | -27,33 | 0,89 | -37,89 | 1,0597 | -0,7244 | |||
| POWI / Power Integrations, Inc. | 0,01 | 17,39 | 0,85 | 47,74 | 1,0132 | 0,2961 | |||
| MCHP / Microchip Technology Incorporated | 0,01 | -16,13 | 0,81 | 2,67 | 0,9620 | -0,0178 | |||
| NJR / New Jersey Resources Corporation | 0,02 | 63,33 | 0,81 | 39,27 | 0,9585 | 0,2389 | |||
| XLNX / Xilinx, Inc. | 0,01 | -20,59 | 0,73 | -6,38 | 0,8739 | -0,1021 | |||
| UGI / UGI Corporation | 0,02 | 45,45 | 0,72 | 45,38 | 0,8620 | 0,2420 | |||
| ROK / Rockwell Automation, Inc. | 0,01 | 34,88 | 0,71 | 43,72 | 0,8454 | 0,2303 | |||
| ON / ON Semiconductor Corporation | 0,05 | -29,61 | 0,66 | -1,64 | 0,7846 | 0,7846 | |||
| MPWR / Monolithic Power Systems, Inc. | 0,01 | -5,88 | 0,64 | 10,84 | 0,7668 | 0,0434 | |||
| SRE / Sempra | 0,01 | 0,00 | 0,54 | 0,6382 | 0,6382 | ||||
| WGL / WGL Holdings, Inc. | 0,01 | 193,10 | 0,53 | 160,00 | 0,6346 | 0,3794 | |||
| SSNI / Silver Spring Networks, Inc. | 0,04 | 1,43 | 0,50 | 18,35 | 0,5989 | 0,0698 | |||
| AGR / Avangrid, Inc. | 0,01 | -26,67 | 0,46 | -33,43 | 0,5477 | 0,5477 | |||
| 872307903 / TCF Financial Corporation | 0,01 | 15,38 | 0,45 | 7,13 | 0,5370 | 0,5370 | |||
| SJI / South Jersey Industries Inc. | 0,01 | 0,43 | 0,5096 | 0,5096 | |||||
| PTC / PTC Inc. | 0,01 | 39,71 | 0,42 | 64,45 | 0,5013 | 0,1825 | |||
| ETN / Eaton Corporation plc | 0,01 | -37,50 | 0,39 | -31,24 | 0,4691 | 0,4691 | |||
| PEGI / Pattern Energy Group Inc. | 0,01 | 16,52 | 0,30 | 14,02 | 0,3584 | 0,3584 | |||
| CWCO / Consolidated Water Co. Ltd. | 0,02 | -17,34 | 0,28 | -26,42 | 0,3381 | 0,3381 | |||
| FCEL / FuelCell Energy, Inc. | 0,03 | 34,69 | 0,18 | 17,76 | 0,2131 | 0,0239 | |||
| IXYS / IXYS Corp. | 0,01 | 0,00 | 0,17 | 17,36 | 0,2012 | 0,2012 | |||
| IPWR / Ideal Power Inc. | 0,01 | -14,82 | 0,08 | -10,59 | 0,0905 | 0,0905 | |||
| ENPH / Enphase Energy, Inc. | 0,06 | -48,40 | 0,07 | -69,43 | 0,0833 | -0,2018 | |||
| 74005P104 / Praxair, Inc. | 0,00 | -100,00 | 0,00 | -100,00 | -0,3013 | ||||
| HXL / Hexcel Corporation | 0,00 | -100,00 | 0,00 | -100,00 | -0,3996 | ||||
| SPWR / Complete Solaria, Inc. | 0,00 | -100,00 | 0,00 | -100,00 | 0,0000 | ||||
| MWA / Mueller Water Products, Inc. | 0,00 | -100,00 | 0,00 | -100,00 | 0,0000 | ||||
| RUN / Sunrun Inc. | 0,00 | -100,00 | 0,00 | -100,00 | -0,1407 | ||||
| FSLR / First Solar, Inc. | 0,00 | -100,00 | 0,00 | -100,00 | -0,3623 | ||||
| CSIQ / Canadian Solar Inc. | 0,00 | -100,00 | 0,00 | -100,00 | 0,0000 | ||||
| CWT / California Water Service Group | 0,00 | -100,00 | 0,00 | -100,00 | -1,2699 |