Grundlæggende statistik
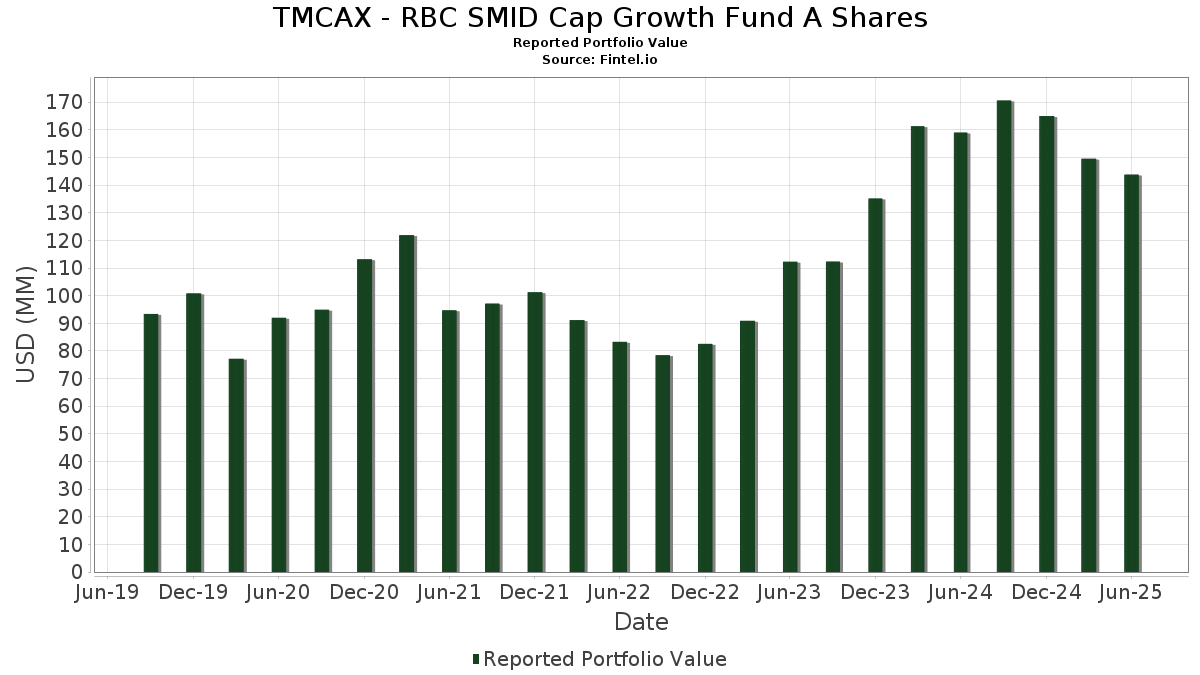
| Porteføljeværdi | $ 143.773.706 |
| Nuværende stillinger | 77 |
Seneste beholdninger, ydeevne, AUM (fra 13F, 13D)
TMCAX - RBC SMID Cap Growth Fund A Shares har afsløret 77 samlede besiddelser i deres seneste SEC-arkivering. Den seneste porteføljeværdi er beregnet til at være $ 143.773.706 USD. Faktiske aktiver under forvaltning (AUM) er denne værdi plus kontanter (som ikke er oplyst). TMCAX - RBC SMID Cap Growth Fund A Sharess største beholdninger er TechnipFMC plc (US:FTI) , Ollie's Bargain Outlet Holdings, Inc. (US:OLLI) , CyberArk Software Ltd. (US:CYBR) , Merit Medical Systems, Inc. (US:MMSI) , and Integer Holdings Corporation (US:ITGR) . TMCAX - RBC SMID Cap Growth Fund A Sharess nye stillinger omfatter CAVA Group, Inc. (US:CAVA) , Shift4 Payments, Inc. (US:FOUR) , CSW Industrials, Inc. (US:CSWI) , ADMA Biologics, Inc. (US:ADMA) , and .
Top øger dette kvartal
Vi bruger ændringen i porteføljeallokeringen, fordi dette er den mest meningsfulde metrik. Ændringer kan skyldes handler eller ændringer i aktiekurser.
| Sikkerhed | Aktier (MM) |
Værdi (MM$) |
Portefølje % | ΔPortefølje % |
|---|---|---|---|---|
| 0,02 | 1,56 | 1,0876 | 1,0876 | |
| 0,01 | 1,18 | 0,8235 | 0,8235 | |
| 0,00 | 1,07 | 0,7451 | 0,7451 | |
| 0,05 | 0,95 | 0,6624 | 0,6624 | |
| 0,01 | 2,48 | 1,7297 | 0,3442 | |
| 0,01 | 3,22 | 2,2393 | 0,3359 | |
| 0,05 | 2,44 | 1,7012 | 0,2812 | |
| 0,01 | 1,97 | 1,3742 | 0,2783 | |
| 0,05 | 1,57 | 1,0926 | 0,2609 | |
| 0,01 | 3,01 | 2,0985 | 0,2401 |
Top falder i dette kvartal
Vi bruger ændringen i porteføljeallokeringen, fordi dette er den mest meningsfulde metrik. Ændringer kan skyldes handler eller ændringer i aktiekurser.
| Sikkerhed | Aktier (MM) |
Værdi (MM$) |
Portefølje % | ΔPortefølje % |
|---|---|---|---|---|
| 0,61 | 0,61 | 0,4268 | -2,6004 | |
| 0,04 | 3,56 | 2,4797 | -0,4460 | |
| 0,01 | 1,77 | 1,2350 | -0,4418 | |
| 0,11 | 0,54 | 0,3746 | -0,3341 | |
| 0,02 | 1,83 | 1,2737 | -0,3243 | |
| 0,06 | 2,69 | 1,8763 | -0,2333 | |
| 0,03 | 1,76 | 1,2240 | -0,2315 | |
| 0,05 | 1,13 | 0,7863 | -0,2160 | |
| 0,05 | 1,08 | 0,7507 | -0,2055 | |
| 0,02 | 1,02 | 0,7118 | -0,1975 |
13F og Fondsarkivering
Denne formular blev indsendt den 2025-08-25 for rapporteringsperioden 2025-06-30. Klik på linkikonet for at se den fulde transaktionshistorik.
Opgrader for at låse op for premium-data og eksportere til Excel ![]() .
.
| Sikkerhed | Type | Gennemsnitlig aktiekurs | Aktier (MM) |
Δ Aktier (%) |
Δ Aktier (%) |
Værdi ($MM) |
Portefølje (%) |
ΔPortefølje (%) |
|
|---|---|---|---|---|---|---|---|---|---|
| FTI / TechnipFMC plc | 0,13 | -14,54 | 4,31 | -7,13 | 3,0020 | -0,1052 | |||
| OLLI / Ollie's Bargain Outlet Holdings, Inc. | 0,03 | -7,87 | 4,09 | 4,34 | 2,8469 | 0,2239 | |||
| CYBR / CyberArk Software Ltd. | 0,01 | -14,38 | 3,73 | 3,07 | 2,5982 | 0,1748 | |||
| MMSI / Merit Medical Systems, Inc. | 0,04 | -7,86 | 3,56 | -18,52 | 2,4797 | -0,4460 | |||
| ITGR / Integer Holdings Corporation | 0,03 | -7,86 | 3,55 | -3,98 | 2,4699 | -0,0031 | |||
| WWD / Woodward, Inc. | 0,01 | -15,79 | 3,22 | 13,08 | 2,2393 | 0,3359 | |||
| SF / Stifel Financial Corp. | 0,03 | -7,85 | 3,14 | 1,45 | 2,1878 | 0,1147 | |||
| CASY / Casey's General Stores, Inc. | 0,01 | -7,66 | 3,01 | 8,58 | 2,0985 | 0,2401 | |||
| HAE / Haemonetics Corporation | 0,04 | -7,86 | 2,98 | 8,20 | 2,0762 | 0,2311 | |||
| BURL / Burlington Stores, Inc. | 0,01 | -7,78 | 2,73 | -10,00 | 1,9005 | -0,1292 | |||
| EXLS / ExlService Holdings, Inc. | 0,06 | -7,82 | 2,69 | -14,50 | 1,8763 | -0,2333 | |||
| RBC / RBC Bearings Incorporated | 0,01 | -7,70 | 2,63 | 10,37 | 1,8304 | 0,2362 | |||
| TTEK / Tetra Tech, Inc. | 0,07 | -18,63 | 2,60 | 0,04 | 1,8099 | 0,0706 | |||
| CACI / CACI International Inc | 0,01 | -7,62 | 2,48 | 20,01 | 1,7297 | 0,3442 | |||
| PFGC / Performance Food Group Company | 0,03 | -7,89 | 2,46 | 2,46 | 1,7143 | 0,1060 | |||
| MRCY / Mercury Systems, Inc. | 0,05 | -7,86 | 2,44 | 15,13 | 1,7012 | 0,2812 | |||
| KNSL / Kinsale Capital Group, Inc. | 0,00 | -7,71 | 2,37 | -8,23 | 1,6537 | -0,0789 | |||
| PLNT / Planet Fitness, Inc. | 0,02 | -7,87 | 2,25 | 3,98 | 1,5645 | 0,1182 | |||
| NPO / Enpro Inc. | 0,01 | -7,89 | 2,24 | 9,07 | 1,5581 | 0,1846 | |||
| ATEC / Alphatec Holdings, Inc. | 0,20 | -7,84 | 2,21 | 0,87 | 1,5381 | 0,0725 | |||
| ATR / AptarGroup, Inc. | 0,01 | -7,90 | 2,19 | -2,93 | 1,5236 | 0,0151 | |||
| NXST / Nexstar Media Group, Inc. | 0,01 | -7,88 | 2,12 | -11,11 | 1,4776 | -0,1204 | |||
| PCTY / Paylocity Holding Corporation | 0,01 | -7,76 | 2,09 | -10,76 | 1,4549 | -0,1129 | |||
| VCEL / Vericel Corporation | 0,05 | -7,86 | 2,06 | -12,17 | 1,4381 | -0,1353 | |||
| STVN / Stevanato Group S.p.A. | 0,08 | -7,84 | 2,03 | 10,28 | 1,4118 | 0,1809 | |||
| JBTM / JBT Marel Corporation | 0,02 | -7,87 | 2,01 | -9,32 | 1,4020 | -0,0845 | |||
| IBP / Installed Building Products, Inc. | 0,01 | -7,81 | 2,00 | -3,05 | 1,3935 | 0,0118 | |||
| WEX / WEX Inc. | 0,01 | -7,88 | 1,98 | -13,79 | 1,3762 | -0,1589 | |||
| SLAB / Silicon Laboratories Inc. | 0,01 | -7,91 | 1,97 | 20,60 | 1,3742 | 0,2783 | |||
| SPSC / SPS Commerce, Inc. | 0,01 | -7,91 | 1,96 | -5,58 | 1,3678 | -0,0248 | |||
| BWIN / The Baldwin Insurance Group, Inc. | 0,05 | -7,85 | 1,94 | -11,72 | 1,3476 | -0,1200 | |||
| HQY / HealthEquity, Inc. | 0,02 | -7,88 | 1,85 | 9,21 | 1,2880 | 0,1542 | |||
| ONTO / Onto Innovation Inc. | 0,02 | -7,88 | 1,83 | -23,39 | 1,2737 | -0,3243 | |||
| TXRH / Texas Roadhouse, Inc. | 0,01 | -7,83 | 1,81 | 3,67 | 1,2595 | 0,0915 | |||
| AIT / Applied Industrial Technologies, Inc. | 0,01 | -7,75 | 1,80 | -4,87 | 1,2519 | -0,0128 | |||
| MANH / Manhattan Associates, Inc. | 0,01 | 2,96 | 1,79 | 17,49 | 1,2450 | 0,2263 | |||
| DT / Dynatrace, Inc. | 0,03 | -7,84 | 1,78 | 7,89 | 1,2381 | 0,1351 | |||
| BMI / Badger Meter, Inc. | 0,01 | -16,66 | 1,78 | 7,31 | 1,2373 | 0,1288 | |||
| FCFS / FirstCash Holdings, Inc. | 0,01 | -7,92 | 1,78 | 3,44 | 1,2363 | 0,0871 | |||
| MEDP / Medpace Holdings, Inc. | 0,01 | -31,27 | 1,77 | -29,19 | 1,2350 | -0,4418 | |||
| TECH / Bio-Techne Corporation | 0,03 | -7,87 | 1,76 | -19,18 | 1,2240 | -0,2315 | |||
| JKHY / Jack Henry & Associates, Inc. | 0,01 | -7,73 | 1,74 | -8,99 | 1,2136 | -0,0678 | |||
| GXO / GXO Logistics, Inc. | 0,04 | -7,85 | 1,73 | 14,86 | 1,2057 | 0,1963 | |||
| DIOD / Diodes Incorporated | 0,03 | -7,86 | 1,68 | 12,84 | 1,1698 | 0,1736 | |||
| RDNT / RadNet, Inc. | 0,03 | -7,86 | 1,66 | 5,48 | 1,1530 | 0,1021 | |||
| RGEN / Repligen Corporation | 0,01 | -7,85 | 1,65 | -9,89 | 1,1486 | -0,0772 | |||
| LAMR / Lamar Advertising Company | 0,01 | -7,89 | 1,64 | -1,74 | 1,1439 | 0,0245 | |||
| ALKT / Alkami Technology, Inc. | 0,05 | 10,00 | 1,57 | 26,25 | 1,0926 | 0,2609 | |||
| CAVA / CAVA Group, Inc. | 0,02 | 1,56 | 1,0876 | 1,0876 | |||||
| S3P / Sapiens International Corporation N.V. | 0,05 | -7,85 | 1,51 | -0,53 | 1,0544 | 0,0356 | |||
| CBZ / CBIZ, Inc. | 0,02 | 29,68 | 1,48 | 22,61 | 1,0278 | 0,2218 | |||
| ICFI / ICF International, Inc. | 0,02 | -7,90 | 1,45 | -8,16 | 1,0113 | -0,0475 | |||
| INFA / Informatica Inc. | 0,06 | -40,70 | 1,45 | -17,24 | 1,0099 | -0,1633 | |||
| BCPC / Balchem Corporation | 0,01 | -7,90 | 1,45 | -11,72 | 1,0076 | -0,0891 | |||
| APPF / AppFolio, Inc. | 0,01 | -7,68 | 1,44 | -3,29 | 1,0024 | 0,0056 | |||
| UFPT / UFP Technologies, Inc. | 0,01 | -7,68 | 1,44 | 11,82 | 1,0016 | 0,1400 | |||
| NOVT / Novanta Inc. | 0,01 | -7,98 | 1,43 | -7,21 | 0,9945 | -0,0359 | |||
| LTH / Life Time Group Holdings, Inc. | 0,05 | 21,76 | 1,41 | 22,27 | 0,9833 | 0,2103 | |||
| DORM / Dorman Products, Inc. | 0,01 | 15,78 | 1,33 | 17,88 | 0,9278 | 0,1708 | |||
| PLUS / ePlus inc. | 0,02 | -7,90 | 1,29 | 8,81 | 0,8952 | 0,1042 | |||
| AGCO / AGCO Corporation | 0,01 | -7,91 | 1,23 | 2,60 | 0,8535 | 0,0540 | |||
| CRL / Charles River Laboratories International, Inc. | 0,01 | -7,89 | 1,22 | -7,15 | 0,8507 | -0,0301 | |||
| LFUS / Littelfuse, Inc. | 0,01 | -7,79 | 1,21 | 6,34 | 0,8413 | 0,0802 | |||
| FOUR / Shift4 Payments, Inc. | 0,01 | 1,18 | 0,8235 | 0,8235 | |||||
| CWAN / Clearwater Analytics Holdings, Inc. | 0,05 | -7,84 | 1,13 | -24,65 | 0,7863 | -0,2160 | |||
| GIII / G-III Apparel Group, Ltd. | 0,05 | -7,85 | 1,08 | -24,58 | 0,7507 | -0,2055 | |||
| LCII / LCI Industries | 0,01 | -7,92 | 1,07 | -3,95 | 0,7455 | -0,0007 | |||
| CSWI / CSW Industrials, Inc. | 0,00 | 1,07 | 0,7451 | 0,7451 | |||||
| FRPT / Freshpet, Inc. | 0,02 | -7,90 | 1,02 | -24,74 | 0,7118 | -0,1975 | |||
| ADMA / ADMA Biologics, Inc. | 0,05 | 0,95 | 0,6624 | 0,6624 | |||||
| LSTR / Landstar System, Inc. | 0,01 | -7,93 | 0,92 | -14,83 | 0,6407 | -0,0821 | |||
| CERT / Certara, Inc. | 0,08 | -7,84 | 0,91 | 8,87 | 0,6328 | 0,0742 | |||
| AZTA / Azenta, Inc. | 0,03 | -7,86 | 0,82 | -18,17 | 0,5681 | -0,0989 | |||
| GLOB / Globant S.A. | 0,01 | -8,02 | 0,64 | -29,05 | 0,4426 | -0,1569 | |||
| HMUXX / US GOVERNMENT MONEY MARKET FUND | 0,61 | -86,45 | 0,61 | -86,46 | 0,4268 | -2,6004 | |||
| NEOG / Neogen Corporation | 0,11 | -7,84 | 0,54 | -49,24 | 0,3746 | -0,3341 | |||
| ACHC / Acadia Healthcare Company, Inc. | 0,01 | -7,91 | 0,30 | -31,14 | 0,2116 | -0,0836 |