Grundlæggende statistik
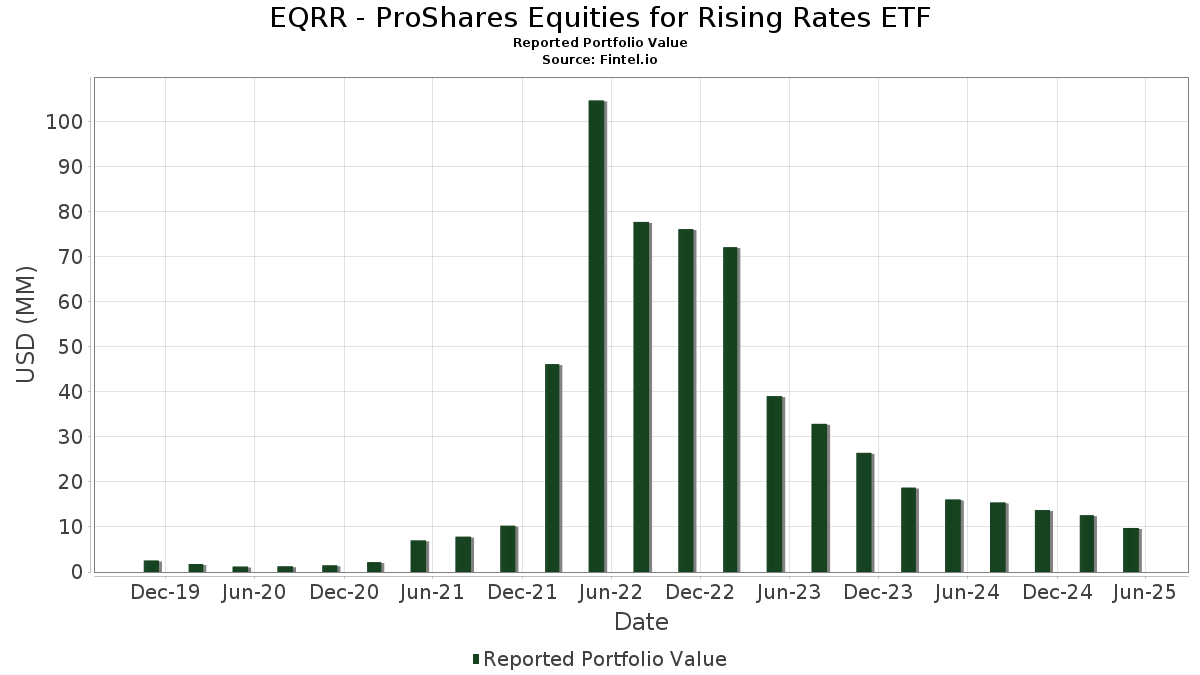
| Porteføljeværdi | $ 9.773.279 |
| Nuværende stillinger | 58 |
Seneste beholdninger, ydeevne, AUM (fra 13F, 13D)
EQRR - ProShares Equities for Rising Rates ETF har afsløret 58 samlede besiddelser i deres seneste SEC-arkivering. Den seneste porteføljeværdi er beregnet til at være $ 9.773.279 USD. Faktiske aktiver under forvaltning (AUM) er denne værdi plus kontanter (som ikke er oplyst). EQRR - ProShares Equities for Rising Rates ETFs største beholdninger er Marathon Petroleum Corporation (US:MPC) , Valero Energy Corporation (US:VLO) , Walmart Inc. (US:WMT) , United Airlines Holdings, Inc. (US:UAL) , and Dollar General Corporation (US:DG) . EQRR - ProShares Equities for Rising Rates ETFs nye stillinger omfatter Walmart Inc. (US:WMT) , Dollar General Corporation (US:DG) , The TJX Companies, Inc. (US:TJX) , Deckers Outdoor Corporation (US:DECK) , and Tractor Supply Company (US:TSCO) .
Top øger dette kvartal
Vi bruger ændringen i porteføljeallokeringen, fordi dette er den mest meningsfulde metrik. Ændringer kan skyldes handler eller ændringer i aktiekurser.
| Sikkerhed | Aktier (MM) |
Værdi (MM$) |
Portefølje % | ΔPortefølje % |
|---|---|---|---|---|
| 0,00 | 0,28 | 2,8925 | 2,8925 | |
| 0,00 | 0,28 | 2,8186 | 2,8186 | |
| 0,00 | 0,26 | 2,6805 | 2,6805 | |
| 0,00 | 0,23 | 2,3581 | 2,3581 | |
| 0,00 | 0,22 | 2,2576 | 2,2576 | |
| 0,00 | 0,20 | 2,0402 | 2,0402 | |
| 0,01 | 0,20 | 1,9913 | 1,9913 | |
| 0,00 | 0,19 | 1,9030 | 1,9030 | |
| 0,00 | 0,16 | 1,6493 | 1,6493 | |
| 0,00 | 0,15 | 1,5272 | 1,5272 |
Top falder i dette kvartal
Vi bruger ændringen i porteføljeallokeringen, fordi dette er den mest meningsfulde metrik. Ændringer kan skyldes handler eller ændringer i aktiekurser.
| Sikkerhed | Aktier (MM) |
Værdi (MM$) |
Portefølje % | ΔPortefølje % |
|---|---|---|---|---|
| 0,00 | 0,19 | 1,9032 | -1,5943 | |
| 0,00 | 0,00 | -1,4541 | ||
| 0,01 | 0,24 | 2,5000 | -1,1192 | |
| 0,01 | 0,23 | 2,3615 | -0,7696 | |
| 0,00 | 0,24 | 2,4632 | -0,6656 | |
| 0,01 | 0,25 | 2,5396 | -0,5718 | |
| 0,00 | 0,18 | 1,8866 | -0,4926 | |
| 0,00 | 0,21 | 2,1200 | -0,4701 | |
| 0,00 | 0,21 | 2,1522 | -0,4699 | |
| 0,00 | 0,20 | 2,0785 | -0,4456 |
13F og Fondsarkivering
Denne formular blev indsendt den 2025-07-28 for rapporteringsperioden 2025-05-31. Klik på linkikonet for at se den fulde transaktionshistorik.
Opgrader for at låse op for premium-data og eksportere til Excel ![]() .
.
| Sikkerhed | Type | Gennemsnitlig aktiekurs | Aktier (MM) |
Δ Aktier (%) |
Δ Aktier (%) |
Værdi ($MM) |
Portefølje (%) |
ΔPortefølje (%) |
|
|---|---|---|---|---|---|---|---|---|---|
| MPC / Marathon Petroleum Corporation | 0,00 | -22,98 | 0,33 | -17,42 | 3,3394 | 0,1963 | |||
| VLO / Valero Energy Corporation | 0,00 | -25,56 | 0,29 | -26,60 | 2,9375 | -0,1662 | |||
| WMT / Walmart Inc. | 0,00 | 0,28 | 2,8925 | 2,8925 | |||||
| UAL / United Airlines Holdings, Inc. | 0,00 | 45,10 | 0,28 | 22,67 | 2,8233 | 1,0405 | |||
| DG / Dollar General Corporation | 0,00 | 0,28 | 2,8186 | 2,8186 | |||||
| TJX / The TJX Companies, Inc. | 0,00 | 0,26 | 2,6805 | 2,6805 | |||||
| GPC / Genuine Parts Company | 0,00 | 52,21 | 0,26 | 52,63 | 2,6660 | 1,4190 | |||
| XOM / Exxon Mobil Corporation | 0,00 | -26,10 | 0,25 | -32,09 | 2,5995 | -0,3708 | |||
| EOG / EOG Resources, Inc. | 0,00 | -22,20 | 0,25 | -33,42 | 2,5670 | -0,4265 | |||
| FANG / Diamondback Energy, Inc. | 0,00 | -17,75 | 0,25 | -30,56 | 2,5591 | -0,2931 | |||
| CTRA / Coterra Energy Inc. | 0,01 | -29,68 | 0,25 | -36,73 | 2,5396 | -0,5718 | |||
| FOXA / Fox Corporation | 0,00 | -7,65 | 0,25 | -11,87 | 2,5038 | 0,2981 | |||
| OXY / Occidental Petroleum Corporation | 0,01 | -84,29 | 0,24 | -85,40 | 2,5000 | -1,1192 | |||
| COP / ConocoPhillips | 0,00 | -22,59 | 0,24 | -33,33 | 2,4955 | -0,4106 | |||
| AZO / AutoZone, Inc. | 0,00 | -12,16 | 0,24 | -6,20 | 2,4772 | 0,4296 | |||
| CVX / Chevron Corporation | 0,00 | -29,12 | 0,24 | -38,83 | 2,4632 | -0,6656 | |||
| ORLY / O'Reilly Automotive, Inc. | 0,00 | -12,56 | 0,24 | -13,19 | 2,4292 | 0,2638 | |||
| SLB / Schlumberger Limited | 0,01 | -26,23 | 0,23 | -41,52 | 2,3615 | -0,7696 | |||
| DECK / Deckers Outdoor Corporation | 0,00 | 0,23 | 2,3581 | 2,3581 | |||||
| TSCO / Tractor Supply Company | 0,00 | 0,22 | 2,2576 | 2,2576 | |||||
| MCK / McKesson Corporation | 0,00 | -43,33 | 0,21 | -36,56 | 2,1522 | -0,4699 | |||
| COR / Cencora, Inc. | 0,00 | -49,75 | 0,21 | -41,85 | 2,1200 | -0,4701 | |||
| MO / Altria Group, Inc. | 0,00 | -41,12 | 0,20 | -36,16 | 2,0785 | -0,4456 | |||
| KR / The Kroger Co. | 0,00 | 0,20 | 2,0402 | 2,0402 | |||||
| CASY / Casey's General Stores, Inc. | 0,00 | -38,51 | 0,20 | -34,97 | 2,0334 | -0,3946 | |||
| ADM / Archer-Daniels-Midland Company | 0,00 | -30,93 | 0,20 | -29,14 | 2,0116 | -0,1982 | |||
| KDP / Keurig Dr Pepper Inc. | 0,01 | 0,20 | 1,9913 | 1,9913 | |||||
| STZ / Constellation Brands, Inc. | 0,00 | -20,72 | 0,19 | -19,57 | 1,9367 | 0,0710 | |||
| CVS / CVS Health Corporation | 0,00 | -56,67 | 0,19 | -57,82 | 1,9032 | -1,5943 | |||
| IBKR / Interactive Brokers Group, Inc. | 0,00 | 0,19 | 1,9030 | 1,9030 | |||||
| HSY / The Hershey Company | 0,00 | -33,87 | 0,18 | -38,67 | 1,8866 | -0,4926 | |||
| LPLA / LPL Financial Holdings Inc. | 0,00 | -18,92 | 0,17 | -15,50 | 1,7273 | 0,1400 | |||
| CME / CME Group Inc. | 0,00 | 0,16 | 1,6493 | 1,6493 | |||||
| JPM / JPMorgan Chase & Co. | 0,00 | -18,68 | 0,16 | -18,88 | 1,6306 | 0,0708 | |||
| WFC / Wells Fargo & Company | 0,00 | -17,84 | 0,15 | -21,83 | 1,5818 | 0,0171 | |||
| RGA / Reinsurance Group of America, Incorporated | 0,00 | -11,79 | 0,15 | -11,11 | 1,5524 | 0,1908 | |||
| PGR / The Progressive Corporation | 0,00 | 0,15 | 1,5272 | 1,5272 | |||||
| AIG / American International Group, Inc. | 0,00 | -28,61 | 0,15 | -27,09 | 1,5156 | -0,0987 | |||
| MET / MetLife, Inc. | 0,00 | -15,23 | 0,15 | -22,46 | 1,4825 | -0,0057 | |||
| EG / Everest Group, Ltd. | 0,00 | 0,14 | 1,4355 | 1,4355 | |||||
| ZS / Zscaler, Inc. | 0,00 | 0,13 | 1,3341 | 1,3341 | |||||
| JBL / Jabil Inc. | 0,00 | 0,12 | 1,2315 | 1,2315 | |||||
| DELL / Dell Technologies Inc. | 0,00 | 0,12 | 1,2018 | 1,2018 | |||||
| PSTG / Pure Storage, Inc. | 0,00 | 0,11 | 1,1604 | 1,1604 | |||||
| CDW / CDW Corporation | 0,00 | 0,11 | 1,1158 | 1,1158 | |||||
| GOOGL / Alphabet Inc. | 0,00 | 0,11 | 1,1098 | 1,1098 | |||||
| LDOS / Leidos Holdings, Inc. | 0,00 | 0,11 | 1,1069 | 1,1069 | |||||
| NTNX / Nutanix, Inc. | 0,00 | 0,11 | 1,0765 | 1,0765 | |||||
| IBM / International Business Machines Corporation | 0,00 | 0,10 | 1,0605 | 1,0605 | |||||
| HPQ / HP Inc. | 0,00 | 0,09 | 0,8895 | 0,8895 | |||||
| Repurchase Agreement / RA (000000000) | 0,00 | 0,0140 | 0,0140 | ||||||
| Repurchase Agreement / RA (000000000) | 0,00 | 0,0135 | 0,0135 | ||||||
| Repurchase Agreement / RA (000000000) | 0,00 | 0,0094 | 0,0094 | ||||||
| Repurchase Agreement / RA (000000000) | 0,00 | 0,0081 | 0,0081 | ||||||
| Repurchase Agreement / RA (000000000) | 0,00 | 0,0067 | 0,0067 | ||||||
| Repurchase Agreement / RA (000000000) | 0,00 | 0,0047 | 0,0047 | ||||||
| Repurchase Agreement / RA (000000000) | 0,00 | 0,0040 | 0,0040 | ||||||
| Repurchase Agreement / RA (000000000) | 0,00 | 0,0007 | 0,0007 | ||||||
| L / Loews Corporation | 0,00 | -100,00 | 0,00 | -100,00 | -1,4541 |