Grundlæggende statistik
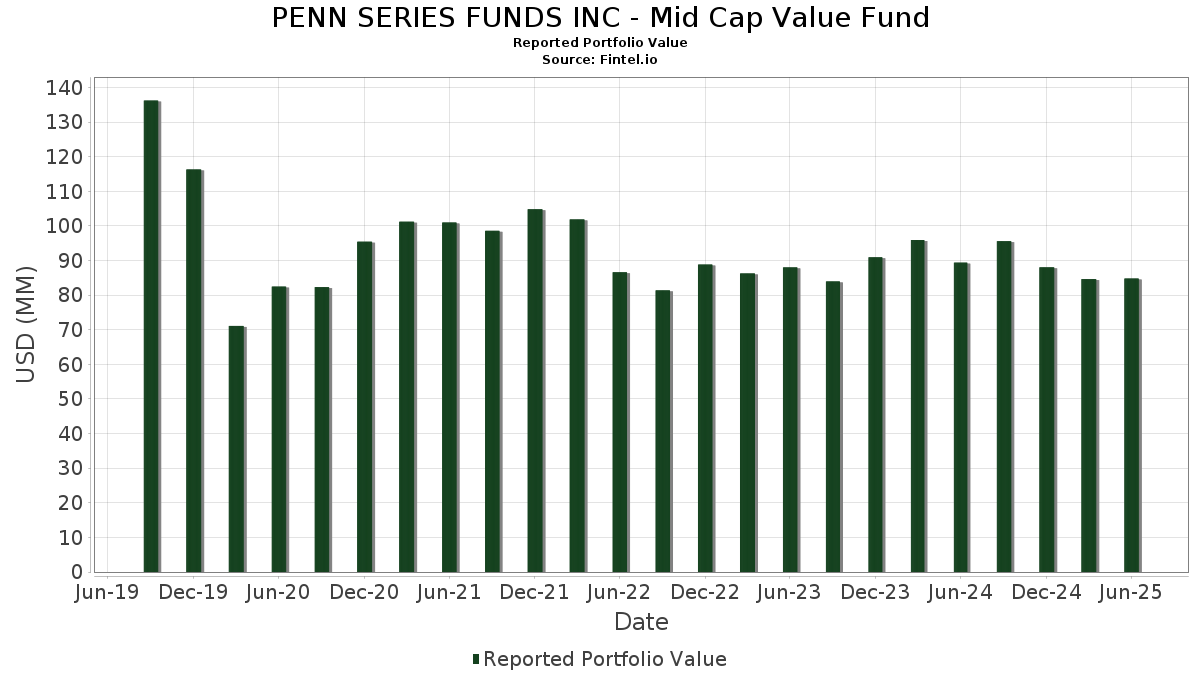
| Porteføljeværdi | $ 84.787.651 |
| Nuværende stillinger | 74 |
Seneste beholdninger, ydeevne, AUM (fra 13F, 13D)
PENN SERIES FUNDS INC - Mid Cap Value Fund har afsløret 74 samlede besiddelser i deres seneste SEC-arkivering. Den seneste porteføljeværdi er beregnet til at være $ 84.787.651 USD. Faktiske aktiver under forvaltning (AUM) er denne værdi plus kontanter (som ikke er oplyst). PENN SERIES FUNDS INC - Mid Cap Value Funds største beholdninger er Casey's General Stores, Inc. (US:CASY) , Expand Energy Corporation (US:EXE) , Freeport-McMoRan Inc. (US:FCX) , Alliant Energy Corporation (US:LNT) , and Blackrock Liquidity Funds - BlackRock Liquidity Funds FedFund Portfolio Institutional Class (US:TFDXX) . PENN SERIES FUNDS INC - Mid Cap Value Funds nye stillinger omfatter Selective Insurance Group, Inc. (US:SIGI) , TopBuild Corp. (US:BLD) , Valero Energy Corporation (US:VLO) , Saia, Inc. (US:SAIA) , and Boot Barn Holdings, Inc. (US:BOOT) .
Top øger dette kvartal
Vi bruger ændringen i porteføljeallokeringen, fordi dette er den mest meningsfulde metrik. Ændringer kan skyldes handler eller ændringer i aktiekurser.
| Sikkerhed | Aktier (MM) |
Værdi (MM$) |
Portefølje % | ΔPortefølje % |
|---|---|---|---|---|
| 0,02 | 1,45 | 1,7112 | 1,7112 | |
| 0,00 | 0,93 | 1,0993 | 1,0993 | |
| 1,91 | 1,91 | 2,2526 | 1,0755 | |
| 0,01 | 1,86 | 2,1988 | 0,9736 | |
| 0,01 | 0,81 | 0,9541 | 0,9541 | |
| 0,01 | 1,68 | 1,9890 | 0,7872 | |
| 0,00 | 0,63 | 0,7427 | 0,7427 | |
| 0,01 | 0,51 | 0,6041 | 0,6041 | |
| 0,00 | 0,48 | 0,5656 | 0,5656 | |
| 0,01 | 1,01 | 1,1972 | 0,5538 |
Top falder i dette kvartal
Vi bruger ændringen i porteføljeallokeringen, fordi dette er den mest meningsfulde metrik. Ændringer kan skyldes handler eller ændringer i aktiekurser.
| Sikkerhed | Aktier (MM) |
Værdi (MM$) |
Portefølje % | ΔPortefølje % |
|---|---|---|---|---|
| 0,00 | 0,38 | 0,4498 | -0,9902 | |
| 0,00 | 0,58 | 0,6887 | -0,9518 | |
| 0,01 | 0,63 | 0,7438 | -0,7287 | |
| 0,00 | 0,25 | 0,2916 | -0,7282 | |
| 0,00 | 0,35 | 0,4104 | -0,6551 | |
| 0,03 | 2,02 | 2,3862 | -0,5738 | |
| 0,00 | 0,00 | -0,5592 | ||
| 0,01 | 1,27 | 1,4999 | -0,4431 | |
| 0,02 | 1,65 | 1,9441 | -0,4064 | |
| 0,01 | 0,88 | 1,0375 | -0,3606 |
13F og Fondsarkivering
Denne formular blev indsendt den 2025-08-26 for rapporteringsperioden 2025-06-30. Klik på linkikonet for at se den fulde transaktionshistorik.
Opgrader for at låse op for premium-data og eksportere til Excel ![]() .
.
| Sikkerhed | Type | Gennemsnitlig aktiekurs | Aktier (MM) |
Δ Aktier (%) |
Δ Aktier (%) |
Værdi ($MM) |
Portefølje (%) |
ΔPortefølje (%) |
|
|---|---|---|---|---|---|---|---|---|---|
| CASY / Casey's General Stores, Inc. | 0,00 | -18,07 | 2,32 | -3,65 | 2,7429 | -0,1103 | |||
| EXE / Expand Energy Corporation | 0,02 | -14,51 | 2,08 | -10,19 | 2,4575 | -0,2841 | |||
| FCX / Freeport-McMoRan Inc. | 0,05 | -3,97 | 2,06 | 9,98 | 2,4323 | 0,2160 | |||
| LNT / Alliant Energy Corporation | 0,03 | -14,05 | 2,02 | -19,22 | 2,3862 | -0,5738 | |||
| TFDXX / Blackrock Liquidity Funds - BlackRock Liquidity Funds FedFund Portfolio Institutional Class | 1,91 | 91,74 | 1,91 | 91,66 | 2,2526 | 1,0755 | |||
| HIG / The Hartford Insurance Group, Inc. | 0,01 | 0,00 | 1,89 | 2,55 | 2,2293 | 0,0509 | |||
| BWXT / BWX Technologies, Inc. | 0,01 | 23,14 | 1,86 | 79,90 | 2,1988 | 0,9736 | |||
| ADC / Agree Realty Corporation | 0,02 | 0,00 | 1,83 | -5,39 | 2,1558 | -0,1263 | |||
| AXS / AXIS Capital Holdings Limited | 0,02 | 0,00 | 1,72 | 3,62 | 2,0285 | 0,0661 | |||
| TRU / TransUnion | 0,02 | 12,36 | 1,72 | 19,15 | 2,0282 | 0,3226 | |||
| ALLY / Ally Financial Inc. | 0,04 | -7,16 | 1,70 | -0,87 | 2,0090 | -0,0211 | |||
| PNC / The PNC Financial Services Group, Inc. | 0,01 | 56,35 | 1,68 | 65,91 | 1,9890 | 0,7872 | |||
| EG / Everest Group, Ltd. | 0,00 | 32,69 | 1,67 | 24,07 | 1,9725 | 0,3801 | |||
| ETR / Entergy Corporation | 0,02 | -14,77 | 1,65 | -17,16 | 1,9441 | -0,4064 | |||
| VNT / Vontier Corporation | 0,04 | 5,48 | 1,64 | 18,51 | 1,9357 | 0,2988 | |||
| KEX / Kirby Corporation | 0,01 | 17,27 | 1,63 | 31,61 | 1,9278 | 0,4608 | |||
| LHX / L3Harris Technologies, Inc. | 0,01 | 0,00 | 1,62 | 19,90 | 1,9069 | 0,3126 | |||
| WTFC / Wintrust Financial Corporation | 0,01 | 0,00 | 1,59 | 10,26 | 1,8776 | 0,1711 | |||
| LAMR / Lamar Advertising Company | 0,01 | 6,62 | 1,55 | 13,66 | 1,8287 | 0,2175 | |||
| CSL / Carlisle Companies Incorporated | 0,00 | 5,90 | 1,55 | 16,13 | 1,8286 | 0,2509 | |||
| BALL / Ball Corporation | 0,03 | 0,00 | 1,52 | 7,75 | 1,7900 | 0,1251 | |||
| LKQ / LKQ Corporation | 0,04 | 0,00 | 1,48 | -12,98 | 1,7490 | -0,2652 | |||
| SIGI / Selective Insurance Group, Inc. | 0,02 | 1,45 | 1,7112 | 1,7112 | |||||
| LAZ / Lazard, Inc. | 0,03 | -10,70 | 1,43 | -1,04 | 1,6829 | -0,0211 | |||
| BBWI / Bath & Body Works, Inc. | 0,05 | 6,59 | 1,41 | 5,29 | 1,6677 | 0,0812 | |||
| COP / ConocoPhillips | 0,02 | -2,66 | 1,36 | -16,82 | 1,6004 | -0,3273 | |||
| LECO / Lincoln Electric Holdings, Inc. | 0,01 | 0,00 | 1,34 | 9,62 | 1,5876 | 0,1362 | |||
| CTVA / Corteva, Inc. | 0,02 | -13,37 | 1,34 | 2,60 | 1,5871 | 0,0372 | |||
| MMM / 3M Company | 0,01 | -12,08 | 1,34 | -8,83 | 1,5858 | -0,1575 | |||
| AME / AMETEK, Inc. | 0,01 | 0,00 | 1,29 | 5,14 | 1,5210 | 0,0713 | |||
| WCN / Waste Connections, Inc. | 0,01 | -19,14 | 1,27 | -22,66 | 1,4999 | -0,4431 | |||
| LH / Labcorp Holdings Inc. | 0,00 | 0,00 | 1,23 | 12,81 | 1,4560 | 0,1626 | |||
| FOX / Fox Corporation | 0,02 | 0,00 | 1,22 | -2,01 | 1,4369 | -0,0329 | |||
| AZO / AutoZone, Inc. | 0,00 | -6,40 | 1,20 | -8,85 | 1,4113 | -0,1403 | |||
| LW / Lamb Weston Holdings, Inc. | 0,02 | 0,00 | 1,17 | -2,75 | 1,3777 | -0,0413 | |||
| CBRE / CBRE Group, Inc. | 0,01 | 0,00 | 1,15 | 7,17 | 1,3593 | 0,0881 | |||
| LFUS / Littelfuse, Inc. | 0,01 | 0,00 | 1,14 | 15,24 | 1,3489 | 0,1761 | |||
| CP / Canadian Pacific Kansas City Limited | 0,01 | 0,00 | 1,12 | 12,97 | 1,3167 | 0,1482 | |||
| STAG / STAG Industrial, Inc. | 0,03 | 0,00 | 1,03 | 0,39 | 1,2108 | 0,0030 | |||
| MKTX / MarketAxess Holdings Inc. | 0,00 | 22,09 | 1,02 | 26,14 | 1,2079 | 0,2477 | |||
| MLM / Martin Marietta Materials, Inc. | 0,00 | 0,00 | 1,02 | 14,83 | 1,2068 | 0,1537 | |||
| FIS / Fidelity National Information Services, Inc. | 0,01 | 9,95 | 1,02 | 19,88 | 1,2042 | 0,1976 | |||
| TOL / Toll Brothers, Inc. | 0,01 | 72,49 | 1,01 | 86,74 | 1,1972 | 0,5538 | |||
| GPK / Graphic Packaging Holding Company | 0,05 | 26,65 | 0,99 | 2,81 | 1,1656 | 0,0294 | |||
| GMED / Globus Medical, Inc. | 0,02 | 2,66 | 0,99 | -17,28 | 1,1650 | -0,2452 | |||
| BLD / TopBuild Corp. | 0,00 | 0,93 | 1,0993 | 1,0993 | |||||
| TER / Teradyne, Inc. | 0,01 | 16,85 | 0,91 | 27,25 | 1,0707 | 0,2273 | |||
| ICLR / ICON Public Limited Company | 0,01 | 9,40 | 0,90 | -9,01 | 1,0616 | -0,1082 | |||
| CFR / Cullen/Frost Bankers, Inc. | 0,01 | 0,00 | 0,89 | 2,77 | 1,0508 | 0,0253 | |||
| ORLY / O'Reilly Automotive, Inc. | 0,01 | 1.081,82 | 0,88 | -25,66 | 1,0375 | -0,3606 | |||
| ELS / Equity LifeStyle Properties, Inc. | 0,01 | -7,54 | 0,86 | -14,53 | 1,0148 | -0,1746 | |||
| MSM / MSC Industrial Direct Co., Inc. | 0,01 | -0,63 | 0,86 | 8,78 | 1,0101 | 0,0796 | |||
| FN / Fabrinet | 0,00 | 17,99 | 0,82 | 76,18 | 0,9696 | 0,4178 | |||
| EA / Electronic Arts Inc. | 0,01 | 0,00 | 0,81 | 10,60 | 0,9614 | 0,0897 | |||
| VLO / Valero Energy Corporation | 0,01 | 0,81 | 0,9541 | 0,9541 | |||||
| NICE / NICE Ltd. - Depositary Receipt (Common Stock) | 0,00 | 46,99 | 0,78 | 61,08 | 0,9189 | 0,3472 | |||
| CAH / Cardinal Health, Inc. | 0,00 | -11,50 | 0,77 | 7,95 | 0,9146 | 0,0655 | |||
| WLK / Westlake Corporation | 0,01 | -33,33 | 0,63 | -49,44 | 0,7438 | -0,7287 | |||
| SAIA / Saia, Inc. | 0,00 | 0,63 | 0,7427 | 0,7427 | |||||
| BURL / Burlington Stores, Inc. | 0,00 | 14,64 | 0,63 | 11,99 | 0,7397 | 0,0774 | |||
| CDW / CDW Corporation | 0,00 | 17,63 | 0,61 | 31,10 | 0,7175 | 0,1691 | |||
| ARW / Arrow Electronics, Inc. | 0,00 | -19,96 | 0,60 | -1,79 | 0,7137 | -0,0143 | |||
| LSTR / Landstar System, Inc. | 0,00 | -54,55 | 0,58 | -57,94 | 0,6887 | -0,9518 | |||
| KEYS / Keysight Technologies, Inc. | 0,00 | 0,00 | 0,58 | 9,51 | 0,6802 | 0,0573 | |||
| JEF / Jefferies Financial Group Inc. | 0,01 | -17,31 | 0,52 | -15,50 | 0,6117 | -0,1143 | |||
| HOLX / Hologic, Inc. | 0,01 | 0,51 | 0,6041 | 0,6041 | |||||
| BKR / Baker Hughes Company | 0,01 | 0,00 | 0,50 | -12,85 | 0,5853 | -0,0870 | |||
| BOOT / Boot Barn Holdings, Inc. | 0,00 | 0,48 | 0,5656 | 0,5656 | |||||
| KDP / Keurig Dr Pepper Inc. | 0,01 | 0,42 | 0,4967 | 0,4967 | |||||
| PPL / PPL Corporation | 0,01 | 0,38 | 0,4541 | 0,4541 | |||||
| HSY / The Hershey Company | 0,00 | -67,74 | 0,38 | -68,69 | 0,4498 | -0,9902 | |||
| ZBH / Zimmer Biomet Holdings, Inc. | 0,00 | -52,11 | 0,35 | -61,44 | 0,4104 | -0,6551 | |||
| HUM / Humana Inc. | 0,00 | 0,00 | 0,31 | -7,49 | 0,3651 | -0,0308 | |||
| TGT / Target Corporation | 0,00 | -69,69 | 0,25 | -71,35 | 0,2916 | -0,7282 | |||
| TENB / Tenable Holdings, Inc. | 0,00 | -100,00 | 0,00 | -100,00 | -0,5592 |