Grundlæggende statistik
| Porteføljeværdi | $ 1.237.532 |
| Nuværende stillinger | 122 |
Seneste beholdninger, ydeevne, AUM (fra 13F, 13D)
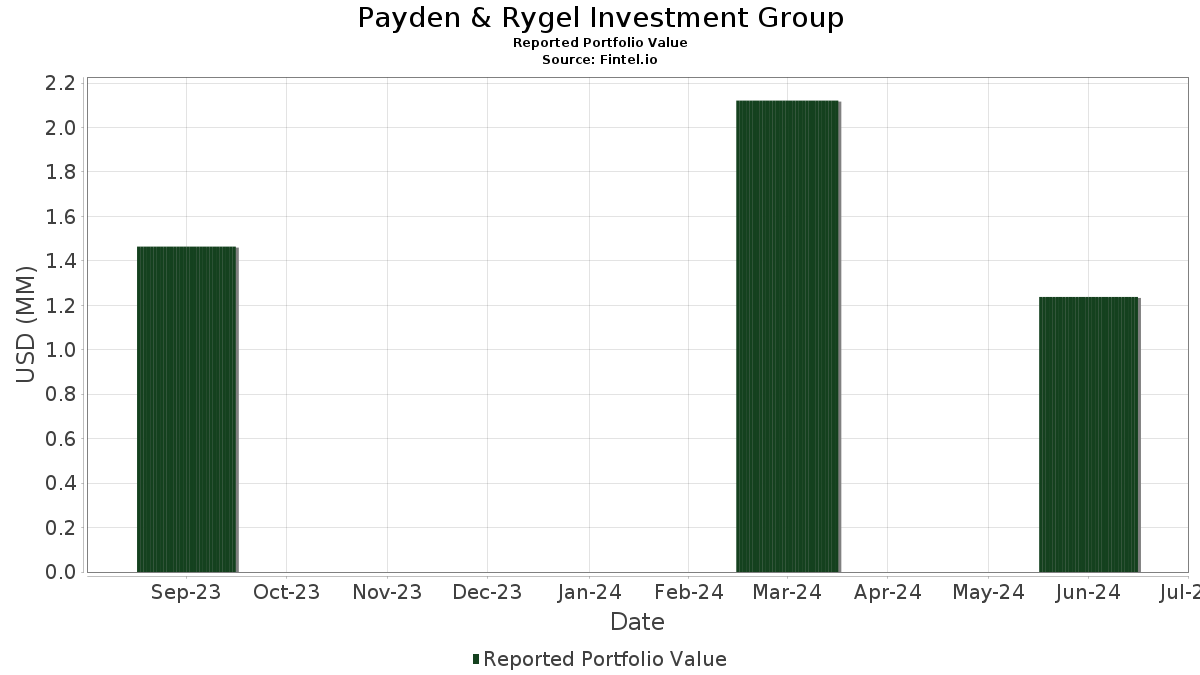
Payden & Rygel Investment Group har afsløret 122 samlede besiddelser i deres seneste SEC-arkivering. Den seneste porteføljeværdi er beregnet til at være $ 1.237.532 USD. Faktiske aktiver under forvaltning (AUM) er denne værdi plus kontanter (som ikke er oplyst). Payden & Rygel Investment Groups største beholdninger er Arthur J. Gallagher & Co. (US:AJG) , JPMorgan Chase & Co. (US:JPM) , Invesco Exchange-Traded Fund Trust II - Invesco NASDAQ 100 ETF (US:QQQM) , Microsoft Corporation (US:MSFT) , and Exxon Mobil Corporation (US:XOM) . Payden & Rygel Investment Groups nye stillinger omfatter Stryker Corporation (US:SYK) , ITT Inc. (US:ITT) , AvalonBay Communities, Inc. (US:AVB) , Ares Management Corporation (US:ARES) , and Vistra Corp. (US:VST) .
Top øger dette kvartal
Vi bruger ændringen i porteføljeallokeringen, fordi dette er den mest meningsfulde metrik. Ændringer kan skyldes handler eller ændringer i aktiekurser.
| Sikkerhed | Aktier (MM) |
Værdi (MM$) |
Portefølje % | ΔPortefølje % |
|---|---|---|---|---|
| 0,18 | 0,03 | 2,7937 | 2,5370 | |
| 0,14 | 0,04 | 3,0383 | 1,4621 | |
| 0,05 | 0,02 | 1,4160 | 1,4160 | |
| 0,36 | 0,03 | 2,0805 | 1,3884 | |
| 0,05 | 0,03 | 2,3220 | 1,2386 | |
| 0,12 | 0,01 | 1,2056 | 1,2056 | |
| 0,24 | 0,02 | 1,9429 | 1,1733 | |
| 0,08 | 0,03 | 2,7640 | 1,0674 | |
| 0,07 | 0,01 | 1,0665 | 1,0665 | |
| 0,06 | 0,01 | 1,0081 | 1,0081 |
Top falder i dette kvartal
Vi bruger ændringen i porteføljeallokeringen, fordi dette er den mest meningsfulde metrik. Ændringer kan skyldes handler eller ændringer i aktiekurser.
| Sikkerhed | Aktier (MM) |
Værdi (MM$) |
Portefølje % | ΔPortefølje % |
|---|---|---|---|---|
| 0,00 | 0,00 | -26,1646 | ||
| 0,00 | 0,00 | -1,1565 | ||
| 0,01 | 0,00 | 0,0995 | -0,7855 | |
| 0,00 | 0,00 | 0,0852 | -0,7455 | |
| 0,02 | 0,00 | 0,0616 | -0,6013 | |
| 0,00 | 0,00 | -0,5946 | ||
| 0,00 | 0,00 | 0,1884 | -0,5201 | |
| 0,01 | 0,00 | 0,0603 | -0,5184 | |
| 0,02 | 0,00 | 0,3079 | -0,4001 | |
| 0,03 | 0,00 | 0,0678 | -0,2860 |
13F og Fondsarkivering
Denne formular blev indsendt den 2024-10-09 for rapporteringsperioden 2024-06-30. Klik på linkikonet for at se den fulde transaktionshistorik.
Opgrader for at låse op for premium-data og eksportere til Excel ![]() .
.
| Sikkerhed | Type | Gennemsnitlig aktiekurs | Aktier (MM) |
Δ Aktier (%) |
Δ Aktier (%) |
Værdi ($MM) |
Portefølje (%) |
ΔPortefølje (%) |
|
|---|---|---|---|---|---|---|---|---|---|
| AJG / Arthur J. Gallagher & Co. | 0,14 | 8,45 | 0,04 | 12,12 | 3,0383 | 1,4621 | |||
| JPM / JPMorgan Chase & Co. | 0,18 | -19,10 | 0,04 | -17,78 | 2,9983 | 0,8569 | |||
| QQQM / Invesco Exchange-Traded Fund Trust II - Invesco NASDAQ 100 ETF | 0,18 | 488,59 | 0,03 | 580,00 | 2,7937 | 2,5370 | |||
| MSFT / Microsoft Corporation | 0,08 | -10,52 | 0,03 | -2,86 | 2,7640 | 1,0674 | |||
| XOM / Exxon Mobil Corporation | 0,28 | -14,78 | 0,03 | -16,22 | 2,5801 | 0,7964 | |||
| MCK / McKesson Corporation | 0,05 | 14,95 | 0,03 | 27,27 | 2,3220 | 1,2386 | |||
| WMT / Walmart Inc. | 0,39 | -39,31 | 0,03 | -31,58 | 2,1119 | 0,3077 | |||
| NEE.PRN / NextEra Energy Capital Holdings, Inc. - Corporate Bond/Note | 0,36 | 58,29 | 0,03 | 78,57 | 2,0805 | 1,3884 | |||
| AVGO / Broadcom Inc. | 0,02 | -9,14 | 0,03 | 8,70 | 2,0641 | 0,9699 | |||
| DUK / Duke Energy Corporation | 0,24 | 42,12 | 0,02 | 50,00 | 1,9429 | 1,1733 | |||
| CRH / CRH plc | 0,32 | 29,96 | 0,02 | 9,52 | 1,9316 | 0,9339 | |||
| LLY / Eli Lilly and Company | 0,02 | -8,67 | 0,02 | 5,00 | 1,7719 | 0,7992 | |||
| ET / Energy Transfer LP - Limited Partnership | 1,33 | 3,95 | 0,02 | 5,00 | 1,7465 | 0,7958 | |||
| AMP / Ameriprise Financial, Inc. | 0,05 | -9,55 | 0,02 | -12,50 | 1,7329 | 0,5856 | |||
| AAPL / Apple Inc. | 0,10 | 8,66 | 0,02 | 33,33 | 1,6662 | 0,9378 | |||
| ROST / Ross Stores, Inc. | 0,14 | 45,28 | 0,02 | 42,86 | 1,6428 | 0,9764 | |||
| EMR / Emerson Electric Co. | 0,18 | -29,53 | 0,02 | -31,03 | 1,6424 | 0,2424 | |||
| LIN / Linde plc | 0,05 | -10,16 | 0,02 | -13,04 | 1,6311 | 0,5102 | |||
| MCD / McDonald's Corporation | 0,08 | -2,97 | 0,02 | -13,64 | 1,6124 | 0,5396 | |||
| LHX / L3Harris Technologies, Inc. | 0,09 | -16,21 | 0,02 | -13,64 | 1,6042 | 0,5443 | |||
| CB / Chubb Limited | 0,08 | 20,04 | 0,02 | 18,75 | 1,5927 | 0,8063 | |||
| DLR / Digital Realty Trust, Inc. | 0,13 | -7,77 | 0,02 | -5,00 | 1,5899 | 0,6370 | |||
| WFC / Wells Fargo & Company | 0,33 | -27,14 | 0,02 | -26,92 | 1,5875 | 0,3469 | |||
| VZ / Verizon Communications Inc. | 0,47 | -25,58 | 0,02 | -26,92 | 1,5739 | 0,3184 | |||
| EPD / Enterprise Products Partners L.P. - Limited Partnership | 0,67 | -8,60 | 0,02 | -9,52 | 1,5675 | 0,5599 | |||
| MET / MetLife, Inc. | 0,27 | -7,48 | 0,02 | -9,52 | 1,5512 | 0,5184 | |||
| FIS * / Fidelity National Information Services, Inc. | 0,25 | 27,52 | 0,02 | 28,57 | 1,5352 | 0,8437 | |||
| COST / Costco Wholesale Corporation | 0,02 | -18,98 | 0,02 | -10,00 | 1,5248 | 0,5784 | |||
| MS / Morgan Stanley | 0,19 | -9,31 | 0,02 | -10,00 | 1,5141 | 0,5703 | |||
| GJR / Strats Trust For Procter & Gambel Security - Preferred Security | 0,11 | -8,99 | 0,02 | -5,26 | 1,4696 | 0,5426 | |||
| SYK / Stryker Corporation | 0,05 | 0,02 | 1,4160 | 1,4160 | |||||
| ACM / AECOM | 0,20 | 24,33 | 0,02 | 13,33 | 1,4122 | 0,6747 | |||
| AMZN / Amazon.com, Inc. | 0,09 | -8,83 | 0,02 | 0,00 | 1,4034 | 0,5651 | |||
| PSX / Phillips 66 | 0,11 | 51,81 | 0,02 | 25,00 | 1,2901 | 0,7164 | |||
| ETN / Eaton Corporation plc | 0,05 | -10,16 | 0,02 | -11,76 | 1,2552 | 0,4423 | |||
| AXP / American Express Company | 0,07 | 3,08 | 0,02 | 7,14 | 1,2536 | 0,5558 | |||
| META / Meta Platforms, Inc. | 0,03 | 4,86 | 0,02 | 15,38 | 1,2308 | 0,5712 | |||
| GOOGL / Alphabet Inc. | 0,08 | -26,64 | 0,02 | -6,25 | 1,2158 | 0,4145 | |||
| ITT / ITT Inc. | 0,12 | 0,01 | 1,2056 | 1,2056 | |||||
| PLD / Prologis, Inc. | 0,13 | -31,15 | 0,01 | -44,00 | 1,2034 | 0,0209 | |||
| MRK / Merck & Co., Inc. | 0,12 | -8,80 | 0,01 | -17,65 | 1,2020 | 0,3824 | |||
| AMAT / Applied Materials, Inc. | 0,06 | -10,54 | 0,01 | 0,00 | 1,1978 | 0,5151 | |||
| KO / The Coca-Cola Company | 0,23 | -27,33 | 0,01 | -26,32 | 1,1910 | 0,2718 | |||
| TMUS / T-Mobile US, Inc. | 0,08 | -9,51 | 0,01 | 0,00 | 1,1517 | 0,4637 | |||
| V / Visa Inc. | 0,05 | -47,37 | 0,01 | -50,00 | 1,1453 | -0,2048 | |||
| HD / The Home Depot, Inc. | 0,04 | 40,59 | 0,01 | 27,27 | 1,1369 | 0,6111 | |||
| AMT / American Tower Corporation | 0,07 | 0,01 | 1,0665 | 1,0665 | |||||
| SPG / Simon Property Group, Inc. | 0,09 | 27,41 | 0,01 | 30,00 | 1,0604 | 0,5598 | |||
| NXST / Nexstar Media Group, Inc. | 0,08 | -10,69 | 0,01 | -13,33 | 1,0531 | 0,3391 | |||
| QCOM / QUALCOMM Incorporated | 0,06 | -9,86 | 0,01 | 0,00 | 1,0446 | 0,4698 | |||
| DELL / Dell Technologies Inc. | 0,09 | -8,71 | 0,01 | 9,09 | 1,0274 | 0,4841 | |||
| SPGI / S&P Global Inc. | 0,03 | -46,16 | 0,01 | -45,45 | 1,0127 | -0,0341 | |||
| AVB / AvalonBay Communities, Inc. | 0,06 | 0,01 | 1,0081 | 1,0081 | |||||
| COP / ConocoPhillips | 0,11 | -37,46 | 0,01 | -42,86 | 0,9954 | -0,0379 | |||
| EOG / EOG Resources, Inc. | 0,10 | -25,31 | 0,01 | -25,00 | 0,9845 | 0,2034 | |||
| DHI / D.R. Horton, Inc. | 0,08 | -24,93 | 0,01 | -38,89 | 0,9568 | 0,0885 | |||
| HON / Honeywell International Inc. | 0,05 | -39,62 | 0,01 | -38,89 | 0,9421 | 0,0671 | |||
| ARES / Ares Management Corporation | 0,09 | 0,01 | 0,9262 | 0,9262 | |||||
| AMGN / Amgen Inc. | 0,04 | -39,21 | 0,01 | -37,50 | 0,8887 | 0,1126 | |||
| UNP / Union Pacific Corporation | 0,04 | -29,62 | 0,01 | -33,33 | 0,8209 | 0,0812 | |||
| GE / General Electric Company | 0,06 | -1,84 | 0,01 | -9,09 | 0,8208 | 0,2821 | |||
| IBM / International Business Machines Corporation | 0,05 | -2,04 | 0,01 | -10,00 | 0,7435 | 0,2545 | |||
| ORCL / Oracle Corporation | 0,06 | -55,73 | 0,01 | -50,00 | 0,7416 | -0,1278 | |||
| EQT / EQT Corporation | 0,23 | 0,00 | 0,01 | 0,00 | 0,6814 | 0,2828 | |||
| DAL / Delta Air Lines, Inc. | 0,17 | -45,79 | 0,01 | -50,00 | 0,6421 | -0,0553 | |||
| DIS / The Walt Disney Company | 0,08 | 452,29 | 0,01 | 600,00 | 0,6084 | 0,5292 | |||
| JNJ / Johnson & Johnson | 0,04 | -51,82 | 0,01 | -57,14 | 0,5173 | -0,1606 | |||
| CME / CME Group Inc. | 0,03 | 1.142,31 | 0,01 | 0,5131 | 0,4867 | ||||
| VST / Vistra Corp. | 0,07 | 0,01 | 0,4870 | 0,4870 | |||||
| IJH / iShares Trust - iShares Core S&P Mid-Cap ETF | 0,07 | -58,08 | 0,00 | -66,67 | 0,3150 | -0,1400 | |||
| PEP / PepsiCo, Inc. | 0,02 | -73,08 | 0,00 | -80,00 | 0,3079 | -0,4001 | |||
| UNH / UnitedHealth Group Incorporated | 0,00 | -84,92 | 0,00 | -86,67 | 0,1884 | -0,5201 | |||
| NVDD / Direxion Shares ETF Trust - Direxion Daily NVDA Bear 1X Shares | 0,02 | 900,00 | 0,00 | 100,00 | 0,1797 | 0,1030 | |||
| SUSB / iShares Trust - iShares ESG Aware 1-5 Year USD Corporate Bond ETF | 0,09 | 6,92 | 0,00 | 0,00 | 0,1753 | 0,0797 | |||
| LMT / Lockheed Martin Corporation | 0,00 | 0,00 | 0,00 | 0,00 | 0,1555 | 0,0671 | |||
| BAC / Bank of America Corporation | 0,04 | 0,00 | 0,00 | 0,00 | 0,1433 | 0,0636 | |||
| FDX / FedEx Corporation | 0,01 | -1,69 | 0,00 | 0,00 | 0,1405 | 0,0599 | |||
| CSCO / Cisco Systems, Inc. | 0,04 | -25,65 | 0,00 | -50,00 | 0,1358 | 0,0238 | |||
| WMB / The Williams Companies, Inc. | 0,04 | -34,64 | 0,00 | -50,00 | 0,1225 | 0,0223 | |||
| NFLX / Netflix, Inc. | 0,00 | -13,57 | 0,00 | 0,00 | 0,1042 | 0,0409 | |||
| IVW / iShares Trust - iShares S&P 500 Growth ETF | 0,01 | -94,01 | 0,00 | -94,44 | 0,0995 | -0,7855 | |||
| MMP / Magellan Midstream Partners L.P. | 0,02 | 0,00 | 0,00 | 0,00 | 0,0869 | 0,0362 | |||
| CRM / Salesforce, Inc. | 0,00 | -92,99 | 0,00 | -94,12 | 0,0852 | -0,7455 | |||
| TMO / Thermo Fisher Scientific Inc. | 0,00 | -37,93 | 0,00 | -100,00 | 0,0804 | 0,0009 | |||
| WM / Waste Management, Inc. | 0,00 | 0,00 | 0,00 | 0,0793 | 0,0331 | ||||
| DE / Deere & Company | 0,00 | 0,00 | 0,00 | 0,0694 | 0,0249 | ||||
| ABBV / AbbVie Inc. | 0,01 | 0,00 | 0,00 | 0,0694 | 0,0264 | ||||
| PFE / Pfizer Inc. | 0,03 | -88,91 | 0,00 | -100,00 | 0,0678 | -0,2860 | |||
| SUSC / iShares Trust - iShares ESG Aware USD Corporate Bond ETF | 0,04 | 15,83 | 0,00 | 0,0653 | 0,0320 | ||||
| CMCSA / Comcast Corporation | 0,02 | -94,00 | 0,00 | -100,00 | 0,0616 | -0,6013 | |||
| NKE / NIKE, Inc. | 0,01 | -92,42 | 0,00 | -100,00 | 0,0603 | -0,5184 | |||
| C.WSA / Citigroup, Inc. | 0,00 | 0,00 | 0,00 | 0,0573 | 0,0219 | ||||
| BA / The Boeing Company | 0,00 | 0,00 | 0,00 | 0,0470 | 0,0179 | ||||
| GS / The Goldman Sachs Group, Inc. | 0,00 | 0,00 | 0,00 | 0,0461 | 0,0213 | ||||
| DOV / Dover Corporation | 0,00 | 0,00 | 0,00 | 0,0391 | 0,0167 | ||||
| TXN / Texas Instruments Incorporated | 0,00 | 0,00 | 0,00 | 0,0361 | 0,0172 | ||||
| MCHP / Microchip Technology Incorporated | 0,00 | 0,00 | 0,00 | 0,0355 | 0,0152 | ||||
| RSG / Republic Services, Inc. | 0,00 | 0,00 | 0,00 | 0,0283 | 0,0120 | ||||
| MDLZ / Mondelez International, Inc. | 0,00 | -57,17 | 0,00 | 0,0242 | -0,0111 | ||||
| CVX / Chevron Corporation | 0,00 | 0,00 | 0,00 | 0,0204 | 0,0084 | ||||
| DHR / Danaher Corporation | 0,00 | 0,00 | 0,00 | 0,0202 | 0,0084 | ||||
| MA / Mastercard Incorporated | 0,00 | 0,00 | 0,00 | 0,0200 | 0,0072 | ||||
| PSA / Public Storage | 0,00 | 0,00 | 0,00 | 0,0177 | 0,0073 | ||||
| AEP / American Electric Power Company, Inc. | 0,00 | 0,00 | 0,00 | 0,0177 | 0,0076 | ||||
| GNMA / iShares Trust - iShares GNMA Bond ETF | 0,00 | 0,00 | 0,00 | 0,0158 | 0,0065 | ||||
| UPS / United Parcel Service, Inc. | 0,00 | 0,00 | 0,00 | 0,0155 | 0,0057 | ||||
| VICI / VICI Properties Inc. | 0,01 | 0,00 | 0,00 | 0,0152 | 0,0060 | ||||
| EXC / Exelon Corporation | 0,01 | 0,00 | 0,00 | 0,0143 | 0,0053 | ||||
| DVN / Devon Energy Corporation | 0,00 | 0,00 | 0,00 | 0,0134 | 0,0051 | ||||
| NHP / Nationwide Health Properties Inc | 0,00 | 0,00 | 0,00 | 0,0133 | 0,0056 | ||||
| PBR / Petróleo Brasileiro S.A. - Petrobras - Depositary Receipt (Common Stock) | 0,01 | 0,00 | 0,00 | 0,0120 | 0,0047 | ||||
| OVV / Ovintiv Inc. | 0,00 | 0,00 | 0,00 | 0,0114 | 0,0040 | ||||
| AR / Antero Resources Corporation | 0,00 | 0,00 | 0,00 | 0,0103 | 0,0050 | ||||
| CRK / Comstock Resources, Inc. | 0,01 | 0,00 | 0,00 | 0,0089 | 0,0042 | ||||
| IGSB / iShares Trust - iShares 1-5 Year Investment Grade Corporate Bond ETF | 0,00 | 0,00 | 0,00 | 0,0073 | 0,0030 | ||||
| LYB / LyondellBasell Industries N.V. | 0,00 | -82,69 | 0,00 | 0,0069 | -0,0181 | ||||
| SWN / Southwestern Energy Company | 0,01 | 0,00 | 0,00 | 0,0053 | 0,0018 | ||||
| TLH / iShares Trust - iShares 10-20 Year Treasury Bond ETF | 0,00 | 0,00 | 0,00 | 0,0048 | 0,0019 | ||||
| TELL / Tellurian Inc. | 0,04 | 0,00 | 0,00 | 0,0023 | 0,0010 | ||||
| ARCC / Ares Capital Corporation | 0,00 | 0,00 | 0,00 | 0,0019 | 0,0008 | ||||
| GILD / Gilead Sciences, Inc. | 0,00 | -93,28 | 0,00 | 0,0010 | -0,0083 | ||||
| VLY / Valley National Bancorp | 0,00 | 0,00 | 0,00 | 0,0003 | 0,0001 | ||||
| VXUS / Vanguard STAR Funds - Vanguard Total International Stock ETF | 0,00 | -100,00 | 0,00 | 0,0000 | |||||
| ALB / Albemarle Corporation | 0,00 | -100,00 | 0,00 | 0,0000 | -0,0087 | ||||
| ZTS / Zoetis Inc. | 0,00 | -100,00 | 0,00 | 0,0000 | |||||
| PPG / PPG Industries, Inc. | 0,00 | -100,00 | 0,00 | 0,0000 | |||||
| BMY / Bristol-Myers Squibb Company | 0,00 | -100,00 | 0,00 | 0,0000 | |||||
| USB / U.S. Bancorp | 0,00 | -100,00 | 0,00 | 0,0000 | |||||
| IGLB / iShares Trust - iShares 10+ Year Investment Grade Corporate Bond ETF | 0,00 | -100,00 | 0,00 | 0,0000 | |||||
| SPY / SPDR S&P 500 ETF | 0,00 | -100,00 | 0,00 | -100,00 | -1,1565 | ||||
| CVS / CVS Health Corporation | 0,00 | -100,00 | 0,00 | 0,0000 | |||||
| SBUX / Starbucks Corporation | 0,00 | -100,00 | 0,00 | -100,00 | -0,5946 | ||||
| EQIX / Equinix, Inc. | 0,00 | -100,00 | 0,00 | 0,0000 | -0,0273 | ||||
| INTC / Intel Corporation | 0,00 | -100,00 | 0,00 | 0,0000 | -0,0158 | ||||
| IJR / iShares Trust - iShares Core S&P Small-Cap ETF | 0,00 | -100,00 | 0,00 | 0,0000 | |||||
| ABT / Abbott Laboratories | 0,00 | -100,00 | 0,00 | 0,0000 | |||||
| TLT / iShares Trust - iShares 20+ Year Treasury Bond ETF | Put | 0,00 | -100,00 | 0,00 | -100,00 | -26,1646 | |||
| NUE / Nucor Corporation | 0,00 | -100,00 | 0,00 | 0,0000 | |||||
| CMI / Cummins Inc. | 0,00 | -100,00 | 0,00 | 0,0000 | |||||
| LQD / iShares Trust - iShares iBoxx $ Investment Grade Corporate Bond ETF | Put | 0,00 | -100,00 | 0,00 | 0,0000 |