Grundlæggende statistik
| Porteføljeværdi | $ 220.694.000 |
| Nuværende stillinger | 123 |
Seneste beholdninger, ydeevne, AUM (fra 13F, 13D)
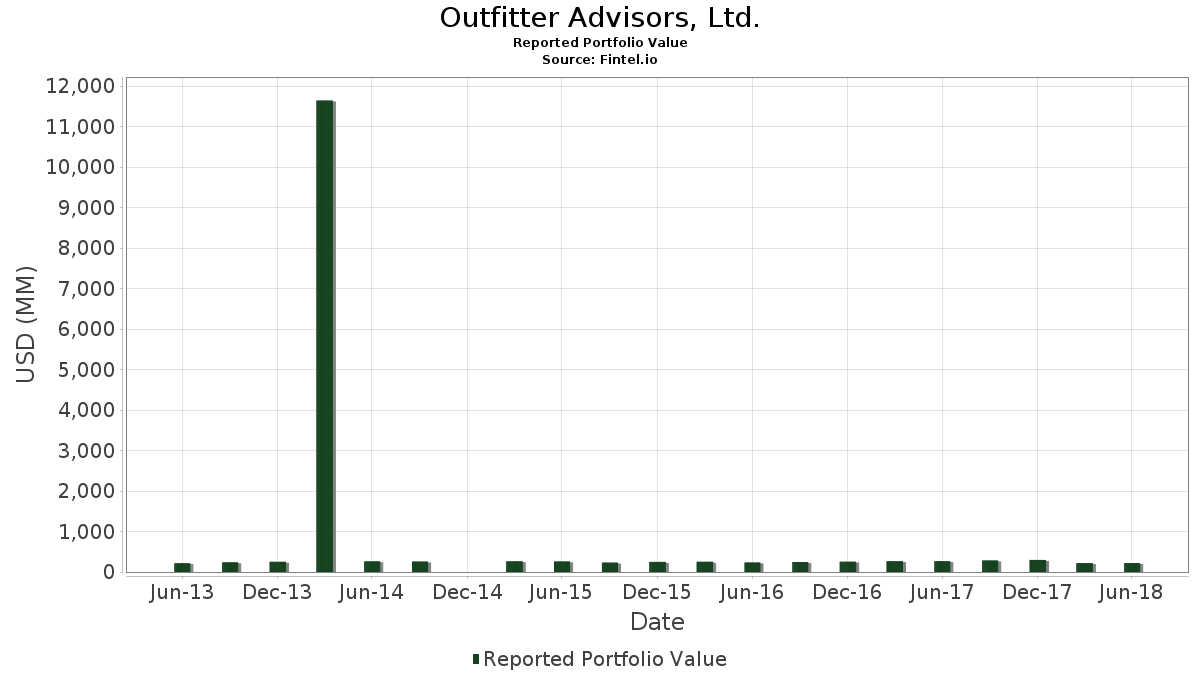
Outfitter Advisors, Ltd. har afsløret 123 samlede besiddelser i deres seneste SEC-arkivering. Den seneste porteføljeværdi er beregnet til at være $ 220.694.000 USD. Faktiske aktiver under forvaltning (AUM) er denne værdi plus kontanter (som ikke er oplyst). Outfitter Advisors, Ltd.s største beholdninger er Intuit Inc. (US:INTU) , Texas Instruments Incorporated (US:TXN) , Adobe Inc. (US:ADBE) , Vanguard Index Funds - Vanguard Total Stock Market ETF (US:VTI) , and Dominion Energy, Inc. (US:D) . Outfitter Advisors, Ltd.s nye stillinger omfatter Sage Therapeutics, Inc. (US:SAGE) , Invesco QQQ Trust, Series 1 (US:QQQ) , Primis Financial Corp. (US:FRST) , The Scotts Miracle-Gro Company (US:SMG) , and Fidelity Securities Fund - Fidelity OTC Portfolio (US:FOCPX) .
Top øger dette kvartal
Vi bruger ændringen i porteføljeallokeringen, fordi dette er den mest meningsfulde metrik. Ændringer kan skyldes handler eller ændringer i aktiekurser.
| Sikkerhed | Aktier (MM) |
Værdi (MM$) |
Portefølje % | ΔPortefølje % |
|---|---|---|---|---|
| 0,08 | 3,87 | 1,7549 | 1,7549 | |
| 0,06 | 2,92 | 1,3226 | 1,3226 | |
| 0,04 | 2,83 | 1,2810 | 1,2810 | |
| 0,05 | 2,31 | 1,0485 | 1,0485 | |
| 0,03 | 1,82 | 0,8251 | 0,8251 | |
| 0,03 | 1,69 | 0,7640 | 0,7640 | |
| 0,02 | 1,32 | 0,5963 | 0,5963 | |
| 0,04 | 1,27 | 0,5768 | 0,5768 | |
| 0,01 | 1,27 | 0,5741 | 0,5741 | |
| 0,01 | 1,25 | 0,5673 | 0,5673 |
Top falder i dette kvartal
Vi bruger ændringen i porteføljeallokeringen, fordi dette er den mest meningsfulde metrik. Ændringer kan skyldes handler eller ændringer i aktiekurser.
| Sikkerhed | Aktier (MM) |
Værdi (MM$) |
Portefølje % | ΔPortefølje % |
|---|---|---|---|---|
| 0,00 | 0,00 | -1,8621 | ||
| 0,03 | 0,89 | 0,4033 | -0,3329 | |
| 0,06 | 5,91 | 2,6788 | -0,2681 | |
| 0,03 | 6,33 | 2,8669 | -0,2505 | |
| 0,03 | 6,30 | 2,8528 | -0,2225 | |
| 0,02 | 2,98 | 1,3526 | -0,2016 | |
| 0,04 | 3,76 | 1,7055 | -0,1191 | |
| 0,01 | 2,10 | 0,9534 | -0,1095 | |
| 0,01 | 1,10 | 0,4975 | -0,0929 | |
| 0,03 | 2,71 | 1,2266 | -0,0867 |
13F og Fondsarkivering
Denne formular blev indsendt den 2018-07-23 for rapporteringsperioden 2018-06-30. Klik på linkikonet for at se den fulde transaktionshistorik.
Opgrader for at låse op for premium-data og eksportere til Excel ![]() .
.
| Sikkerhed | Type | Gennemsnitlig aktiekurs | Aktier (MM) |
Δ Aktier (%) |
Δ Aktier (%) |
Værdi ($MM) |
Portefølje (%) |
ΔPortefølje (%) |
|
|---|---|---|---|---|---|---|---|---|---|
| INTU / Intuit Inc. | 0,04 | -4,04 | 8,75 | 13,09 | 3,9648 | 0,4293 | |||
| TXN / Texas Instruments Incorporated | 0,07 | -1,68 | 7,64 | 4,34 | 3,4618 | 0,1160 | |||
| ADBE / Adobe Inc. | 0,03 | -12,02 | 7,55 | -0,74 | 3,4197 | -0,0546 | |||
| VTI / Vanguard Index Funds - Vanguard Total Stock Market ETF | 0,05 | 4,76 | 7,33 | 8,40 | 3,3209 | 0,2314 | |||
| D / Dominion Energy, Inc. | 0,10 | 5,91 | 6,59 | 7,09 | 2,9847 | 0,1739 | |||
| BRK.B / Berkshire Hathaway Inc. | 0,03 | -0,89 | 6,33 | -7,26 | 2,8669 | -0,2505 | |||
| FDX / FedEx Corporation | 0,03 | -1,07 | 6,30 | -6,45 | 2,8528 | -0,2225 | |||
| BIIB / Biogen Inc. | 0,02 | 0,43 | 6,10 | 6,45 | 2,7654 | 0,1456 | |||
| CBOE / Cboe Global Markets, Inc. | 0,06 | 0,51 | 5,91 | -8,33 | 2,6788 | -0,2681 | |||
| VANGUARD BAL IDX / MF (921931101) | 0,14 | 4,99 | 0,0000 | ||||||
| RTX / RTX Corporation | 0,04 | 12,57 | 4,89 | 11,85 | 2,2148 | 0,2179 | |||
| DOW / Dow Inc. | 0,07 | -1,28 | 4,86 | 2,17 | 2,2021 | 0,0284 | |||
| 904784709 / Unilever N.V. | 0,08 | -1,17 | 4,71 | -2,34 | 2,1355 | -0,0697 | |||
| CME / CME Group Inc. | 0,03 | 0,48 | 4,61 | 1,83 | 2,0902 | 0,0202 | |||
| COST / Costco Wholesale Corporation | 0,02 | -2,26 | 4,51 | 8,41 | 2,0449 | 0,1426 | |||
| CP / Canadian Pacific Kansas City Limited | 0,02 | -1,15 | 4,32 | 2,49 | 1,9584 | 0,0314 | |||
| XOM / Exxon Mobil Corporation | 0,05 | 1,38 | 3,94 | 12,41 | 1,7848 | 0,1836 | |||
| CBB / Cincinnati Bell, Inc. | 0,08 | -2,00 | 3,87 | -1,10 | 1,7549 | 1,7549 | |||
| KMB / Kimberly-Clark Corporation | 0,04 | -1,43 | 3,76 | -5,74 | 1,7055 | -0,1191 | |||
| VZ / Verizon Communications Inc. | 0,07 | 1,37 | 3,58 | 6,65 | 1,6199 | 0,0882 | |||
| HLUYY / H. Lundbeck AS - ADR | 0,05 | -7,95 | 3,56 | 14,67 | 1,6154 | 0,1947 | |||
| MRK / Merck & Co., Inc. | 0,06 | -0,54 | 3,38 | 10,85 | 1,5320 | 0,1383 | |||
| PG / The Procter & Gamble Company | 0,04 | 1,52 | 3,22 | -0,03 | 1,4577 | -0,0128 | |||
| HES / Hess Corporation | 0,05 | -1,04 | 3,19 | 30,79 | 1,4436 | 0,3305 | |||
| IBM / International Business Machines Corporation | 0,02 | -3,59 | 2,98 | -12,23 | 1,3526 | -0,2016 | |||
| CTTAY / Continental Aktiengesellschaft - Depositary Receipt (Common Stock) | 0,06 | -1,46 | 2,92 | -19,05 | 1,3226 | 1,3226 | |||
| GOOGL / Alphabet Inc. | 0,00 | -0,77 | 2,91 | 8,07 | 1,3172 | 0,0880 | |||
| VNO / Vornado Realty Trust | 0,04 | 0,00 | 2,83 | 9,87 | 1,2810 | 1,2810 | |||
| KO / The Coca-Cola Company | 0,06 | -2,19 | 2,71 | -1,20 | 1,2289 | -0,0255 | |||
| FMX / Fomento Económico Mexicano, S.A.B. de C.V. - Depositary Receipt (Common Stock) | 0,03 | -1,91 | 2,71 | -5,81 | 1,2266 | -0,0867 | |||
| META / Meta Platforms, Inc. | 0,01 | -1,61 | 2,67 | 19,65 | 1,2085 | 0,1899 | |||
| CI / The Cigna Group | 0,01 | 0,00 | 2,53 | 1,32 | 1,1455 | 0,0054 | |||
| US0549371070 / BB&T Corp. | 0,05 | -0,13 | 2,42 | -3,20 | 1,0970 | -0,0459 | |||
| HEINY / Heineken N.V. - Depositary Receipt (Common Stock) | 0,05 | 1,25 | 2,31 | -5,63 | 1,0485 | 1,0485 | |||
| BABA / Alibaba Group Holding Limited - Depositary Receipt (Common Stock) | 0,01 | 16,83 | 2,29 | 18,14 | 1,0358 | 0,1516 | |||
| AMZN / Amazon.com, Inc. | 0,00 | 0,37 | 2,28 | 17,86 | 1,0345 | 0,1493 | |||
| RBCAA / Republic Bancorp, Inc. | 0,05 | 0,00 | 2,15 | 18,27 | 0,9737 | 0,1435 | |||
| MMM / 3M Company | 0,01 | 0,94 | 2,10 | -9,54 | 0,9534 | -0,1095 | |||
| ASAZY / ASSA ABLOY AB (publ) - Depositary Receipt (Common Stock) | 0,18 | -0,65 | 1,95 | -3,23 | 0,8827 | -0,0372 | |||
| WFC / Wells Fargo & Company | 0,03 | -4,50 | 1,93 | 0,99 | 0,8741 | 0,0013 | |||
| CAKE / The Cheesecake Factory Incorporated | 0,03 | 0,00 | 1,82 | 14,17 | 0,8251 | 0,8251 | |||
| DIS / The Walt Disney Company | 0,02 | -0,89 | 1,76 | 3,41 | 0,7975 | 0,0197 | |||
| SCHD / Schwab Strategic Trust - Schwab U.S. Dividend Equity ETF | 0,03 | 6,04 | 1,69 | 6,57 | 0,7640 | 0,7640 | |||
| KVHI / KVH Industries, Inc. | 0,12 | -1,04 | 1,60 | 28,10 | 0,7250 | 0,1542 | |||
| JPM / JPMorgan Chase & Co. | 0,01 | -4,47 | 1,56 | -9,47 | 0,7060 | -0,0805 | |||
| IJR / iShares Trust - iShares Core S&P Small-Cap ETF | 0,02 | 0,00 | 1,52 | 8,41 | 0,6892 | 0,0481 | |||
| NXTM / NxStage Medical, Inc. | 0,05 | -13,64 | 1,46 | -3,06 | 0,6597 | -0,0266 | |||
| JNJ / Johnson & Johnson | 0,01 | -0,91 | 1,45 | -6,21 | 0,6575 | -0,0494 | |||
| PEP / PepsiCo, Inc. | 0,01 | -1,17 | 1,38 | -1,43 | 0,6253 | -0,0144 | |||
| AAPL / Apple Inc. | 0,01 | 0,00 | 1,37 | 10,29 | 0,6217 | 0,0532 | |||
| QCOM / QUALCOMM Incorporated | 0,02 | -2,80 | 1,35 | -1,53 | 0,6113 | -0,0148 | |||
| / TCF Financial Corporation Depositary Shares representing 5.70% Series C Non-Cumulative Preferred Stock | 0,02 | -1,97 | 1,32 | -0,23 | 0,5963 | 0,5963 | |||
| MSFT / Microsoft Corporation | 0,01 | 0,04 | 1,30 | 8,09 | 0,5872 | 0,0393 | |||
| AKZOF / Akzo Nobel N.V. | 0,04 | 4,79 | 1,27 | -6,05 | 0,5768 | 0,5768 | |||
| SLB / Schlumberger Limited | 0,02 | 6,17 | 1,27 | 9,86 | 0,5755 | 0,0472 | |||
| SAGE / Sage Therapeutics, Inc. | 0,01 | 1,27 | 0,5741 | 0,5741 | |||||
| SJM / The J. M. Smucker Company | 0,01 | 0,87 | 1,25 | -12,57 | 0,5673 | 0,5673 | |||
| RIO / Rio Tinto Group - Depositary Receipt (Common Stock) | 0,02 | 4,93 | 1,24 | 12,94 | 0,5614 | 0,5614 | |||
| BA / The Boeing Company | 0,00 | 0,00 | 1,16 | 2,37 | 0,5274 | 0,0079 | |||
| QQQ / Invesco QQQ Trust, Series 1 | 0,01 | 1,16 | 0,5256 | 0,5256 | |||||
| GD / General Dynamics Corporation | 0,01 | 0,68 | 1,10 | -15,02 | 0,4975 | -0,0929 | |||
| DE / Deere & Company | 0,01 | 0,00 | 0,97 | -9,99 | 0,4409 | -0,0531 | |||
| MKL / Markel Group Inc. | 0,00 | 28,44 | 0,93 | 18,93 | 0,4214 | 0,4214 | |||
| BOX / Box, Inc. | 0,04 | -7,84 | 0,93 | 12,11 | 0,4196 | 0,4196 | |||
| AXP / American Express Company | 0,01 | 0,75 | 0,92 | 5,90 | 0,4151 | 0,0198 | |||
| OTCFX / T. Rowe Price Small-Cap Stock Fund Inc - T. Rowe Price Small-Cap Stock Fund | 0,02 | 0,00 | 0,89 | 6,58 | 0,4037 | 0,0217 | |||
| HAIN / The Hain Celestial Group, Inc. | 0,03 | -40,57 | 0,89 | -44,75 | 0,4033 | -0,3329 | |||
| RHT / Red Hat, Inc. | 0,01 | 0,00 | 0,86 | -10,10 | 0,3910 | -0,0476 | |||
| GOOG / Alphabet Inc. | 0,00 | -2,93 | 0,85 | 4,93 | 0,3856 | 0,0150 | |||
| US9229087104 / VANGUARD 500 INDEX FUND VANGUARD 500 INDEX ADM | 0,00 | 0,00 | 0,85 | 3,03 | 0,3847 | 0,3847 | |||
| AUB / Atlantic Union Bankshares Corporation | 0,02 | -3,14 | 0,84 | 2,56 | 0,3806 | 0,3806 | |||
| SPY / SPDR S&P 500 ETF | 0,00 | -1,92 | 0,83 | 1,09 | 0,3774 | 0,0009 | |||
| T / AT&T Inc. | 0,02 | 1,63 | 0,74 | -8,45 | 0,3339 | -0,0339 | |||
| CVX / Chevron Corporation | 0,01 | 3,73 | 0,72 | 14,93 | 0,3244 | 0,0397 | |||
| SRCI / SRC Energy Inc | 0,06 | 0,00 | 0,71 | 16,80 | 0,3213 | 0,3213 | |||
| AMGN / Amgen Inc. | 0,00 | 7,35 | 0,65 | 16,16 | 0,2932 | 0,0386 | |||
| XLU / The Select Sector SPDR Trust - The Utilities Select Sector SPDR Fund | 0,01 | -1,98 | 0,64 | 0,78 | 0,2909 | -0,0002 | |||
| LIND / Lindblad Expeditions Holdings, Inc. | 0,05 | -1,57 | 0,62 | 27,09 | 0,2827 | 0,2827 | |||
| RY / Royal Bank of Canada | 0,01 | 2,23 | 0,60 | -0,50 | 0,2732 | -0,0037 | |||
| CCU / Compañía Cervecerías Unidas S.A. - Depositary Receipt (Common Stock) | 0,02 | -3,18 | 0,57 | -17,87 | 0,2583 | -0,0589 | |||
| ANWPX / New Perspective Fund - American Funds New Perspective Fund Class A | 0,01 | 0,00 | 0,55 | 2,25 | 0,2474 | 0,0034 | |||
| WRE / Washington Real Estate Investment Trust | 0,02 | -4,63 | 0,53 | 5,99 | 0,2406 | 0,0117 | |||
| AWSHX / Washington Mutual Investors Fund - Washington Mutual Investors Fund Class A | 0,01 | 0,00 | 0,51 | -0,97 | 0,2306 | -0,0042 | |||
| GS / The Goldman Sachs Group, Inc. | 0,00 | 0,00 | 0,47 | -12,31 | 0,2130 | -0,0320 | |||
| ETR / Entergy Corporation | 0,01 | -2,53 | 0,47 | 0,00 | 0,2121 | -0,0018 | |||
| ABBV / AbbVie Inc. | 0,01 | 0,00 | 0,46 | -2,11 | 0,2098 | -0,0063 | |||
| VTSAX / Vanguard Index Funds - Vanguard Total Stock Market Index Fund Admiral | 0,01 | 0,00 | 0,45 | 3,48 | 0,2021 | 0,0051 | |||
| IVV / iShares Trust - iShares Core S&P 500 ETF | 0,00 | -5,78 | 0,45 | -3,05 | 0,2016 | -0,0081 | |||
| FUNDAMENTAL INVS / MF (360802102) | 0,01 | 0,44 | 0,0000 | ||||||
| UE / Urban Edge Properties | 0,02 | 0,00 | 0,44 | 7,11 | 0,1980 | 0,1980 | |||
| AMAT / Applied Materials, Inc. | 0,01 | -3,16 | 0,42 | -19,51 | 0,1926 | -0,0487 | |||
| BAX / Baxter International Inc. | 0,01 | -3,39 | 0,42 | 9,64 | 0,1908 | 0,1908 | |||
| DUK / Duke Energy Corporation | 0,01 | 8,59 | 0,40 | 10,92 | 0,1794 | 0,0163 | |||
| BMY / Bristol-Myers Squibb Company | 0,01 | 0,00 | 0,40 | -12,42 | 0,1790 | -0,0271 | |||
| PPG / PPG Industries, Inc. | 0,00 | 0,00 | 0,33 | -7,00 | 0,1504 | -0,0127 | |||
| TXMD / TherapeuticsMD, Inc. | 0,05 | 0,00 | 0,32 | 28,29 | 0,1459 | 0,0312 | |||
| CHUY / Chuy's Holdings, Inc. | 0,01 | -3,29 | 0,32 | 13,26 | 0,1432 | 0,1432 | |||
| FRST / Primis Financial Corp. | 0,02 | 0,30 | 0,1382 | 0,1382 | |||||
| LH / Labcorp Holdings Inc. | 0,00 | 0,00 | 0,30 | 10,91 | 0,1382 | 0,0125 | |||
| IWF / iShares Trust - iShares Russell 1000 Growth ETF | 0,00 | 0,00 | 0,30 | 5,94 | 0,1373 | 0,1373 | |||
| MAR / Marriott International, Inc. | 0,00 | -4,06 | 0,30 | -10,75 | 0,1355 | -0,0176 | |||
| VFINX / Vanguard Index Funds - Vanguard Index Trust 500 Index Fund | 0,00 | 0,00 | 0,30 | 2,77 | 0,1346 | 0,1346 | |||
| CWGIX / Capital World Growth & Income Fund - American Funds Capital World Growth & Income Fund Class A | 0,01 | -8,47 | 0,29 | -8,83 | 0,1310 | -0,0139 | |||
| ABT / Abbott Laboratories | 0,00 | 0,00 | 0,29 | 2,12 | 0,1310 | 0,0016 | |||
| USB / U.S. Bancorp | 0,01 | 0,92 | 0,27 | 0,00 | 0,1242 | -0,0011 | |||
| VBIAX / Vanguard Valley Forge Funds - Vanguard Balanced Index Fund Admiral | 0,01 | 0,00 | 0,27 | 1,87 | 0,1237 | 0,0012 | |||
| ILMN / Illumina, Inc. | 0,00 | 0,00 | 0,26 | 18,47 | 0,1192 | 0,1192 | |||
| PFE / Pfizer Inc. | 0,01 | 15,47 | 0,26 | 18,02 | 0,1187 | 0,0173 | |||
| PM / Philip Morris International Inc. | 0,00 | 0,00 | 0,24 | -18,67 | 0,1106 | -0,0265 | |||
| ATRI / Atrion Corporation | 0,00 | 0,00 | 0,24 | -5,14 | 0,1087 | 0,1087 | |||
| SMG / The Scotts Miracle-Gro Company | 0,00 | 0,22 | 0,1010 | 0,1010 | |||||
| LNC / Lincoln National Corporation | 0,00 | 0,00 | 0,22 | -14,79 | 0,0992 | -0,0182 | |||
| DHR / Danaher Corporation | 0,00 | -4,35 | 0,22 | -3,56 | 0,0983 | -0,0045 | |||
| K / Kellanova | 0,00 | 0,00 | 0,22 | 7,43 | 0,0983 | 0,0060 | |||
| GLD / SPDR Gold Trust | 0,00 | 0,00 | 0,21 | -5,70 | 0,0974 | 0,0974 | |||
| GE / General Electric Company | 0,01 | -12,80 | 0,20 | -11,95 | 0,0902 | -0,0131 | |||
| FCX / Freeport-McMoRan Inc. | 0,01 | 0,00 | 0,18 | -1,60 | 0,0834 | -0,0021 | |||
| TGNA / TEGNA Inc. | 0,01 | 13,14 | 0,14 | 8,21 | 0,0657 | 0,0657 | |||
| FOCPX / Fidelity Securities Fund - Fidelity OTC Portfolio | 0,01 | 0,13 | 0,0585 | 0,0585 | |||||
| NGRJI / NCC Ltd. | 0,01 | 0,00 | 0,04 | 2,86 | 0,0163 | 0,0163 | |||
| AUTLF / Austal Limited | 0,01 | 0,00 | 0,01 | 0,00 | 0,0063 | -0,0001 | |||
| ORHB / ORHub, Inc. | 0,01 | 0,00 | 0,01 | -20,00 | 0,0036 | 0,0036 | |||
| MXSG / Mexus Gold US | 0,28 | 0,00 | 0,00 | -42,86 | 0,0018 | -0,0014 | |||
| OA / Orbital ATK, Inc. | 0,00 | -100,00 | 0,00 | -100,00 | -1,8621 | ||||
| TWO / Two Harbors Investment Corp. | 0,00 | -100,00 | 0,00 | -100,00 | -0,0763 | ||||
| QQQ / Invesco QQQ Trust, Series 1 | 0,00 | -100,00 | 0,00 | -100,00 | 0,0000 | 0,0000 | |||
| FKGRX / Franklin Custodian Funds - Franklin Growth Fund Class A1 | 0,00 | -100,00 | 0,00 | -100,00 | 0,0000 | 0,0000 | |||
| AGCO / AGCO Corporation | 0,00 | -100,00 | 0,00 | -100,00 | 0,0000 | 0,0000 |