Grundlæggende statistik
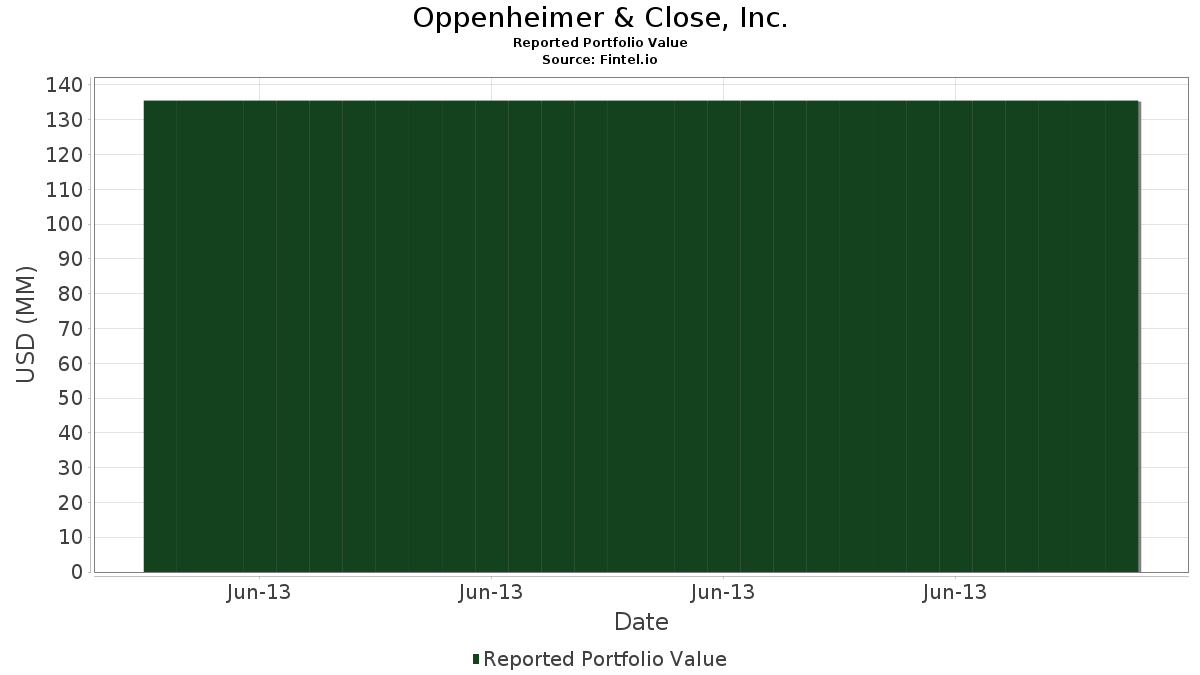
Porteføljeværdi $ 135.515.000
Nuværende stillinger 58
Seneste beholdninger, ydeevne, AUM (fra 13F, 13D)

Oppenheimer & Close, Inc. har afsløret 58 samlede besiddelser i deres seneste SEC-arkivering. Den seneste porteføljeværdi er beregnet til at være $ 135.515.000 USD. Faktiske aktiver under forvaltning (AUM) er denne værdi plus kontanter (som ikke er oplyst). Oppenheimer & Close, Inc.s største beholdninger er SPDR Gold Trust (US:GLD) , Superior Industries International, Inc. (US:SUP) , Helmerich & Payne, Inc. (US:HP) , Seacor Holdings, Inc. (US:US8119041015) , and Microsoft Corporation (US:MSFT) . Oppenheimer & Close, Inc.s nye stillinger omfatter SPDR Gold Trust (US:GLD) , Superior Industries International, Inc. (US:SUP) , Helmerich & Payne, Inc. (US:HP) , Seacor Holdings, Inc. (US:US8119041015) , and Microsoft Corporation (US:MSFT) .

Oppenheimer & Close, Inc. - Porteføljeværdi
Top øger dette kvartal

Vi bruger ændringen i porteføljeallokeringen, fordi dette er den mest meningsfulde metrik. Ændringer kan skyldes handler eller ændringer i aktiekurser.

Sikkerhed Aktier
(MM)
Værdi
(MM$)
Portefølje % ΔPortefølje %
0,06 7,74 5,7130 5,7130
0,43 7,33 5,4090 5,4090
0,11 7,08 5,2245 5,2245
0,08 7,03 5,1854 5,1854
0,20 6,98 5,1500 5,1500
0,67 6,78 5,0061 5,0061
0,08 6,65 4,9043 4,9043
0,27 6,50 4,7928 4,7928
0,42 6,05 4,4622 4,4622
0,05 5,19 3,8328 3,8328
Top falder i dette kvartal

Vi bruger ændringen i porteføljeallokeringen, fordi dette er den mest meningsfulde metrik. Ændringer kan skyldes handler eller ændringer i aktiekurser.

Sikkerhed Aktier
(MM)
Værdi
(MM$)
Portefølje % ΔPortefølje %
13F og Fondsarkivering

Denne formular blev indsendt den 2013-08-06 for rapporteringsperioden 2013-06-30. Klik på linkikonet for at se den fulde transaktionshistorik.

Opgrader for at låse op for premium-data og eksportere til Excel .

2022-07-28: Vigtig note - Vi har ændret behandlingen af kolonnen Δ Portefølje % i denne tabel. Tidligere rapporterede vi det som den procentvise ændring i porteføljeallokeringen. Vi rapporterer det nu som den rå ændring i porteføljeallokeringen (stadig rapporteret som en procent). I formeltermer rapporterede vi det tidligere som 100 * (aktuel allokering - forudgående tildeling) / forudgående tildeling. Vi indberetter det nu som (nuværende tildeling - forudgående tildeling).
Sikkerhed Type Gennemsnitlig aktiekurs Aktier
(MM)
Δ Aktier
(%)
Δ Aktier
(%)
Værdi
($MM)
Portefølje
(%)
ΔPortefølje
(%)
MARKET VECTORS ETF / GOLD MINER ETF (57060U100) 0,32 7,79 0,0000
GLD / SPDR Gold Trust 0,06 7,74 5,7130 5,7130
SUP / Superior Industries International, Inc. 0,43 7,33 5,4090 5,4090
HP / Helmerich & Payne, Inc. 0,11 7,08 5,2245 5,2245
US8119041015 / Seacor Holdings, Inc. 0,08 7,03 5,1854 5,1854
MSFT / Microsoft Corporation 0,20 6,98 5,1500 5,1500
CHFN / Charter Financial Corp. 0,67 6,78 5,0061 5,0061
JNJ / Johnson & Johnson 0,08 6,65 4,9043 4,9043
CSCO / Cisco Systems, Inc. 0,27 6,50 4,7928 4,7928
GLW / Corning Incorporated 0,42 6,05 4,4622 4,4622
MMM / 3M Company 0,05 5,19 3,8328 3,8328
NFBK / Northfield Bancorp, Inc. (Staten Island, NY) 0,32 3,79 2,7938 2,7938
PFE / Pfizer Inc. 0,11 3,22 2,3739 2,3739
78425V104 / SI Financial Group, Inc. 0,27 2,98 2,2005 2,2005
OSHC / Ocean Shore Holding Co. 0,21 2,97 2,1894 2,1894
HTBI / HomeTrust Bancshares, Inc. 0,16 2,71 2,0035 2,0035
MLVF / Malvern Bancorp Inc 0,21 2,46 1,8182 1,8182
HFBC / HopFed Bancorp, Inc. 0,20 2,13 1,5718 1,5718
IIIN / Insteel Industries, Inc. 0,12 2,10 1,5519 1,5519
SPBC / Simplify Exchange Traded Funds - Simplify US Equity PLUS Bitcoin Strategy ETF 0,11 2,08 1,5364 1,5364
CORE / Core-Mark Hldg Co Inc 0,03 1,91 1,4057 1,4057
FFCO / Fedfirst Financial Corp 0,10 1,86 1,3703 1,3703
HFBL / Home Federal Bancorp, Inc. of Louisiana 0,11 1,84 1,3548 1,3548
PWX / Providence & Worcester Railroad Co. 0,11 1,78 1,3120 1,3120
HDNG / Hardinge, Inc. 0,12 1,74 1,2803 1,2803
EBMT / Eagle Bancorp Montana, Inc. 0,16 1,72 1,2685 1,2685
ESSA / ESSA Bancorp, Inc. 0,15 1,64 1,2109 1,2109
OBAF / Oba Financial Services, Inc. 0,09 1,59 1,1770 1,1770
IROQ / IF Bancorp, Inc. 0,10 1,55 1,1423 1,1423
NVSL / Naugatuck Valley Financial Corporation 0,21 1,54 1,1342 1,1342
GTWN / Georgetown Bancorp, Inc. 0,10 1,35 0,9984 0,9984
MASC / Material Sciences Corp 0,13 1,31 0,9667 0,9667
HBCP / Home Bancorp, Inc. 0,06 1,14 0,8405 0,8405
SIBC / State Investors Bancorp, Inc. 0,08 1,13 0,8353 0,8353
NX / Quanex Building Products Corporation 0,07 1,11 0,8191 0,8191
BRT / BRT Apartments Corp. 0,16 1,11 0,8169 0,8169
COBK / Colonial Financial Services, Inc. 0,08 1,08 0,7940 0,7940
CTO / CTO Realty Growth, Inc. 0,03 1,01 0,7453 0,7453
SFBC / Sound Financial Bancorp, Inc. 0,07 0,96 0,7077 0,7077
NUE / Nucor Corporation 0,02 0,93 0,6841 0,6841
AHPI / Allied Healthcare Product Inc. 0,29 0,81 0,5985 0,5985
OFED / Oconee Federal Financial Corp. 0,05 0,79 0,5859 0,5859
NECB / Northeast Community Bancorp, Inc. 0,12 0,76 0,5586 0,5586
HURC / Hurco Companies, Inc. 0,02 0,69 0,5062 0,5062
ENG / ENGlobal Corporation 0,64 0,61 0,4509 0,4509
MARKET VECTORS ETF TR JR GOLD / GOLD MINER ETF (57060U589) 0,06 0,55 0,0000
PEOPLES FED / (711037101) 0,03 0,49 0,0000
AVX / AVX Corp. 0,04 0,48 0,3527 0,3527
FBNK / First Connecticut Bancorp, Inc. 0,03 0,47 0,3431 0,3431
HBNK / Hampden Bancorp, Inc. 0,03 0,45 0,3291 0,3291
PBCP / Polonia Bancorp, Inc. 0,04 0,41 0,3048 0,3048
NFSB / Newport Bancorp Inc 0,02 0,28 0,2037 0,2037
GLRE / Greenlight Capital Re, Ltd. 0,01 0,27 0,1963 0,1963
LABC / Louisiana Bancorp Inc 0,01 0,18 0,1306 0,1306
CMSB / Cms Bancorp, Inc. 0,02 0,15 0,1092 0,1092
HABK / Hamilton Bancorp, Inc. 0,01 0,13 0,0989 0,0989
GENC / Gencor Industries, Inc. 0,01 0,10 0,0701 0,0701
TURN / 180 Degree Capital Corp. 0,03 0,09 0,0694 0,0694