Grundlæggende statistik
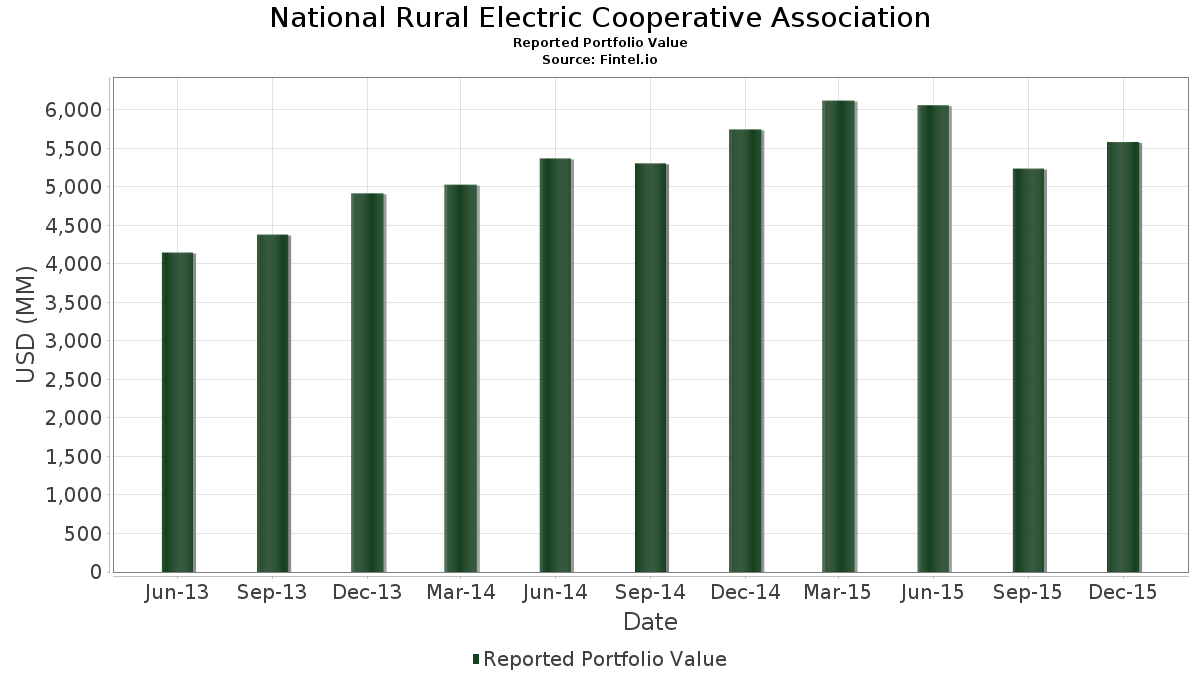
| Porteføljeværdi | $ 5.581.736.000 |
| Nuværende stillinger | 107 |
Seneste beholdninger, ydeevne, AUM (fra 13F, 13D)
National Rural Electric Cooperative Association har afsløret 107 samlede besiddelser i deres seneste SEC-arkivering. Den seneste porteføljeværdi er beregnet til at være $ 5.581.736.000 USD. Faktiske aktiver under forvaltning (AUM) er denne værdi plus kontanter (som ikke er oplyst). National Rural Electric Cooperative Associations største beholdninger er Bristol-Myers Squibb Company (US:BMY) , General Electric Company (US:GE) , Intel Corporation (US:INTC) , Cisco Systems, Inc. (US:CSCO) , and JPMorgan Chase & Co. (US:JPM) . National Rural Electric Cooperative Associations nye stillinger omfatter Sterling Bancorp. (US:STL) , Summit Materials, Inc. (US:SUM) , NN, Inc. (US:NNBR) , .
Top øger dette kvartal
Vi bruger ændringen i porteføljeallokeringen, fordi dette er den mest meningsfulde metrik. Ændringer kan skyldes handler eller ændringer i aktiekurser.
| Sikkerhed | Aktier (MM) |
Værdi (MM$) |
Portefølje % | ΔPortefølje % |
|---|---|---|---|---|
| 2,84 | 146,27 | 2,6205 | 2,6205 | |
| 1,37 | 106,24 | 1,9034 | 1,2382 | |
| 0,19 | 65,11 | 1,1665 | 0,6851 | |
| 5,74 | 178,90 | 3,2051 | 0,4389 | |
| 1,52 | 94,22 | 1,6880 | 0,3636 | |
| 0,95 | 30,12 | 0,5396 | 0,3246 | |
| 2,70 | 185,82 | 3,3291 | 0,2750 | |
| 4,97 | 171,14 | 3,0660 | 0,2065 | |
| 0,84 | 33,28 | 0,5962 | 0,2023 | |
| 2,30 | 39,96 | 0,7159 | 0,1798 |
Top falder i dette kvartal
Vi bruger ændringen i porteføljeallokeringen, fordi dette er den mest meningsfulde metrik. Ændringer kan skyldes handler eller ændringer i aktiekurser.
| Sikkerhed | Aktier (MM) |
Værdi (MM$) |
Portefølje % | ΔPortefølje % |
|---|---|---|---|---|
| 0,38 | 19,60 | 0,3511 | -1,0906 | |
| 0,80 | 52,45 | 0,9397 | -0,8507 | |
| 0,40 | 32,36 | 0,5797 | -0,5878 | |
| 0,75 | 45,26 | 0,8108 | -0,3326 | |
| 3,54 | 133,91 | 2,3990 | -0,2705 | |
| 0,45 | 57,02 | 1,0216 | -0,2430 | |
| 1,46 | 42,36 | 0,7588 | -0,2351 | |
| 1,06 | 22,61 | 0,4051 | -0,2243 | |
| 1,64 | 114,86 | 2,0577 | -0,2110 | |
| 1,23 | 56,69 | 1,0156 | -0,2052 |
13F og Fondsarkivering
Denne formular blev indsendt den 2016-02-16 for rapporteringsperioden 2015-12-31. Klik på linkikonet for at se den fulde transaktionshistorik.
Opgrader for at låse op for premium-data og eksportere til Excel ![]() .
.
| Sikkerhed | Type | Gennemsnitlig aktiekurs | Aktier (MM) |
Δ Aktier (%) |
Δ Aktier (%) |
Værdi ($MM) |
Portefølje (%) |
ΔPortefølje (%) |
|
|---|---|---|---|---|---|---|---|---|---|
| BMY / Bristol-Myers Squibb Company | 2,70 | 0,00 | 185,82 | 16,20 | 3,3291 | 0,2750 | |||
| GE / General Electric Company | 5,74 | 0,00 | 178,90 | 23,51 | 3,2051 | 0,4389 | |||
| INTC / Intel Corporation | 4,97 | 0,00 | 171,14 | 14,30 | 3,0660 | 0,2065 | |||
| CSCO / Cisco Systems, Inc. | 5,82 | 0,00 | 158,06 | 3,45 | 2,8318 | -0,0863 | |||
| JPM / JPMorgan Chase & Co. | 2,26 | 0,00 | 149,12 | 8,30 | 2,6716 | 0,0419 | |||
| AVY / Avery Dennison Corporation | 2,37 | 0,00 | 148,48 | 10,77 | 2,6601 | 0,1000 | |||
| DOW / Dow Inc. | 2,84 | 0,00 | 146,27 | 21,42 | 2,6205 | 2,6205 | |||
| CB / Chubb Limited | 1,08 | 0,00 | 143,78 | 8,15 | 2,5759 | 0,0368 | |||
| US2168311072 / Cooper Tire & Rubber Co | 3,54 | 0,00 | 133,91 | -4,20 | 2,3990 | -0,2705 | |||
| PFE / Pfizer Inc. | 4,12 | 0,00 | 132,83 | 2,77 | 2,3798 | -0,0887 | |||
| LUV / Southwest Airlines Co. | 3,05 | 0,00 | 131,25 | 13,20 | 2,3514 | 0,1370 | |||
| GPC / Genuine Parts Company | 1,49 | 0,00 | 128,09 | 3,62 | 2,2949 | -0,0660 | |||
| ABBV / AbbVie Inc. | 2,09 | 0,00 | 123,77 | 8,88 | 2,2174 | 0,0464 | |||
| DY / Dycom Industries, Inc. | 1,64 | 0,00 | 114,86 | -3,32 | 2,0577 | -0,2110 | |||
| CVX / Chevron Corporation | 1,25 | 0,00 | 112,77 | 14,05 | 2,0202 | 0,1319 | |||
| HON / Honeywell International Inc. | 1,08 | 0,00 | 111,60 | 9,38 | 1,9993 | 0,0508 | |||
| ALL / The Allstate Corporation | 1,78 | 0,00 | 110,83 | 6,61 | 1,9856 | 0,0002 | |||
| V / Visa Inc. | 1,37 | 174,00 | 106,24 | 205,04 | 1,9034 | 1,2382 | |||
| MDT / Medtronic plc | 1,36 | 0,00 | 104,82 | 14,91 | 1,8779 | 0,1358 | |||
| PH / Parker-Hannifin Corporation | 1,06 | 0,00 | 102,36 | -0,33 | 1,8339 | -0,1275 | |||
| BMS / Bemis Co., Inc. | 2,20 | 0,00 | 98,45 | 12,94 | 1,7638 | 0,0990 | |||
| AIG / American International Group, Inc. | 1,52 | 24,58 | 94,22 | 35,87 | 1,6880 | 0,3636 | |||
| COP / ConocoPhillips | 1,98 | 0,00 | 92,27 | -2,65 | 1,6531 | -0,1571 | |||
| TEL / TE Connectivity plc | 1,41 | 0,00 | 91,42 | 7,88 | 1,6378 | 0,0194 | |||
| GSK / GSK plc - Depositary Receipt (Common Stock) | 1,84 | 0,00 | 74,41 | 4,94 | 1,3330 | -0,0211 | |||
| ABT / Abbott Laboratories | 1,61 | 0,00 | 72,48 | 11,66 | 1,2986 | 0,0589 | |||
| WFC / Wells Fargo & Company | 1,33 | 0,00 | 72,12 | 5,86 | 1,2922 | -0,0090 | |||
| MTD / Mettler-Toledo International Inc. | 0,19 | 116,87 | 65,11 | 158,29 | 1,1665 | 0,6851 | |||
| STE / STERIS plc | 0,84 | 0,00 | 63,26 | 15,96 | 1,1333 | 0,0915 | |||
| CBRL / Cracker Barrel Old Country Store, Inc. | 0,45 | 0,00 | 57,02 | -13,89 | 1,0216 | -0,2430 | |||
| BHI / Baker Hughes Inc. | 1,23 | 0,00 | 56,69 | -11,32 | 1,0156 | -0,2052 | |||
| FLS / Flowserve Corporation | 1,34 | 0,00 | 56,35 | 2,29 | 1,0096 | -0,0426 | |||
| SXI / Standex International Corporation | 0,67 | 17,79 | 55,62 | 29,99 | 0,9965 | 0,1793 | |||
| AIT / Applied Industrial Technologies, Inc. | 1,36 | 0,00 | 55,12 | 6,13 | 0,9875 | -0,0043 | |||
| DDS / Dillard's, Inc. | 0,80 | -25,59 | 52,45 | -44,05 | 0,9397 | -0,8507 | |||
| RSTI / ROFIN-SINAR Technologies, Inc. | 1,83 | 0,00 | 48,92 | 3,27 | 0,8764 | -0,0282 | |||
| MRK / Merck & Co., Inc. | 0,89 | 0,00 | 46,96 | 6,95 | 0,8412 | 0,0027 | |||
| CORE / Core-Mark Hldg Co Inc | 0,57 | 0,00 | 46,89 | 25,20 | 0,8401 | 0,1248 | |||
| WLK / Westlake Corporation | 0,86 | 0,00 | 46,78 | 4,69 | 0,8381 | -0,0153 | |||
| KNX / Knight-Swift Transportation Holdings Inc. | 1,93 | 1,05 | 46,68 | 2,02 | 0,8363 | -0,0376 | |||
| WDC / Western Digital Corporation | 0,75 | 0,00 | 45,26 | -24,41 | 0,8108 | -0,3326 | |||
| WERN / Werner Enterprises, Inc. | 1,88 | 0,00 | 43,96 | -6,81 | 0,7875 | -0,1134 | |||
| UNFI / United Natural Foods, Inc. | 1,10 | 59,42 | 43,17 | 29,35 | 0,7735 | 0,1360 | |||
| MANT / Mantech International Corp - Class A | 1,42 | 0,00 | 42,83 | 17,67 | 0,7672 | 0,0722 | |||
| ECPG / Encore Capital Group, Inc. | 1,46 | 3,55 | 42,36 | -18,61 | 0,7588 | -0,2351 | |||
| CSL / Carlisle Companies Incorporated | 0,48 | 0,00 | 42,28 | 1,50 | 0,7574 | -0,0381 | |||
| EAT / Brinker International, Inc. | 0,87 | 0,00 | 41,58 | -8,96 | 0,7449 | -0,1273 | |||
| / FRANCESCAS HLDGS CORP | 2,30 | 0,00 | 39,96 | 42,35 | 0,7159 | 0,1798 | |||
| AVNT / Avient Corporation | 1,20 | 4,33 | 38,24 | 12,94 | 0,6851 | 0,0384 | |||
| WEN / The Wendy's Company | 3,52 | 0,00 | 37,90 | 24,51 | 0,6790 | 0,0977 | |||
| MRO / Marathon Oil Corporation | 2,99 | 0,00 | 37,65 | -18,25 | 0,6746 | -0,2050 | |||
| FRED / Fred's, Inc. | 2,23 | 0,00 | 36,53 | 38,14 | 0,6545 | 0,1494 | |||
| CFNL / Cardinal Financial Corp. | 1,60 | 0,00 | 36,47 | -1,13 | 0,6535 | -0,0511 | |||
| BJRI / BJ's Restaurants, Inc. | 0,83 | 0,00 | 36,13 | 1,02 | 0,6473 | -0,0358 | |||
| BAC / Bank of America Corporation | 2,10 | 0,00 | 35,28 | 8,02 | 0,6321 | 0,0083 | |||
| HII / Huntington Ingalls Industries, Inc. | 0,27 | -22,80 | 34,69 | -8,61 | 0,6215 | -0,1034 | |||
| PRIM / Primoris Services Corporation | 1,55 | 0,00 | 34,19 | 23,01 | 0,6125 | 0,0817 | |||
| NPBC / National Penn Bancshares, Inc. | 2,75 | 0,00 | 33,91 | 4,94 | 0,6075 | -0,0096 | |||
| MTW / The Manitowoc Company, Inc. | 2,18 | 0,00 | 33,52 | 2,33 | 0,6006 | -0,0251 | |||
| TGI / Triumph Group, Inc. | 0,84 | 70,79 | 33,28 | 61,33 | 0,5962 | 0,2023 | |||
| PSX / Phillips 66 | 0,40 | -50,28 | 32,36 | -47,07 | 0,5797 | -0,5878 | |||
| BDC / Belden Inc. | 0,67 | 0,00 | 31,98 | 2,12 | 0,5730 | -0,0251 | |||
| STBZ / State Bank Financial Corp. | 1,47 | 2,10 | 30,92 | 3,83 | 0,5540 | -0,0148 | |||
| RENT / Rent the Runway, Inc. | 0,65 | 0,00 | 30,90 | -12,10 | 0,5536 | -0,1178 | |||
| HP / Helmerich & Payne, Inc. | 0,57 | 0,00 | 30,36 | 13,31 | 0,5439 | 0,0322 | |||
| US74733V1008 / QEP Resources, Inc. | 2,25 | 0,00 | 30,20 | 6,94 | 0,5411 | 0,0017 | |||
| BWXT / BWX Technologies, Inc. | 0,95 | 121,98 | 30,12 | 167,53 | 0,5396 | 0,3246 | |||
| SJM / The J. M. Smucker Company | 0,24 | 0,00 | 29,57 | 8,11 | 0,5297 | 0,0074 | |||
| LDOS / Leidos Holdings, Inc. | 0,52 | 0,00 | 29,38 | 36,19 | 0,5264 | 0,1144 | |||
| 024237020 / Dean Foods Co | 1,68 | 0,00 | 28,75 | 3,81 | 0,5150 | -0,0138 | |||
| 64126X201 / NeuStar, Inc. | 1,19 | 58,98 | 28,55 | 40,05 | 0,5115 | 0,1222 | |||
| TCBI / Texas Capital Bancshares, Inc. | 0,56 | 0,00 | 27,87 | -5,72 | 0,4993 | -0,0653 | |||
| STX / Seagate Technology Holdings plc | 0,74 | 0,00 | 27,31 | -18,17 | 0,4893 | -0,1481 | |||
| GRC / The Gorman-Rupp Company | 0,95 | 0,00 | 25,32 | 11,52 | 0,4536 | 0,0200 | |||
| XEC / Cimarex Energy Co. | 0,28 | 0,00 | 24,92 | -12,78 | 0,4464 | -0,0992 | |||
| LBY / Libbey, Inc. | 1,06 | 4,95 | 22,61 | -31,38 | 0,4051 | -0,2243 | |||
| JCI / Johnson Controls International plc | 0,67 | 0,00 | 21,52 | -4,69 | 0,3855 | -0,0457 | |||
| NKSH / National Bankshares, Inc. | 0,60 | 0,00 | 21,22 | 14,24 | 0,3802 | 0,0254 | |||
| WWAV / The WhiteWave Foods Co. | 0,54 | 0,00 | 21,16 | -3,09 | 0,3790 | -0,0379 | |||
| VLY / Valley National Bancorp | 2,12 | 0,00 | 20,83 | 0,10 | 0,3732 | -0,0242 | |||
| UMBF / UMB Financial Corporation | 0,43 | 0,00 | 20,14 | -8,38 | 0,3608 | -0,0590 | |||
| MPC / Marathon Petroleum Corporation | 0,38 | -76,80 | 19,60 | -74,04 | 0,3511 | -1,0906 | |||
| GIII / G-III Apparel Group, Ltd. | 0,42 | 180,40 | 18,62 | 101,25 | 0,3335 | 0,1569 | |||
| IWN / iShares Trust - iShares Russell 2000 Value ETF | 0,20 | -31,03 | 18,40 | -29,57 | 0,3297 | -0,1693 | |||
| GBCI / Glacier Bancorp, Inc. | 0,68 | 7,98 | 17,94 | 8,56 | 0,3214 | 0,0058 | |||
| CLC / CLARCOR Inc. | 0,33 | 0,00 | 16,59 | 4,19 | 0,2973 | -0,0069 | |||
| IJR / iShares Trust - iShares Core S&P Small-Cap ETF | 0,15 | -34,78 | 16,52 | -32,61 | 0,2959 | -0,1722 | |||
| MYE / Myers Industries, Inc. | 1,22 | 0,00 | 16,26 | -0,59 | 0,2914 | -0,0211 | |||
| CASS / Cass Information Systems, Inc. | 0,28 | 73,68 | 14,43 | 81,90 | 0,2586 | 0,1071 | |||
| AVD / American Vanguard Corporation | 0,99 | 0,00 | 13,82 | 21,19 | 0,2475 | 0,0298 | |||
| 748356102 / Questar Corp. | 0,60 | 0,00 | 11,61 | 0,35 | 0,2080 | -0,0129 | |||
| US7587501039 / Regal-Beloit Corp. | 0,19 | 0,00 | 10,97 | 3,67 | 0,1965 | -0,0056 | |||
| CVLG / Covenant Logistics Group, Inc. | 0,51 | 75,75 | 9,64 | 84,72 | 0,1727 | 0,0730 | |||
| ORN / Orion Group Holdings, Inc. | 2,27 | 5,63 | 9,47 | -26,35 | 0,1697 | -0,0759 | |||
| SBH / Sally Beauty Holdings, Inc. | 0,32 | 0,00 | 9,01 | 17,42 | 0,1613 | 0,0149 | |||
| SAIC / Science Applications International Corporation | 0,18 | 0,00 | 8,11 | 13,85 | 0,1452 | 0,0092 | |||
| STL / Sterling Bancorp. | 0,40 | 6,49 | 0,1162 | 0,1162 | |||||
| MNKKQ / Mallinckrodt Plc | 0,08 | 0,00 | 6,32 | 16,72 | 0,1133 | 0,0098 | |||
| SUM / Summit Materials, Inc. | 0,32 | 6,32 | 0,1132 | 0,1132 | |||||
| RLGT / Radiant Logistics, Inc. | 1,44 | 9,53 | 4,95 | -15,77 | 0,0887 | -0,0236 | |||
| SPY / SPDR S&P 500 ETF | 0,02 | 0,00 | 4,47 | 6,41 | 0,0800 | -0,0001 | |||
| SM / SM Energy Company | 0,21 | 0,00 | 4,12 | -38,64 | 0,0738 | -0,0544 | |||
| US5249011058 / Legg Mason, Inc. | 0,10 | 0,00 | 4,02 | -5,72 | 0,0721 | -0,0094 | |||
| MBRG / Middleburg Financial Corp. | 0,21 | -28,57 | 3,83 | -24,98 | 0,0687 | -0,0289 | |||
| RDC / Rowan Companies plc | 0,17 | 0,00 | 2,97 | 4,95 | 0,0531 | -0,0008 | |||
| ISTB / iShares Trust - iShares Core 1-5 Year USD Bond ETF | 0,03 | 0,00 | 2,94 | -1,08 | 0,0527 | -0,0041 | |||
| NNBR / NN, Inc. | 0,06 | 1,03 | 0,0184 | 0,0184 | |||||
| AF / Astoria Financial Corp. | 0,00 | -100,00 | 0,00 | -100,00 | -0,0469 | ||||
| IWM / iShares Trust - iShares Russell 2000 ETF | 0,00 | -100,00 | 0,00 | -100,00 | -0,1251 |