Grundlæggende statistik
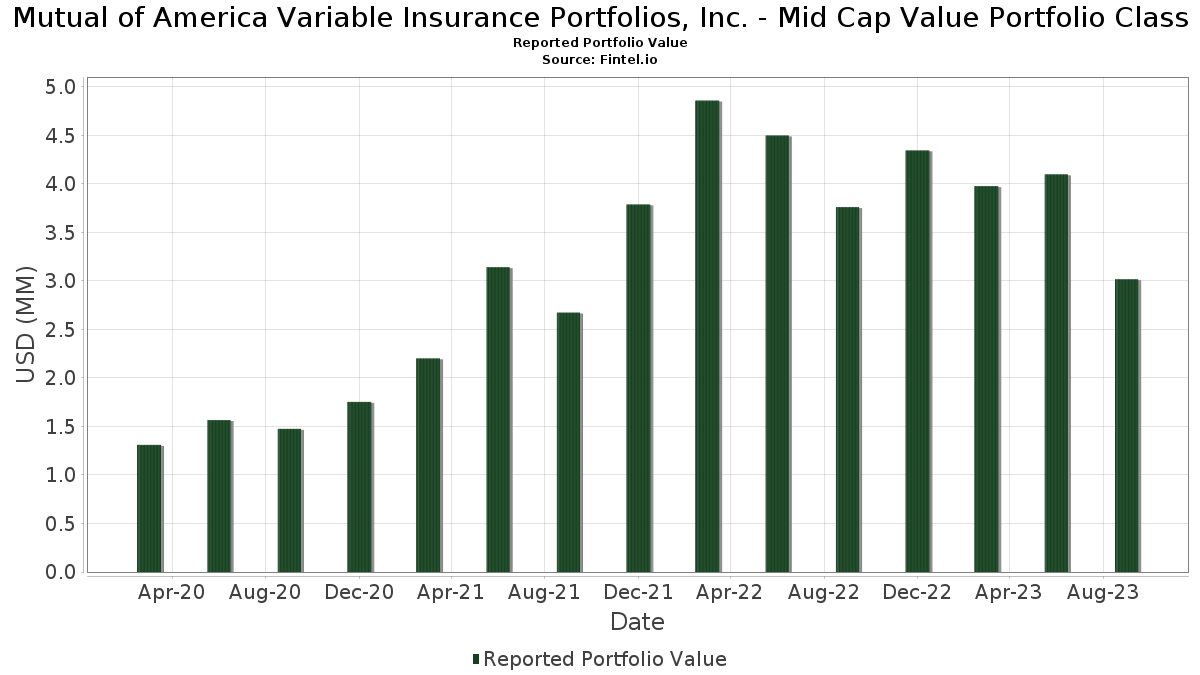
| Porteføljeværdi | $ 3.016.327 |
| Nuværende stillinger | 80 |
Seneste beholdninger, ydeevne, AUM (fra 13F, 13D)
Mutual of America Variable Insurance Portfolios, Inc. - Mid Cap Value Portfolio Class har afsløret 80 samlede besiddelser i deres seneste SEC-arkivering. Den seneste porteføljeværdi er beregnet til at være $ 3.016.327 USD. Faktiske aktiver under forvaltning (AUM) er denne værdi plus kontanter (som ikke er oplyst). Mutual of America Variable Insurance Portfolios, Inc. - Mid Cap Value Portfolio Classs største beholdninger er Crown Holdings, Inc. (US:CCK) , Baker Hughes Company (US:BKR) , Ashland Inc. (US:ASH) , Crane Co (US:) , and Ameriprise Financial, Inc. (US:AMP) .
Top øger dette kvartal
Vi bruger ændringen i porteføljeallokeringen, fordi dette er den mest meningsfulde metrik. Ændringer kan skyldes handler eller ændringer i aktiekurser.
| Sikkerhed | Aktier (MM) |
Værdi (MM$) |
Portefølje % | ΔPortefølje % |
|---|---|---|---|---|
| 0,00 | 0,05 | 1,6022 | 0,6041 | |
| 0,00 | 0,07 | 2,0937 | 0,4291 | |
| 0,00 | 0,03 | 1,0110 | 0,3980 | |
| 0,00 | 0,06 | 1,8637 | 0,3966 | |
| 0,00 | 0,03 | 1,0664 | 0,3352 | |
| 0,00 | 0,10 | 3,1881 | 0,3302 | |
| 0,00 | 0,05 | 1,6843 | 0,2703 | |
| 0,00 | 0,09 | 2,7636 | 0,2569 | |
| 0,00 | 0,07 | 2,1268 | 0,2194 | |
| 0,00 | 0,04 | 1,1817 | 0,2111 |
Top falder i dette kvartal
Vi bruger ændringen i porteføljeallokeringen, fordi dette er den mest meningsfulde metrik. Ændringer kan skyldes handler eller ændringer i aktiekurser.
| Sikkerhed | Aktier (MM) |
Værdi (MM$) |
Portefølje % | ΔPortefølje % |
|---|---|---|---|---|
| 0,00 | 0,05 | 1,5704 | -0,7428 | |
| 0,00 | 0,05 | 1,5295 | -0,5379 | |
| 0,00 | 0,02 | 0,5245 | -0,4731 | |
| 0,00 | 0,02 | 0,6750 | -0,4152 | |
| 0,00 | 0,06 | 1,7995 | -0,3359 | |
| 0,00 | 0,03 | 0,8895 | -0,2760 | |
| 0,00 | 0,02 | 0,5054 | -0,2694 | |
| 0,00 | 0,03 | 1,0589 | -0,1865 | |
| 0,00 | 0,03 | 0,7961 | -0,1843 | |
| 0,00 | 0,02 | 0,6975 | -0,1717 |
13F og Fondsarkivering
Denne formular blev indsendt den 2023-11-16 for rapporteringsperioden 2023-09-30. Klik på linkikonet for at se den fulde transaktionshistorik.
Opgrader for at låse op for premium-data og eksportere til Excel ![]() .
.
| Sikkerhed | Type | Gennemsnitlig aktiekurs | Aktier (MM) |
Δ Aktier (%) |
Δ Aktier (%) |
Værdi ($MM) |
Portefølje (%) |
ΔPortefølje (%) |
|
|---|---|---|---|---|---|---|---|---|---|
| CCK / Crown Holdings, Inc. | 0,00 | -17,85 | 0,10 | -16,67 | 3,1881 | 0,3302 | |||
| BKR / Baker Hughes Company | 0,00 | -25,99 | 0,09 | -17,14 | 2,7636 | 0,2569 | |||
| ASH / Ashland Inc. | 0,00 | -17,90 | 0,07 | -23,40 | 2,3037 | 0,0643 | |||
| / Crane Co | 0,00 | -17,82 | 0,07 | -18,18 | 2,2973 | 0,1937 | |||
| AMP / Ameriprise Financial, Inc. | 0,00 | -17,98 | 0,07 | -18,18 | 2,2880 | 0,1799 | |||
| CLH / Clean Harbors, Inc. | 0,00 | -17,83 | 0,07 | -16,25 | 2,1268 | 0,2194 | |||
| AFG / American Financial Group, Inc. | 0,00 | -18,03 | 0,07 | -22,09 | 2,1233 | 0,0571 | |||
| J / Jacobs Solutions Inc. | 0,00 | -17,83 | 0,07 | -5,71 | 2,0937 | 0,4291 | |||
| EVRG / Evergy, Inc. | 0,00 | -17,90 | 0,06 | -28,89 | 2,0341 | -0,1073 | |||
| THS / TreeHouse Foods, Inc. | 0,00 | -17,90 | 0,06 | -29,21 | 2,0205 | -0,1136 | |||
| PKG / Packaging Corporation of America | 0,00 | -17,99 | 0,06 | -4,92 | 1,8637 | 0,3966 | |||
| ZBH / Zimmer Biomet Holdings, Inc. | 0,00 | -17,99 | 0,06 | -37,08 | 1,7995 | -0,3359 | |||
| DVN / Devon Energy Corporation | 0,00 | -17,87 | 0,05 | -19,40 | 1,7233 | 0,1284 | |||
| PEG / Public Service Enterprise Group Incorporated | 0,00 | -17,87 | 0,05 | -26,39 | 1,7079 | -0,0081 | |||
| EG / Everest Group, Ltd. | 0,00 | -17,82 | 0,05 | -10,17 | 1,6843 | 0,2703 | |||
| KBR / KBR, Inc. | 0,00 | -17,87 | 0,05 | -26,47 | 1,6138 | -0,0131 | |||
| CPRI / Capri Holdings Limited | 0,00 | -17,86 | 0,05 | 21,95 | 1,6022 | 0,6041 | |||
| MLI / Mueller Industries, Inc. | 0,00 | -17,91 | 0,05 | -29,58 | 1,5935 | -0,0974 | |||
| DXC / DXC Technology Company | 0,00 | -34,68 | 0,05 | -49,48 | 1,5704 | -0,7428 | |||
| TDY / Teledyne Technologies Incorporated | 0,00 | -17,81 | 0,05 | -18,33 | 1,5538 | 0,1270 | |||
| EEFT / Euronet Worldwide, Inc. | 0,00 | -17,95 | 0,05 | -44,19 | 1,5295 | -0,5379 | |||
| GLPI / Gaming and Leisure Properties, Inc. | 0,00 | -17,93 | 0,05 | -24,19 | 1,5200 | 0,0421 | |||
| AEE / Ameren Corporation | 0,00 | -17,96 | 0,05 | -25,40 | 1,5058 | 0,0032 | |||
| AVB / AvalonBay Communities, Inc. | 0,00 | -17,88 | 0,05 | -25,81 | 1,4749 | -0,0098 | |||
| CSL / Carlisle Companies Incorporated | 0,00 | -17,97 | 0,05 | -16,36 | 1,4625 | 0,1392 | |||
| WY / Weyerhaeuser Company | 0,00 | -17,92 | 0,05 | -25,00 | 1,4332 | 0,0017 | |||
| AIRC / Apartment Income REIT Corp. | 0,00 | -17,87 | 0,05 | -29,69 | 1,4263 | -0,1051 | |||
| CXT / Crane NXT, Co. | 0,00 | -17,72 | 0,04 | -18,00 | 1,3084 | 0,0970 | |||
| TMHC / Taylor Morrison Home Corporation | 0,00 | -17,89 | 0,04 | -28,57 | 1,2950 | -0,0591 | |||
| VAC / Marriott Vacations Worldwide Corporation | 0,00 | -17,95 | 0,04 | -33,33 | 1,2246 | -0,1406 | |||
| FITB / Fifth Third Bancorp | 0,00 | -17,88 | 0,04 | -21,28 | 1,2017 | 0,0659 | |||
| STZ / Constellation Brands, Inc. | 0,00 | -18,03 | 0,04 | -17,78 | 1,1947 | 0,1240 | |||
| RGA / Reinsurance Group of America, Incorporated | 0,00 | -17,83 | 0,04 | -13,95 | 1,1871 | 0,1519 | |||
| CIEN / Ciena Corporation | 0,00 | -17,90 | 0,04 | -7,50 | 1,1817 | 0,2111 | |||
| LHX / L3Harris Technologies, Inc. | 0,00 | -17,97 | 0,04 | -28,00 | 1,1588 | -0,0325 | |||
| STLD / Steel Dynamics, Inc. | 0,00 | -17,65 | 0,04 | -18,18 | 1,1417 | 0,0852 | |||
| OSK / Oshkosh Corporation | 0,00 | -17,88 | 0,04 | -10,26 | 1,1250 | 0,1926 | |||
| HIG / The Hartford Insurance Group, Inc. | 0,00 | -17,82 | 0,03 | -19,05 | 1,0989 | 0,0802 | |||
| STWD / Starwood Property Trust, Inc. | 0,00 | -17,86 | 0,03 | -19,05 | 1,0970 | 0,0926 | |||
| ETR / Entergy Corporation | 0,00 | -17,96 | 0,03 | -20,93 | 1,0846 | 0,0407 | |||
| CNC / Centene Corporation | 0,00 | -18,06 | 0,03 | -17,50 | 1,0696 | 0,1108 | |||
| OLLI / Ollie's Bargain Outlet Holdings, Inc. | 0,00 | -17,89 | 0,03 | 10,00 | 1,0664 | 0,3352 | |||
| BLDR / Builders FirstSource, Inc. | 0,00 | -17,93 | 0,03 | -25,00 | 1,0652 | 0,0016 | |||
| TTWO / Take-Two Interactive Software, Inc. | 0,00 | -33,15 | 0,03 | -36,54 | 1,0589 | -0,1865 | |||
| AXTA / Axalta Coating Systems Ltd. | 0,00 | 50,89 | 0,03 | 24,00 | 1,0110 | 0,3980 | |||
| DOV / Dover Corporation | 0,00 | -17,58 | 0,03 | -22,50 | 0,9948 | 0,0366 | |||
| PEAK / Healthpeak Properties, Inc. | 0,00 | -17,92 | 0,03 | -24,39 | 0,9885 | -0,0005 | |||
| SWK / Stanley Black & Decker, Inc. | 0,00 | -17,96 | 0,03 | -28,57 | 0,9800 | -0,0246 | |||
| WBD / Warner Bros. Discovery, Inc. | 0,00 | -17,88 | 0,03 | -30,23 | 0,9798 | -0,0536 | |||
| TER / Teradyne, Inc. | 0,00 | -17,79 | 0,03 | -26,83 | 0,9710 | -0,0108 | |||
| NVST / Envista Holdings Corporation | 0,00 | -17,95 | 0,03 | -33,33 | 0,9692 | -0,1062 | |||
| WMB / The Williams Companies, Inc. | 0,00 | -17,90 | 0,03 | -14,29 | 0,9598 | 0,1105 | |||
| ALK / Alaska Air Group, Inc. | 0,00 | -17,90 | 0,03 | -42,86 | 0,8895 | -0,2760 | |||
| HUM / Humana Inc. | 0,00 | -18,57 | 0,03 | -12,90 | 0,8788 | 0,1348 | |||
| ATO / Atmos Energy Corporation | 0,00 | -17,89 | 0,03 | -25,00 | 0,8627 | -0,0029 | |||
| VOYA / Voya Financial, Inc. | 0,00 | -17,81 | 0,03 | -25,71 | 0,8550 | 0,0129 | |||
| MPLX / MPLX LP - Limited Partnership | 0,00 | -17,99 | 0,03 | -13,79 | 0,8015 | 0,1020 | |||
| DFS / Discover Financial Services | 0,00 | -17,85 | 0,03 | -39,02 | 0,7961 | -0,1843 | |||
| COLD / Americold Realty Trust, Inc. | 0,00 | -17,84 | 0,02 | -22,58 | 0,7681 | 0,0233 | |||
| PPL / PPL Corporation | 0,00 | -17,89 | 0,02 | -28,12 | 0,7436 | -0,0193 | |||
| KEY / KeyCorp | 0,00 | -17,93 | 0,02 | -4,17 | 0,7430 | 0,1599 | |||
| VTR / Ventas, Inc. | 0,00 | -17,88 | 0,02 | -29,03 | 0,7236 | -0,0180 | |||
| MKSI / MKS Inc. | 0,00 | -17,98 | 0,02 | -35,29 | 0,7130 | -0,1015 | |||
| AES / The AES Corporation | 0,00 | -17,91 | 0,02 | -38,89 | 0,6975 | -0,1717 | |||
| WELL / Welltower Inc. | 0,00 | -54,14 | 0,02 | -53,33 | 0,6750 | -0,4152 | |||
| WSM / Williams-Sonoma, Inc. | 0,00 | -17,68 | 0,02 | 0,00 | 0,6648 | 0,1770 | |||
| / Healthcare Realty Trust Inc | 0,00 | -17,89 | 0,02 | -35,48 | 0,6596 | -0,0846 | |||
| HES / Hess Corporation | 0,00 | -17,90 | 0,02 | -9,09 | 0,6449 | 0,1213 | |||
| FCX / Freeport-McMoRan Inc. | 0,00 | -17,85 | 0,02 | -23,08 | 0,6417 | 0,0132 | |||
| SYF / Synchrony Financial | 0,00 | -17,90 | 0,02 | -28,00 | 0,5997 | -0,0083 | |||
| BIIB / Biogen Inc. | 0,00 | -18,89 | 0,02 | -28,00 | 0,5946 | -0,0148 | |||
| NEM / Newmont Corporation | 0,00 | -17,97 | 0,02 | -28,00 | 0,5773 | -0,0322 | |||
| PTC / PTC Inc. | 0,00 | -17,88 | 0,02 | -19,05 | 0,5567 | 0,0460 | |||
| MTB / M&T Bank Corporation | 0,00 | -17,96 | 0,02 | -15,00 | 0,5490 | 0,0577 | |||
| A / Agilent Technologies, Inc. | 0,00 | -57,59 | 0,02 | -60,98 | 0,5245 | -0,4731 | |||
| VSAT / Viasat, Inc. | 0,00 | 9,37 | 0,02 | -53,12 | 0,5054 | -0,2694 | |||
| FMC / FMC Corporation | 0,00 | -17,52 | 0,01 | -50,00 | 0,4096 | -0,1708 | |||
| KRC / Kilroy Realty Corporation | 0,00 | -17,90 | 0,01 | -10,00 | 0,2895 | 0,0377 | |||
| BDN / Brandywine Realty Trust | 0,00 | -17,91 | 0,01 | -20,00 | 0,2770 | 0,0178 | |||
| ALX / Alexander's, Inc. | 0,00 | -16,67 | 0,01 | -12,50 | 0,2310 | 0,0212 |