Grundlæggende statistik
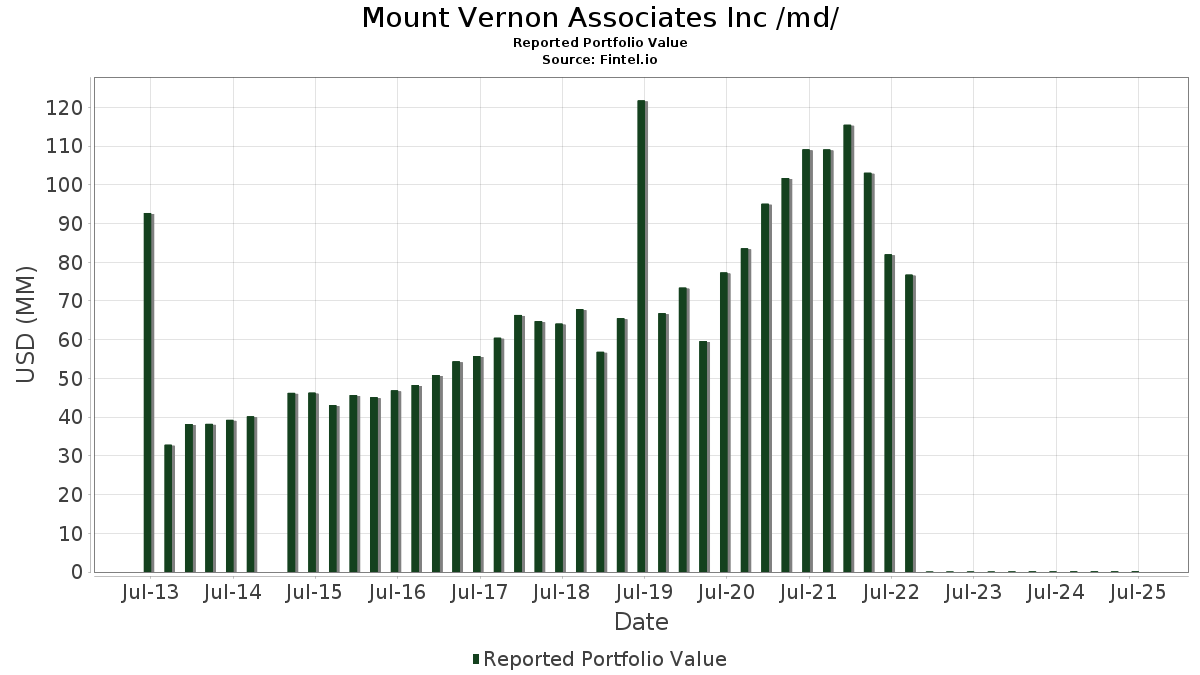
| Porteføljeværdi | $ 138.429 |
| Nuværende stillinger | 54 |
Seneste beholdninger, ydeevne, AUM (fra 13F, 13D)
Mount Vernon Associates Inc /md/ har afsløret 54 samlede besiddelser i deres seneste SEC-arkivering. Den seneste porteføljeværdi er beregnet til at være $ 138.429 USD. Faktiske aktiver under forvaltning (AUM) er denne værdi plus kontanter (som ikke er oplyst). Mount Vernon Associates Inc /md/s største beholdninger er Apple Inc. (US:AAPL) , Microsoft Corporation (US:MSFT) , Meta Platforms, Inc. (US:META) , Costco Wholesale Corporation (US:COST) , and Amazon.com, Inc. (US:AMZN) . Mount Vernon Associates Inc /md/s nye stillinger omfatter Advanced Micro Devices, Inc. (US:AMD) , Direxion Shares ETF Trust - Direxion Daily NVDA Bear 1X Shares (US:NVDD) , First Solar, Inc. (US:FSLR) , .
Top øger dette kvartal
Vi bruger ændringen i porteføljeallokeringen, fordi dette er den mest meningsfulde metrik. Ændringer kan skyldes handler eller ændringer i aktiekurser.
| Sikkerhed | Aktier (MM) |
Værdi (MM$) |
Portefølje % | ΔPortefølje % |
|---|---|---|---|---|
| 0,04 | 0,00 | 2,1737 | 1,6745 | |
| 0,02 | 0,01 | 8,8312 | 1,2684 | |
| 0,01 | 0,01 | 7,1813 | 0,8214 | |
| 0,01 | 0,01 | 4,0382 | 0,7701 | |
| 0,04 | 0,00 | 2,7010 | 0,3432 | |
| 0,01 | 0,00 | 2,1094 | 0,2564 | |
| 0,02 | 0,01 | 4,2787 | 0,2000 | |
| 0,00 | 0,00 | 0,1987 | 0,1987 | |
| 0,02 | 0,01 | 5,1882 | 0,1895 | |
| 0,00 | 0,00 | 0,1871 | 0,1871 |
Top falder i dette kvartal
Vi bruger ændringen i porteføljeallokeringen, fordi dette er den mest meningsfulde metrik. Ændringer kan skyldes handler eller ændringer i aktiekurser.
| Sikkerhed | Aktier (MM) |
Værdi (MM$) |
Portefølje % | ΔPortefølje % |
|---|---|---|---|---|
| 0,06 | 0,01 | 9,1238 | -2,2242 | |
| 0,01 | 0,01 | 7,0831 | -0,6593 | |
| 0,03 | 0,00 | 1,0402 | -0,4922 | |
| 0,07 | 0,00 | 2,5760 | -0,4514 | |
| 0,07 | 0,00 | 1,5958 | -0,3233 | |
| 0,02 | 0,00 | 1,4665 | -0,2879 | |
| 0,09 | 0,00 | 2,1217 | -0,2786 | |
| 0,01 | 0,00 | 0,3655 | -0,2576 | |
| 0,03 | 0,00 | 1,1645 | -0,2359 | |
| 0,02 | 0,00 | 0,9615 | -0,2048 |
13F og Fondsarkivering
Denne formular blev indsendt den 2025-07-22 for rapporteringsperioden 2025-06-30. Klik på linkikonet for at se den fulde transaktionshistorik.
Opgrader for at låse op for premium-data og eksportere til Excel ![]() .
.
| Sikkerhed | Type | Gennemsnitlig aktiekurs | Aktier (MM) |
Δ Aktier (%) |
Δ Aktier (%) |
Værdi ($MM) |
Portefølje (%) |
ΔPortefølje (%) |
|
|---|---|---|---|---|---|---|---|---|---|
| AAPL / Apple Inc. | 0,06 | -1,72 | 0,01 | -7,69 | 9,1238 | -2,2242 | |||
| MSFT / Microsoft Corporation | 0,02 | -0,51 | 0,01 | 33,33 | 8,8312 | 1,2684 | |||
| META / Meta Platforms, Inc. | 0,01 | -0,45 | 0,01 | 28,57 | 7,1813 | 0,8214 | |||
| COST / Costco Wholesale Corporation | 0,01 | -1,32 | 0,01 | 0,00 | 7,0831 | -0,6593 | |||
| AMZN / Amazon.com, Inc. | 0,04 | -1,32 | 0,01 | 12,50 | 6,8497 | 0,0535 | |||
| GOOG / Alphabet Inc. | 0,04 | 0,05 | 0,01 | 16,67 | 5,4439 | 0,0334 | |||
| JPM / JPMorgan Chase & Co. | 0,02 | -0,85 | 0,01 | 16,67 | 5,1882 | 0,1895 | |||
| AXP / American Express Company | 0,02 | -0,11 | 0,01 | 0,00 | 4,2787 | 0,2000 | |||
| SPOT / Spotify Technology S.A. | 0,01 | 0,00 | 0,01 | 25,00 | 4,0382 | 0,7701 | |||
| BAC / Bank of America Corporation | 0,08 | -0,06 | 0,00 | 0,00 | 2,8773 | 0,0113 | |||
| UBER / Uber Technologies, Inc. | 0,04 | 1,01 | 0,00 | 50,00 | 2,7010 | 0,3432 | |||
| TSCO / Tractor Supply Company | 0,07 | 0,30 | 0,00 | 0,00 | 2,5760 | -0,4514 | |||
| AFRM / Affirm Holdings, Inc. | 0,04 | 221,22 | 0,00 | 2,1737 | 1,6745 | ||||
| CSX / CSX Corporation | 0,09 | -10,00 | 0,00 | 0,00 | 2,1217 | -0,2786 | |||
| HSY / The Hershey Company | 0,01 | -0,09 | 0,00 | 0,00 | 2,1094 | 0,2564 | |||
| CSCO / Cisco Systems, Inc. | 0,04 | 0,36 | 0,00 | 0,00 | 2,0740 | -0,0009 | |||
| SCHW / The Charles Schwab Corporation | 0,03 | 0,66 | 0,00 | 0,00 | 1,9974 | 0,0759 | |||
| HON / Honeywell International Inc. | 0,01 | 0,00 | 0,00 | 0,00 | 1,9533 | -0,0513 | |||
| PPL / PPL Corporation | 0,07 | 0,00 | 0,00 | 0,00 | 1,5958 | -0,3233 | |||
| TXN / Texas Instruments Incorporated | 0,01 | 1,21 | 0,00 | 100,00 | 1,5676 | 0,0547 | |||
| SBUX / Starbucks Corporation | 0,02 | 1,03 | 0,00 | 0,00 | 1,4665 | -0,2879 | |||
| DAL / Delta Air Lines, Inc. | 0,04 | 0,00 | 0,00 | 0,00 | 1,4246 | -0,0011 | |||
| TSLA / Tesla, Inc. | 0,01 | -4,22 | 0,00 | 0,00 | 1,3010 | 0,0499 | |||
| IBM / International Business Machines Corporation | 0,01 | 0,00 | 0,00 | 0,00 | 1,1833 | 0,0570 | |||
| TREX / Trex Company, Inc. | 0,03 | 0,34 | 0,00 | 0,00 | 1,1645 | -0,2359 | |||
| BMY / Bristol-Myers Squibb Company | 0,03 | 0,97 | 0,00 | 0,00 | 1,0402 | -0,4922 | |||
| GEHC / GE HealthCare Technologies Inc. | 0,02 | 1,41 | 0,00 | 0,00 | 0,9615 | -0,2048 | |||
| ABNB / Airbnb, Inc. | 0,01 | 8,94 | 0,00 | 0,8618 | 0,0552 | ||||
| INTC / Intel Corporation | 0,05 | 2,72 | 0,00 | 0,00 | 0,8250 | -0,0942 | |||
| PFE / Pfizer Inc. | 0,04 | 9,08 | 0,00 | 0,00 | 0,7585 | -0,0620 | |||
| T / AT&T Inc. | 0,03 | 0,00 | 0,00 | 0,6711 | -0,0694 | ||||
| VZ / Verizon Communications Inc. | 0,02 | 0,00 | 0,00 | 0,6213 | -0,1144 | ||||
| HIG / The Hartford Insurance Group, Inc. | 0,01 | -4,37 | 0,00 | 0,6010 | -0,0914 | ||||
| LLY / Eli Lilly and Company | 0,00 | 0,00 | 0,00 | 0,5295 | -0,1034 | ||||
| C / Citigroup Inc. | 0,01 | 0,00 | 0,00 | 0,5208 | 0,0307 | ||||
| DD / DuPont de Nemours, Inc. | 0,01 | 0,34 | 0,00 | 0,4688 | -0,1053 | ||||
| ENPH / Enphase Energy, Inc. | 0,01 | 3,66 | 0,00 | 0,3655 | -0,2576 | ||||
| XOM / Exxon Mobil Corporation | 0,00 | 0,00 | 0,00 | 0,3482 | -0,0857 | ||||
| COF / Capital One Financial Corporation | 0,00 | 0,00 | 0,00 | 0,2803 | 0,0136 | ||||
| NVR / NVR, Inc. | 0,00 | 0,00 | 0,00 | 0,2666 | -0,0287 | ||||
| CAT / Caterpillar Inc. | 0,00 | 0,00 | 0,00 | 0,2666 | 0,0113 | ||||
| IP / International Paper Company | 0,01 | 0,00 | 0,00 | 0,2434 | -0,0697 | ||||
| JNJ / Johnson & Johnson | 0,00 | 3,79 | 0,00 | 0,2203 | -0,0398 | ||||
| WH / Wyndham Hotels & Resorts, Inc. | 0,00 | -11,83 | 0,00 | 0,2189 | -0,0935 | ||||
| IVV / iShares Trust - iShares Core S&P 500 ETF | 0,00 | -9,75 | 0,00 | 0,2073 | -0,0276 | ||||
| AMD / Advanced Micro Devices, Inc. | 0,00 | 0,00 | 0,1987 | 0,1987 | |||||
| MU / Micron Technology, Inc. | 0,00 | 0,00 | 0,1871 | 0,1871 | |||||
| PNC / The PNC Financial Services Group, Inc. | 0,00 | 0,00 | 0,00 | 0,1857 | -0,0125 | ||||
| GJR / Strats Trust For Procter & Gambel Security - Preferred Security | 0,00 | 10,50 | 0,00 | 0,1813 | -0,0169 | ||||
| PM / Philip Morris International Inc. | 0,00 | 0,00 | 0,00 | 0,1712 | 0,0032 | ||||
| NVDD / Direxion Shares ETF Trust - Direxion Daily NVDA Bear 1X Shares | 0,00 | 0,00 | 0,1712 | 0,1712 | |||||
| WMB / The Williams Companies, Inc. | 0,00 | 0,00 | 0,00 | 0,1625 | -0,0120 | ||||
| FSLR / First Solar, Inc. | 0,00 | 0,00 | 0,1553 | 0,1553 | |||||
| TKOI / Telkonet, Inc. | 1,19 | 0,00 | 0,00 | 0,0051 | 0,0026 | ||||
| 986005106 / YogaWorks, Inc. | 0,09 | 0,00 | 0,00 | 0,0000 | 0,0000 | ||||
| DOW / Dow Inc. | 0,00 | -100,00 | 0,00 | 0,0000 |