Grundlæggende statistik
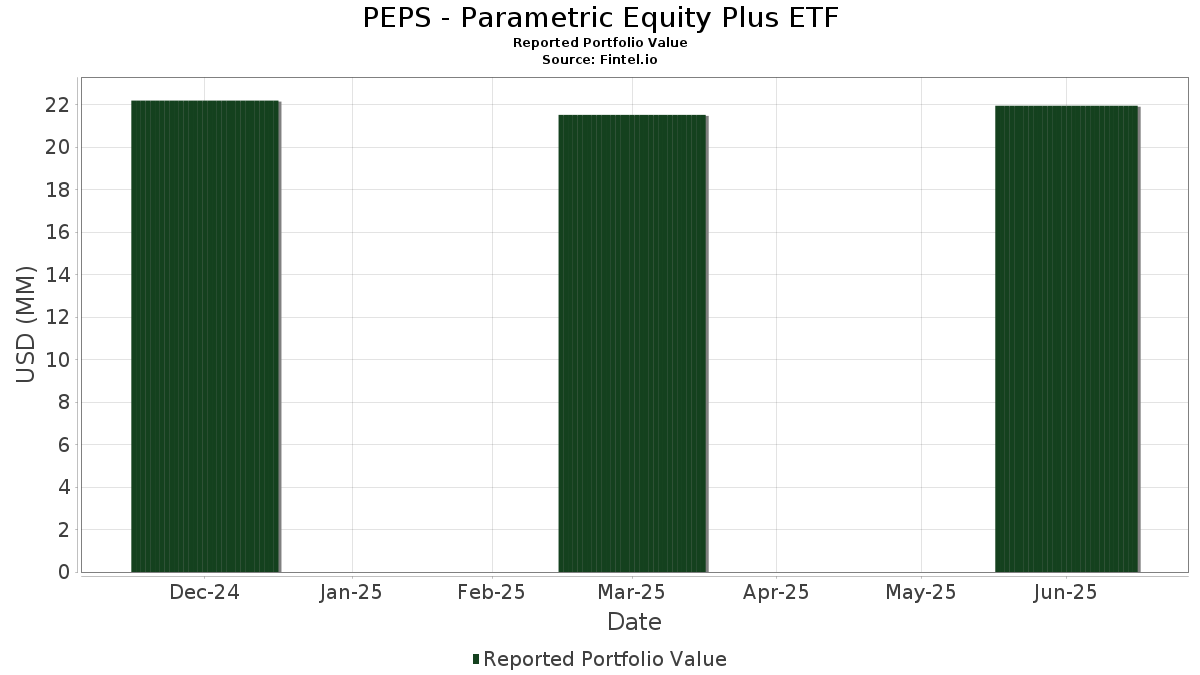
| Porteføljeværdi | $ 21.943.681 |
| Nuværende stillinger | 225 |
Seneste beholdninger, ydeevne, AUM (fra 13F, 13D)
PEPS - Parametric Equity Plus ETF har afsløret 225 samlede besiddelser i deres seneste SEC-arkivering. Den seneste porteføljeværdi er beregnet til at være $ 21.943.681 USD. Faktiske aktiver under forvaltning (AUM) er denne værdi plus kontanter (som ikke er oplyst). PEPS - Parametric Equity Plus ETFs største beholdninger er Microsoft Corporation (US:MSFT) , NVIDIA Corporation (US:NVDA) , Apple Inc. (US:AAPL) , Amazon.com, Inc. (US:AMZN) , and Morgan Stanley Institutional Liquidity Funds Government Portfolio, Institutional Class (US:US61747C7074) . PEPS - Parametric Equity Plus ETFs nye stillinger omfatter Advanced Micro Devices, Inc. (US:AMD) , Eaton Corporation plc (IT:1ETN) , Micron Technology, Inc. (US:MU) , Synopsys, Inc. (US:SNPS) , and CrowdStrike Holdings, Inc. (US:CRWD) .
Top øger dette kvartal
Vi bruger ændringen i porteføljeallokeringen, fordi dette er den mest meningsfulde metrik. Ændringer kan skyldes handler eller ændringer i aktiekurser.
| Sikkerhed | Aktier (MM) |
Værdi (MM$) |
Portefølje % | ΔPortefølje % |
|---|---|---|---|---|
| 0,28 | 1,2785 | 1,2785 | ||
| 0,01 | 1,44 | 6,5480 | 1,1719 | |
| 0,00 | 1,54 | 6,9939 | 1,1673 | |
| 0,00 | 0,56 | 2,5563 | 0,8418 | |
| 0,00 | 0,15 | 0,6773 | 0,6773 | |
| 0,00 | 0,12 | 0,5404 | 0,5404 | |
| 0,00 | 0,70 | 3,1674 | 0,5115 | |
| 0,00 | 0,10 | 0,4740 | 0,4740 | |
| 0,00 | 0,09 | 0,4149 | 0,4149 | |
| 0,00 | 0,09 | 0,3936 | 0,3936 |
Top falder i dette kvartal
Vi bruger ændringen i porteføljeallokeringen, fordi dette er den mest meningsfulde metrik. Ændringer kan skyldes handler eller ændringer i aktiekurser.
| Sikkerhed | Aktier (MM) |
Værdi (MM$) |
Portefølje % | ΔPortefølje % |
|---|---|---|---|---|
| 0,01 | 1,23 | 5,5868 | -1,1835 | |
| 0,75 | 0,75 | 3,4153 | -0,7909 | |
| 0,00 | 0,05 | 0,2312 | -0,6727 | |
| 0,00 | 0,02 | 0,0953 | -0,4144 | |
| -0,09 | -0,4034 | -0,4034 | ||
| 0,00 | 0,28 | 1,2764 | -0,3597 | |
| 0,00 | 0,27 | 1,2297 | -0,3209 | |
| -0,07 | -0,3106 | -0,3106 | ||
| 0,00 | 0,04 | 0,2010 | -0,2746 | |
| -0,06 | -0,2657 | -0,2657 |
13F og Fondsarkivering
Denne formular blev indsendt den 2025-08-22 for rapporteringsperioden 2025-06-30. Klik på linkikonet for at se den fulde transaktionshistorik.
Opgrader for at låse op for premium-data og eksportere til Excel ![]() .
.
| Sikkerhed | Type | Gennemsnitlig aktiekurs | Aktier (MM) |
Δ Aktier (%) |
Δ Aktier (%) |
Værdi ($MM) |
Portefølje (%) |
ΔPortefølje (%) |
|
|---|---|---|---|---|---|---|---|---|---|
| MSFT / Microsoft Corporation | 0,00 | -5,53 | 1,54 | 25,14 | 6,9939 | 1,1673 | |||
| NVDA / NVIDIA Corporation | 0,01 | -12,86 | 1,44 | 27,10 | 6,5480 | 1,1719 | |||
| AAPL / Apple Inc. | 0,01 | -6,83 | 1,23 | -14,01 | 5,5868 | -1,1835 | |||
| AMZN / Amazon.com, Inc. | 0,00 | -3,82 | 0,87 | 10,93 | 3,9714 | 0,2371 | |||
| US61747C7074 / Morgan Stanley Institutional Liquidity Funds Government Portfolio, Institutional Class | 0,75 | -15,32 | 0,75 | -15,33 | 3,4153 | -0,7909 | |||
| META / Meta Platforms, Inc. | 0,00 | -2,88 | 0,70 | 24,29 | 3,1674 | 0,5115 | |||
| AVGO / Broadcom Inc. | 0,00 | -5,56 | 0,56 | 55,68 | 2,5563 | 0,8418 | |||
| GOOGL / Alphabet Inc. | 0,00 | -9,70 | 0,42 | 2,96 | 1,9011 | -0,0256 | |||
| JPM / JPMorgan Chase & Co. | 0,00 | -1,54 | 0,39 | 16,42 | 1,7752 | 0,1843 | |||
| GOOG / Alphabet Inc. | 0,00 | -5,34 | 0,38 | 7,34 | 1,7314 | 0,0515 | |||
| TSLA / Tesla, Inc. | 0,00 | -13,17 | 0,34 | 6,52 | 1,5610 | 0,0314 | |||
| V / Visa Inc. | 0,00 | 1,81 | 0,30 | 3,10 | 1,3606 | -0,0151 | |||
| SPDR S&P 500 ETF Trust / DE (N/A) | 0,28 | 1,2785 | 1,2785 | ||||||
| BRK.B / Berkshire Hathaway Inc. | 0,00 | -10,80 | 0,28 | -18,84 | 1,2764 | -0,3597 | |||
| LLY / Eli Lilly and Company | 0,00 | -12,37 | 0,27 | -17,43 | 1,2297 | -0,3209 | |||
| NFLX / Netflix, Inc. | 0,00 | -11,11 | 0,26 | 27,86 | 1,1688 | 0,2139 | |||
| MA / Mastercard Incorporated | 0,00 | 1,69 | 0,24 | 4,42 | 1,0755 | -0,0003 | |||
| XOM / Exxon Mobil Corporation | 0,00 | -5,15 | 0,23 | -14,07 | 1,0291 | -0,2192 | |||
| WMT / Walmart Inc. | 0,00 | -11,11 | 0,20 | -0,99 | 0,9175 | -0,0490 | |||
| HD / The Home Depot, Inc. | 0,00 | -5,58 | 0,20 | -5,26 | 0,9017 | -0,0939 | |||
| JNJ / Johnson & Johnson | 0,00 | -7,58 | 0,20 | -14,72 | 0,8972 | -0,2020 | |||
| PG / The Procter & Gamble Company | 0,00 | 0,49 | 0,20 | -6,25 | 0,8908 | -0,0981 | |||
| COST / Costco Wholesale Corporation | 0,00 | -8,80 | 0,20 | -4,41 | 0,8865 | -0,0820 | |||
| BAC / Bank of America Corporation | 0,00 | -3,19 | 0,19 | 10,06 | 0,8480 | 0,0424 | |||
| CSCO / Cisco Systems, Inc. | 0,00 | -5,56 | 0,17 | 6,17 | 0,7828 | 0,0140 | |||
| GE / General Electric Company | 0,00 | -5,56 | 0,17 | 22,06 | 0,7559 | 0,1068 | |||
| PM / Philip Morris International Inc. | 0,00 | -5,56 | 0,16 | 8,61 | 0,7460 | 0,0281 | |||
| ABBV / AbbVie Inc. | 0,00 | -5,56 | 0,16 | -16,33 | 0,7459 | -0,1838 | |||
| WFC / Wells Fargo & Company | 0,00 | -5,56 | 0,16 | 5,41 | 0,7121 | 0,0075 | |||
| CRM / Salesforce, Inc. | 0,00 | 6,70 | 0,15 | 7,86 | 0,6905 | 0,0264 | |||
| KO / The Coca-Cola Company | 0,00 | -5,56 | 0,15 | -6,83 | 0,6835 | -0,0805 | |||
| AMD / Advanced Micro Devices, Inc. | 0,00 | 0,15 | 0,6773 | 0,6773 | |||||
| DIS / The Walt Disney Company | 0,00 | -5,56 | 0,14 | 18,80 | 0,6325 | 0,0766 | |||
| ABT / Abbott Laboratories | 0,00 | -5,56 | 0,14 | -3,50 | 0,6307 | -0,0485 | |||
| CVX / Chevron Corporation | 0,00 | -5,56 | 0,13 | -19,14 | 0,5976 | -0,1733 | |||
| LIN / Linde plc | 0,00 | -5,56 | 0,13 | -5,22 | 0,5801 | -0,0556 | |||
| T / AT&T Inc. | 0,00 | -11,11 | 0,13 | -9,42 | 0,5725 | -0,0839 | |||
| RTX / RTX Corporation | 0,00 | -5,56 | 0,12 | 4,20 | 0,5642 | -0,0009 | |||
| LRCX / Lam Research Corporation | 0,00 | -5,53 | 0,12 | 26,60 | 0,5447 | 0,0956 | |||
| PLTR / Palantir Technologies Inc. | 0,00 | -9,98 | 0,12 | 45,12 | 0,5422 | 0,1533 | |||
| MCD / McDonald's Corporation | 0,00 | -5,56 | 0,12 | -11,19 | 0,5419 | -0,0978 | |||
| 1ETN / Eaton Corporation plc | 0,00 | 0,12 | 0,5404 | 0,5404 | |||||
| PEP / PepsiCo, Inc. | 0,00 | 6,67 | 0,11 | -5,79 | 0,5186 | -0,0572 | |||
| SCHW / The Charles Schwab Corporation | 0,00 | 26,95 | 0,11 | 47,37 | 0,5118 | 0,1511 | |||
| ISRG / Intuitive Surgical, Inc. | 0,00 | -5,56 | 0,11 | 3,77 | 0,5039 | -0,0032 | |||
| MRK / Merck & Co., Inc. | 0,00 | -5,56 | 0,11 | -16,15 | 0,4955 | -0,1249 | |||
| PANW / Palo Alto Networks, Inc. | 0,00 | 20,83 | 0,11 | 45,21 | 0,4856 | 0,1361 | |||
| ACN / Accenture plc | 0,00 | -5,56 | 0,11 | -9,40 | 0,4851 | -0,0741 | |||
| UBER / Uber Technologies, Inc. | 0,00 | -5,56 | 0,11 | 21,84 | 0,4831 | 0,0665 | |||
| MU / Micron Technology, Inc. | 0,00 | 0,10 | 0,4740 | 0,4740 | |||||
| TMO / Thermo Fisher Scientific Inc. | 0,00 | 8,97 | 0,10 | -11,21 | 0,4700 | -0,0820 | |||
| QCOM / QUALCOMM Incorporated | 0,00 | -24,58 | 0,10 | -22,05 | 0,4532 | -0,1512 | |||
| LMT / Lockheed Martin Corporation | 0,00 | -5,50 | 0,10 | -2,06 | 0,4337 | -0,0280 | |||
| SNPS / Synopsys, Inc. | 0,00 | 0,09 | 0,4149 | 0,4149 | |||||
| CRWD / CrowdStrike Holdings, Inc. | 0,00 | 0,09 | 0,3936 | 0,3936 | |||||
| PFE / Pfizer Inc. | 0,00 | -5,56 | 0,09 | -9,47 | 0,3934 | -0,0607 | |||
| CVS / CVS Health Corporation | 0,00 | -11,06 | 0,08 | -9,68 | 0,3832 | -0,0581 | |||
| GEV / GE Vernova Inc. | 0,00 | 9,72 | 0,08 | 93,02 | 0,3801 | 0,1717 | |||
| DHR / Danaher Corporation | 0,00 | -6,21 | 0,08 | -9,78 | 0,3799 | -0,0585 | |||
| HLT / Hilton Worldwide Holdings Inc. | 0,00 | 15,93 | 0,08 | 36,07 | 0,3790 | 0,0877 | |||
| STX / Seagate Technology Holdings plc | 0,00 | 140,17 | 0,08 | 310,00 | 0,3766 | 0,2804 | |||
| WM / Waste Management, Inc. | 0,00 | 0,56 | 0,08 | -1,20 | 0,3766 | -0,0186 | |||
| VRTX / Vertex Pharmaceuticals Incorporated | 0,00 | -11,43 | 0,08 | -18,81 | 0,3764 | -0,1062 | |||
| MAR / Marriott International, Inc. | 0,00 | 19,44 | 0,08 | 36,67 | 0,3738 | 0,0893 | |||
| BK / The Bank of New York Mellon Corporation | 0,00 | 5,08 | 0,08 | 14,29 | 0,3682 | 0,0318 | |||
| TE Connectivity plc / EC (IE000IVNQZ81) | 0,00 | 20,45 | 0,08 | 45,45 | 0,3657 | 0,1004 | |||
| MMM / 3M Company | 0,00 | -5,56 | 0,08 | -1,23 | 0,3647 | -0,0238 | |||
| CSX / CSX Corporation | 0,00 | 18,24 | 0,08 | 32,20 | 0,3567 | 0,0730 | |||
| MELI / MercadoLibre, Inc. | 0,00 | -14,29 | 0,08 | 14,71 | 0,3564 | 0,0327 | |||
| ROK / Rockwell Automation, Inc. | 0,00 | 0,08 | 0,3564 | 0,3564 | |||||
| ARES / Ares Management Corporation | 0,00 | 31,79 | 0,07 | 55,32 | 0,3362 | 0,1110 | |||
| STT / State Street Corporation | 0,00 | 24,37 | 0,07 | 48,98 | 0,3355 | 0,0986 | |||
| NDAQ / Nasdaq, Inc. | 0,00 | 16,24 | 0,07 | 35,85 | 0,3317 | 0,0792 | |||
| AJG / Arthur J. Gallagher & Co. | 0,00 | -5,56 | 0,07 | -12,50 | 0,3216 | -0,0614 | |||
| LNG / Cheniere Energy, Inc. | 0,00 | -5,56 | 0,07 | 0,00 | 0,3199 | -0,0158 | |||
| F / Ford Motor Company | 0,01 | -5,55 | 0,07 | 2,94 | 0,3198 | -0,0066 | |||
| MS / Morgan Stanley | 0,00 | -5,56 | 0,07 | 15,00 | 0,3157 | 0,0270 | |||
| TMUS / T-Mobile US, Inc. | 0,00 | -24,87 | 0,07 | -33,00 | 0,3076 | -0,1704 | |||
| RSG / Republic Services, Inc. | 0,00 | -5,56 | 0,07 | -2,90 | 0,3049 | -0,0257 | |||
| COR / Cencora, Inc. | 0,00 | -5,56 | 0,07 | 1,54 | 0,3012 | -0,0073 | |||
| HCA / HCA Healthcare, Inc. | 0,00 | -5,56 | 0,07 | 4,84 | 0,2961 | 0,0012 | |||
| SPOT / Spotify Technology S.A. | 0,00 | -22,22 | 0,06 | 8,47 | 0,2930 | 0,0114 | |||
| HUM / Humana Inc. | 0,00 | -5,40 | 0,06 | -12,33 | 0,2923 | -0,0564 | |||
| SHW / The Sherwin-Williams Company | 0,00 | -5,56 | 0,06 | -7,25 | 0,2919 | -0,0359 | |||
| EW / Edwards Lifesciences Corporation | 0,00 | -5,56 | 0,06 | 1,61 | 0,2901 | -0,0068 | |||
| CRH / CRH plc | 0,00 | -5,56 | 0,06 | -1,64 | 0,2767 | -0,0161 | |||
| TROW / T. Rowe Price Group, Inc. | 0,00 | 0,06 | 0,2746 | 0,2746 | |||||
| PPG / PPG Industries, Inc. | 0,00 | -5,54 | 0,06 | -1,64 | 0,2735 | -0,0168 | |||
| SCCO / Southern Copper Corporation | 0,00 | -8,77 | 0,06 | -1,67 | 0,2727 | -0,0153 | |||
| MET / MetLife, Inc. | 0,00 | -5,56 | 0,06 | -6,45 | 0,2672 | -0,0274 | |||
| VRSK / Verisk Analytics, Inc. | 0,00 | -5,56 | 0,06 | 0,00 | 0,2648 | -0,0146 | |||
| HIG / The Hartford Insurance Group, Inc. | 0,00 | -5,56 | 0,06 | -3,33 | 0,2647 | -0,0204 | |||
| YUM / Yum! Brands, Inc. | 0,00 | -5,56 | 0,06 | -12,31 | 0,2634 | -0,0455 | |||
| DOV / Dover Corporation | 0,00 | 17,04 | 0,06 | 21,28 | 0,2632 | 0,0383 | |||
| O / Realty Income Corporation | 0,00 | -5,56 | 0,06 | -6,56 | 0,2627 | -0,0294 | |||
| WRB / W. R. Berkley Corporation | 0,00 | -5,56 | 0,06 | -1,72 | 0,2612 | -0,0182 | |||
| DVN / Devon Energy Corporation | 0,00 | 0,06 | 0,2604 | 0,2604 | |||||
| WAB / Westinghouse Air Brake Technologies Corporation | 0,00 | -5,56 | 0,06 | 7,69 | 0,2589 | 0,0113 | |||
| ETR / Entergy Corporation | 0,00 | -5,56 | 0,06 | -8,20 | 0,2569 | -0,0349 | |||
| WEC / WEC Energy Group, Inc. | 0,00 | -5,56 | 0,05 | -10,00 | 0,2496 | -0,0387 | |||
| FE / FirstEnergy Corp. | 0,00 | 12,52 | 0,05 | 12,50 | 0,2484 | 0,0173 | |||
| CCI / Crown Castle Inc. | 0,00 | -5,56 | 0,05 | -6,90 | 0,2461 | -0,0296 | |||
| OTIS / Otis Worldwide Corporation | 0,00 | -5,56 | 0,05 | -10,17 | 0,2449 | -0,0369 | |||
| BR / Broadridge Financial Solutions, Inc. | 0,00 | -5,56 | 0,05 | -5,36 | 0,2442 | -0,0248 | |||
| VICI / VICI Properties Inc. | 0,00 | -5,56 | 0,05 | -5,36 | 0,2419 | -0,0254 | |||
| MPWR / Monolithic Power Systems, Inc. | 0,00 | 0,05 | 0,2394 | 0,2394 | |||||
| AEE / Ameren Corporation | 0,00 | -5,56 | 0,05 | -8,77 | 0,2375 | -0,0367 | |||
| DTE / DTE Energy Company | 0,00 | -5,56 | 0,05 | -10,53 | 0,2354 | -0,0359 | |||
| UNH / UnitedHealth Group Incorporated | 0,00 | -55,22 | 0,05 | -73,68 | 0,2312 | -0,6727 | |||
| PPL / PPL Corporation | 0,00 | -5,56 | 0,05 | -12,28 | 0,2305 | -0,0407 | |||
| DELL / Dell Technologies Inc. | 0,00 | 50,18 | 0,05 | 61,29 | 0,2302 | 0,0876 | |||
| ROST / Ross Stores, Inc. | 0,00 | -5,56 | 0,05 | -5,77 | 0,2268 | -0,0240 | |||
| ON / ON Semiconductor Corporation | 0,00 | 0,05 | 0,2259 | 0,2259 | |||||
| PRU / Prudential Financial, Inc. | 0,00 | -5,56 | 0,05 | -9,26 | 0,2242 | -0,0331 | |||
| SSNC / SS&C Technologies Holdings, Inc. | 0,00 | -5,56 | 0,05 | -5,77 | 0,2240 | -0,0255 | |||
| HBAN / Huntington Bancshares Incorporated | 0,00 | -10,81 | 0,05 | -2,04 | 0,2226 | -0,0105 | |||
| WDAY / Workday, Inc. | 0,00 | -5,56 | 0,05 | -4,00 | 0,2226 | -0,0166 | |||
| VEEV / Veeva Systems Inc. | 0,00 | -5,56 | 0,05 | 17,07 | 0,2226 | 0,0249 | |||
| INTC / Intel Corporation | 0,00 | 0,05 | 0,2222 | 0,2222 | |||||
| BRO / Brown & Brown, Inc. | 0,00 | -11,32 | 0,05 | -21,67 | 0,2172 | -0,0694 | |||
| LII / Lennox International Inc. | 0,00 | 0,05 | 0,2163 | 0,2163 | |||||
| DASH / DoorDash, Inc. | 0,00 | -11,11 | 0,05 | 20,51 | 0,2152 | 0,0280 | |||
| IBKR / Interactive Brokers Group, Inc. | 0,00 | 294,44 | 0,05 | 34,29 | 0,2146 | 0,0450 | |||
| CMS / CMS Energy Corporation | 0,00 | -5,56 | 0,05 | -12,96 | 0,2142 | -0,0422 | |||
| INVH / Invitation Homes Inc. | 0,00 | -5,56 | 0,05 | -11,54 | 0,2129 | -0,0369 | |||
| LNT / Alliant Energy Corporation | 0,00 | -5,56 | 0,05 | -11,54 | 0,2103 | -0,0368 | |||
| EQR / Equity Residential | 0,00 | -5,56 | 0,05 | -11,76 | 0,2086 | -0,0357 | |||
| FERG / Ferguson Enterprises Inc. | 0,00 | -22,22 | 0,05 | 4,65 | 0,2079 | 0,0028 | |||
| SNOW / Snowflake Inc. | 0,00 | -5,56 | 0,05 | 45,16 | 0,2075 | 0,0578 | |||
| LPLA / LPL Financial Holdings Inc. | 0,00 | 34,44 | 0,05 | 55,17 | 0,2063 | 0,0667 | |||
| HSY / The Hershey Company | 0,00 | -5,56 | 0,05 | -8,16 | 0,2052 | -0,0283 | |||
| AVB / AvalonBay Communities, Inc. | 0,00 | -5,56 | 0,04 | -12,00 | 0,2044 | -0,0336 | |||
| HEI / HEICO Corporation | 0,00 | -5,56 | 0,04 | 15,79 | 0,2028 | 0,0204 | |||
| PFG / Principal Financial Group, Inc. | 0,00 | -5,56 | 0,04 | -12,00 | 0,2026 | -0,0350 | |||
| DOW / Dow Inc. | 0,00 | 0,04 | 0,2016 | 0,2016 | |||||
| OXY / Occidental Petroleum Corporation | 0,00 | -5,56 | 0,04 | -20,00 | 0,2013 | -0,0599 | |||
| NOW / ServiceNow, Inc. | 0,00 | -65,87 | 0,04 | -56,00 | 0,2010 | -0,2746 | |||
| WTW / Willis Towers Watson Public Limited Company | 0,00 | -11,11 | 0,04 | -18,52 | 0,2006 | -0,0589 | |||
| PDYPF / Flutter Entertainment plc | 0,00 | -5,56 | 0,04 | 22,86 | 0,1988 | 0,0286 | |||
| ZS / Zscaler, Inc. | 0,00 | 28,70 | 0,04 | 104,76 | 0,1984 | 0,0968 | |||
| L / Loews Corporation | 0,00 | -5,56 | 0,04 | -4,55 | 0,1913 | -0,0205 | |||
| WSM / Williams-Sonoma, Inc. | 0,00 | 18,52 | 0,04 | 20,59 | 0,1901 | 0,0282 | |||
| DOC / Healthpeak Properties, Inc. | 0,00 | -10,87 | 0,04 | -22,64 | 0,1879 | -0,0660 | |||
| MSTR / Strategy Inc | 0,00 | -15,70 | 0,04 | 20,59 | 0,1874 | 0,0221 | |||
| NET / Cloudflare, Inc. | 0,00 | -5,56 | 0,04 | 62,50 | 0,1816 | 0,0662 | |||
| APP / AppLovin Corporation | 0,00 | -20,83 | 0,04 | 2,63 | 0,1814 | 0,0005 | |||
| ULTA / Ulta Beauty, Inc. | 0,00 | -5,56 | 0,04 | 21,88 | 0,1808 | 0,0244 | |||
| HEIA / Heico Corp. - Class A | 0,00 | -5,66 | 0,04 | 15,15 | 0,1764 | 0,0174 | |||
| ZBH / Zimmer Biomet Holdings, Inc. | 0,00 | -5,56 | 0,04 | -24,00 | 0,1762 | -0,0652 | |||
| HOOD / Robinhood Markets, Inc. | 0,00 | 35,29 | 0,04 | 216,67 | 0,1762 | 0,1158 | |||
| CHD / Church & Dwight Co., Inc. | 0,00 | -18,11 | 0,04 | -28,30 | 0,1739 | -0,0798 | |||
| KHC / The Kraft Heinz Company | 0,00 | -5,56 | 0,04 | -21,28 | 0,1716 | -0,0517 | |||
| FOXA / Fox Corporation | 0,00 | -11,11 | 0,04 | -12,50 | 0,1630 | -0,0302 | |||
| BAX / Baxter International Inc. | 0,00 | -5,56 | 0,04 | -16,67 | 0,1615 | -0,0401 | |||
| TW / Tradeweb Markets Inc. | 0,00 | -11,11 | 0,04 | -12,50 | 0,1597 | -0,0303 | |||
| TEAM / Atlassian Corporation | 0,00 | 83,33 | 0,03 | 73,68 | 0,1523 | 0,0618 | |||
| CFG / Citizens Financial Group, Inc. | 0,00 | -5,56 | 0,03 | 3,13 | 0,1522 | -0,0017 | |||
| ALNY / Alnylam Pharmaceuticals, Inc. | 0,00 | -5,56 | 0,03 | 13,79 | 0,1512 | 0,0130 | |||
| RBLX / Roblox Corporation | 0,00 | 9,03 | 0,03 | 106,25 | 0,1502 | 0,0706 | |||
| MOH / Molina Healthcare, Inc. | 0,00 | -5,17 | 0,03 | -15,79 | 0,1490 | -0,0322 | |||
| HUBB / Hubbell Incorporated | 0,00 | 0,03 | 0,1467 | 0,1467 | |||||
| SUI / Sun Communities, Inc. | 0,00 | -5,56 | 0,03 | -5,88 | 0,1466 | -0,0180 | |||
| BSY / Bentley Systems, Incorporated | 0,00 | 37,73 | 0,03 | 100,00 | 0,1460 | 0,0654 | |||
| RS / Reliance, Inc. | 0,00 | -5,56 | 0,03 | 3,23 | 0,1456 | -0,0023 | |||
| IT / Gartner, Inc. | 0,00 | -6,10 | 0,03 | -8,82 | 0,1415 | -0,0217 | |||
| EXPD / Expeditors International of Washington, Inc. | 0,00 | -5,56 | 0,03 | -10,00 | 0,1236 | -0,0201 | |||
| GFS / GLOBALFOUNDRIES Inc. | 0,00 | -41,04 | 0,03 | -40,48 | 0,1177 | -0,0835 | |||
| TER / Teradyne, Inc. | 0,00 | 0,03 | 0,1169 | 0,1169 | |||||
| CPNG / Coupang, Inc. | 0,00 | -15,12 | 0,02 | 14,29 | 0,1124 | 0,0113 | |||
| JBHT / J.B. Hunt Transport Services, Inc. | 0,00 | -35,58 | 0,02 | -38,46 | 0,1123 | -0,0750 | |||
| EXE / Expand Energy Corporation | 0,00 | 34,62 | 0,02 | 41,18 | 0,1116 | 0,0293 | |||
| DECK / Deckers Outdoor Corporation | 0,00 | 0,02 | 0,1115 | 0,1115 | |||||
| WSO / Watsco, Inc. | 0,00 | -41,11 | 0,02 | -48,89 | 0,1064 | -0,1105 | |||
| ZM / Zoom Communications Inc. | 0,00 | 138,10 | 0,02 | 155,56 | 0,1063 | 0,0623 | |||
| TKO / TKO Group Holdings, Inc. | 0,00 | -11,11 | 0,02 | 4,55 | 0,1059 | 0,0016 | |||
| CEG / Constellation Energy Corporation | 0,00 | 0,02 | 0,0998 | 0,0998 | |||||
| CAT / Caterpillar Inc. | 0,00 | -83,44 | 0,02 | -81,31 | 0,0953 | -0,4144 | |||
| ELAA / The Estée Lauder Companies Inc. | 0,00 | 0,02 | 0,0940 | 0,0940 | |||||
| NTRA / Natera, Inc. | 0,00 | 0,02 | 0,0937 | 0,0937 | |||||
| TOST / Toast, Inc. | 0,00 | 0,02 | 0,0916 | 0,0916 | |||||
| TRGP / Targa Resources Corp. | 0,00 | -64,38 | 0,02 | -70,49 | 0,0863 | -0,2046 | |||
| FOX / Fox Corporation | 0,00 | -11,11 | 0,02 | -10,00 | 0,0826 | -0,0163 | |||
| DKNG / DraftKings Inc. | 0,00 | -5,49 | 0,02 | 21,43 | 0,0805 | 0,0117 | |||
| PINS / Pinterest, Inc. | 0,00 | -5,56 | 0,02 | 13,33 | 0,0776 | 0,0035 | |||
| SMCI / Super Micro Computer, Inc. | 0,00 | 0,02 | 0,0749 | 0,0749 | |||||
| BAH / Booz Allen Hamilton Holding Corporation | 0,00 | 44,04 | 0,02 | 45,45 | 0,0743 | 0,0203 | |||
| HOLX / Hologic, Inc. | 0,00 | -61,53 | 0,02 | -58,97 | 0,0732 | -0,1148 | |||
| IOT / Samsara Inc. | 0,00 | 0,02 | 0,0727 | 0,0727 | |||||
| WLK / Westlake Corporation | 0,00 | -59,14 | 0,02 | -70,00 | 0,0718 | -0,1696 | |||
| EIX / Edison International | 0,00 | -4,50 | 0,02 | -16,67 | 0,0697 | -0,0172 | |||
| LYB / LyondellBasell Industries N.V. | 0,00 | -68,17 | 0,02 | -73,68 | 0,0687 | -0,2050 | |||
| TPL / Texas Pacific Land Corporation | 0,00 | -26,32 | 0,01 | -44,00 | 0,0672 | -0,0521 | |||
| RDDT / Reddit, Inc. | 0,00 | 0,01 | 0,0643 | 0,0643 | |||||
| HAL / Halliburton Company | 0,00 | -73,72 | 0,01 | -79,37 | 0,0613 | -0,2416 | |||
| PSTG / Pure Storage, Inc. | 0,00 | -36,39 | 0,01 | -13,33 | 0,0599 | -0,0156 | |||
| PHM / PulteGroup, Inc. | 0,00 | -47,90 | 0,01 | -45,83 | 0,0594 | -0,0565 | |||
| UI / Ubiquiti Inc. | 0,00 | 0,01 | 0,0580 | 0,0580 | |||||
| DOX / Amdocs Limited | 0,00 | -5,56 | 0,01 | -7,69 | 0,0564 | -0,0061 | |||
| RPRX / Royalty Pharma plc | 0,00 | -5,56 | 0,01 | 9,09 | 0,0557 | 0,0026 | |||
| XYZ / Block, Inc. | 0,00 | -62,26 | 0,01 | -56,00 | 0,0537 | -0,0650 | |||
| BMRN / BioMarin Pharmaceutical Inc. | 0,00 | -5,73 | 0,01 | -30,77 | 0,0452 | -0,0191 | |||
| ARE / Alexandria Real Estate Equities, Inc. | 0,00 | 0,01 | 0,0442 | 0,0442 | |||||
| CSL / Carlisle Companies Incorporated | 0,00 | -75,93 | 0,01 | -75,00 | 0,0441 | -0,1302 | |||
| BBY / Best Buy Co., Inc. | 0,00 | 0,01 | 0,0433 | 0,0433 | |||||
| IEX / IDEX Corporation | 0,00 | -74,29 | 0,01 | -76,32 | 0,0431 | -0,1371 | |||
| BLDR / Builders FirstSource, Inc. | 0,00 | -72,28 | 0,01 | -75,76 | 0,0393 | -0,1189 | |||
| RKT / Rocket Companies, Inc. | 0,00 | 0,01 | 0,0387 | 0,0387 | |||||
| OKTA / Okta, Inc. | 0,00 | -5,56 | 0,01 | -11,11 | 0,0386 | -0,0063 | |||
| WMG / Warner Music Group Corp. | 0,00 | -5,56 | 0,01 | -20,00 | 0,0379 | -0,0103 | |||
| S&P 500 Mini-SPX Index / DE (N/A) | 0,00 | 0,0130 | 0,0130 | ||||||
| S&P 500 Mini-SPX Index / DE (N/A) | 0,00 | 0,0108 | 0,0108 | ||||||
| S&P 500 Mini-SPX Index / DE (N/A) | 0,00 | 0,0101 | 0,0101 | ||||||
| S&P 500 Mini-SPX Index / DE (N/A) | 0,00 | 0,0043 | 0,0043 | ||||||
| S&P 500 Mini-SPX Index / DE (N/A) | 0,00 | 0,0038 | 0,0038 | ||||||
| S&P 500 Mini-SPX Index / DE (N/A) | 0,00 | 0,0021 | 0,0021 | ||||||
| S&P 500 Mini-SPX Index / DE (N/A) | 0,00 | 0,0020 | 0,0020 | ||||||
| S&P 500 Mini-SPX Index / DE (N/A) | 0,00 | 0,0003 | 0,0003 | ||||||
| S&P 500 Mini-SPX Index / DE (N/A) | 0,00 | 0,0002 | 0,0002 | ||||||
| MRVL / Marvell Technology, Inc. | 0,00 | -100,00 | 0,00 | -100,00 | -0,1900 | ||||
| ALAB / Astera Labs, Inc. | 0,00 | -100,00 | 0,00 | -100,00 | -0,0512 | ||||
| SWKS / Skyworks Solutions, Inc. | 0,00 | -100,00 | 0,00 | -100,00 | -0,1753 | ||||
| PYPL / PayPal Holdings, Inc. | 0,00 | -100,00 | 0,00 | -100,00 | -0,2227 | ||||
| S&P 500 Index / DE (N/A) | -0,01 | -0,0413 | -0,0413 | ||||||
| S&P 500 Index / DE (N/A) | -0,02 | -0,0799 | -0,0799 | ||||||
| S&P 500 Index / DE (N/A) | -0,02 | -0,0841 | -0,0841 | ||||||
| S&P 500 Index / DE (N/A) | -0,04 | -0,2038 | -0,2038 | ||||||
| S&P 500 Index / DE (N/A) | -0,06 | -0,2657 | -0,2657 | ||||||
| S&P 500 Index / DE (N/A) | -0,07 | -0,3106 | -0,3106 | ||||||
| SPDR S&P 500 ETF Trust / DE (N/A) | -0,09 | -0,4034 | -0,4034 |