Grundlæggende statistik
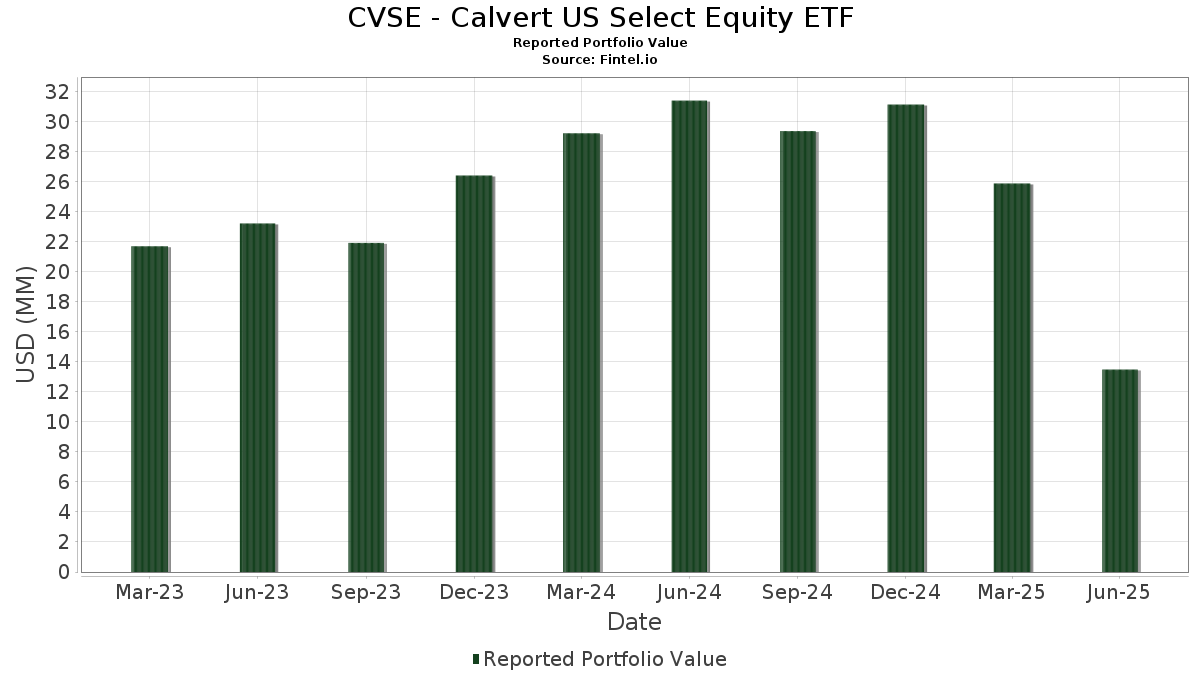
| Porteføljeværdi | $ 13.495.446 |
| Nuværende stillinger | 166 |
Seneste beholdninger, ydeevne, AUM (fra 13F, 13D)
CVSE - Calvert US Select Equity ETF har afsløret 166 samlede besiddelser i deres seneste SEC-arkivering. Den seneste porteføljeværdi er beregnet til at være $ 13.495.446 USD. Faktiske aktiver under forvaltning (AUM) er denne værdi plus kontanter (som ikke er oplyst). CVSE - Calvert US Select Equity ETFs største beholdninger er Microsoft Corporation (US:MSFT) , NVIDIA Corporation (US:NVDA) , Apple Inc. (US:AAPL) , Netflix, Inc. (US:NFLX) , and Parker-Hannifin Corporation (US:PH) . CVSE - Calvert US Select Equity ETFs nye stillinger omfatter Abbott Laboratories (US:ABT) , BlackRock, Inc. (US:BLK) , Exelon Corporation (US:EXC) , Public Service Enterprise Group Incorporated (US:PEG) , and Analog Devices, Inc. (US:ADI) .
Top øger dette kvartal
Vi bruger ændringen i porteføljeallokeringen, fordi dette er den mest meningsfulde metrik. Ændringer kan skyldes handler eller ændringer i aktiekurser.
| Sikkerhed | Aktier (MM) |
Værdi (MM$) |
Portefølje % | ΔPortefølje % |
|---|---|---|---|---|
| 0,00 | 0,23 | 1,6672 | 1,6672 | |
| 0,00 | 0,25 | 1,8532 | 1,3562 | |
| 0,01 | 1,01 | 7,4716 | 1,0851 | |
| 0,00 | 0,14 | 1,0725 | 1,0725 | |
| 0,00 | 0,27 | 2,0294 | 1,0096 | |
| 0,00 | 0,14 | 1,0053 | 0,8165 | |
| 0,00 | 0,11 | 0,8040 | 0,8040 | |
| 0,00 | 0,23 | 1,6926 | 0,7700 | |
| 0,00 | 0,10 | 0,7295 | 0,7295 | |
| 0,00 | 0,21 | 1,5876 | 0,7033 |
Top falder i dette kvartal
Vi bruger ændringen i porteføljeallokeringen, fordi dette er den mest meningsfulde metrik. Ændringer kan skyldes handler eller ændringer i aktiekurser.
| Sikkerhed | Aktier (MM) |
Værdi (MM$) |
Portefølje % | ΔPortefølje % |
|---|---|---|---|---|
| 0,00 | 0,73 | 5,3719 | -1,8057 | |
| 0,00 | 0,02 | 0,1454 | -1,2160 | |
| 0,00 | 0,24 | 1,7783 | -1,2151 | |
| 0,00 | 0,08 | 0,6121 | -1,1022 | |
| 0,00 | 0,16 | 1,1521 | -1,0203 | |
| 0,00 | 0,01 | 0,0872 | -0,7175 | |
| 0,00 | 0,03 | 0,2009 | -0,6042 | |
| 0,00 | 0,08 | 0,6197 | -0,5772 | |
| 0,00 | 0,11 | 0,7929 | -0,5069 | |
| 0,00 | 0,03 | 0,2103 | -0,4939 |
13F og Fondsarkivering
Denne formular blev indsendt den 2025-08-22 for rapporteringsperioden 2025-06-30. Klik på linkikonet for at se den fulde transaktionshistorik.
Opgrader for at låse op for premium-data og eksportere til Excel ![]() .
.
| Sikkerhed | Type | Gennemsnitlig aktiekurs | Aktier (MM) |
Δ Aktier (%) |
Δ Aktier (%) |
Værdi ($MM) |
Portefølje (%) |
ΔPortefølje (%) |
|
|---|---|---|---|---|---|---|---|---|---|
| MSFT / Microsoft Corporation | 0,00 | -58,89 | 1,03 | -45,55 | 7,6114 | 0,2995 | |||
| NVDA / NVIDIA Corporation | 0,01 | -58,00 | 1,01 | -38,80 | 7,4716 | 1,0851 | |||
| AAPL / Apple Inc. | 0,00 | -57,59 | 0,73 | -60,83 | 5,3719 | -1,8057 | |||
| NFLX / Netflix, Inc. | 0,00 | -49,90 | 0,35 | -27,95 | 2,5788 | 0,7028 | |||
| PH / Parker-Hannifin Corporation | 0,00 | -38,29 | 0,29 | -28,96 | 2,1262 | 0,5570 | |||
| BSX / Boston Scientific Corporation | 0,00 | -2,19 | 0,27 | 4,18 | 2,0294 | 1,0096 | |||
| V / Visa Inc. | 0,00 | -42,64 | 0,27 | -41,89 | 1,9670 | 0,1956 | |||
| COF / Capital One Financial Corporation | 0,00 | 64,48 | 0,25 | 95,31 | 1,8532 | 1,3562 | |||
| LLY / Eli Lilly and Company | 0,00 | -67,06 | 0,24 | -68,91 | 1,7783 | -1,2151 | |||
| ADP / Automatic Data Processing, Inc. | 0,00 | -4,88 | 0,23 | -4,20 | 1,6926 | 0,7700 | |||
| ABT / Abbott Laboratories | 0,00 | 0,23 | 1,6672 | 1,6672 | |||||
| ETN / Eaton Corporation plc | 0,00 | -42,62 | 0,22 | -24,83 | 1,6658 | 0,5088 | |||
| MA / Mastercard Incorporated | 0,00 | -52,86 | 0,22 | -51,66 | 1,6149 | -0,1337 | |||
| AXP / American Express Company | 0,00 | -20,75 | 0,21 | -6,14 | 1,5876 | 0,7033 | |||
| ACN / Accenture plc | 0,00 | -51,82 | 0,20 | -53,90 | 1,4921 | -0,2001 | |||
| CSCO / Cisco Systems, Inc. | 0,00 | -23,73 | 0,19 | -14,35 | 1,4167 | 0,5520 | |||
| DIS / The Walt Disney Company | 0,00 | -57,75 | 0,17 | -46,96 | 1,2326 | 0,0175 | |||
| NOW / ServiceNow, Inc. | 0,00 | -49,00 | 0,16 | -34,03 | 1,1650 | 0,2392 | |||
| SPGI / S&P Global Inc. | 0,00 | -73,25 | 0,16 | -72,32 | 1,1521 | -1,0203 | |||
| BLK / BlackRock, Inc. | 0,00 | 0,14 | 1,0725 | 1,0725 | |||||
| PGR / The Progressive Corporation | 0,00 | -53,46 | 0,14 | -56,27 | 1,0634 | -0,2048 | |||
| INTU / Intuit Inc. | 0,00 | -36,92 | 0,14 | -19,30 | 1,0267 | 0,3627 | |||
| CTAS / Cintas Corporation | 0,00 | 156,96 | 0,14 | 181,25 | 1,0053 | 0,8165 | |||
| CRM / Salesforce, Inc. | 0,00 | -46,04 | 0,14 | -45,34 | 1,0038 | 0,0457 | |||
| DE / Deere & Company | 0,00 | -33,96 | 0,12 | -28,74 | 0,9227 | 0,2477 | |||
| ECL / Ecolab Inc. | 0,00 | -40,62 | 0,12 | -37,06 | 0,9220 | 0,1574 | |||
| MET / MetLife, Inc. | 0,00 | -62,31 | 0,12 | -62,38 | 0,8702 | -0,3361 | |||
| PLD / Prologis, Inc. | 0,00 | -30,18 | 0,11 | -34,50 | 0,8323 | 0,1689 | |||
| EXC / Exelon Corporation | 0,00 | 0,11 | 0,8040 | 0,8040 | |||||
| HD / The Home Depot, Inc. | 0,00 | -68,09 | 0,11 | -68,06 | 0,7929 | -0,5069 | |||
| SCHW / The Charles Schwab Corporation | 0,00 | -49,47 | 0,10 | -41,42 | 0,7407 | 0,0825 | |||
| PEG / Public Service Enterprise Group Incorporated | 0,00 | 0,10 | 0,7295 | 0,7295 | |||||
| TT / Trane Technologies plc | 0,00 | -61,11 | 0,10 | -50,00 | 0,7257 | -0,0266 | |||
| EBAY / eBay Inc. | 0,00 | -18,88 | 0,10 | -11,01 | 0,7203 | 0,2976 | |||
| ADSK / Autodesk, Inc. | 0,00 | -7,01 | 0,09 | 10,59 | 0,6993 | 0,3665 | |||
| PANW / Palo Alto Networks, Inc. | 0,00 | 97,74 | 0,09 | 140,54 | 0,6624 | 0,5162 | |||
| GIS / General Mills, Inc. | 0,00 | -56,26 | 0,09 | -61,97 | 0,6593 | -0,2511 | |||
| CBRE / CBRE Group, Inc. | 0,00 | -57,41 | 0,09 | -54,45 | 0,6476 | -0,0951 | |||
| DRI / Darden Restaurants, Inc. | 0,00 | -20,12 | 0,09 | -16,35 | 0,6474 | 0,2431 | |||
| CFG / Citizens Financial Group, Inc. | 0,00 | -41,80 | 0,08 | -36,84 | 0,6281 | 0,1110 | |||
| ICE / Intercontinental Exchange, Inc. | 0,00 | -74,53 | 0,08 | -73,05 | 0,6197 | -0,5772 | |||
| MRK / Merck & Co., Inc. | 0,00 | -78,81 | 0,08 | -81,45 | 0,6121 | -1,1022 | |||
| PNC / The PNC Financial Services Group, Inc. | 0,00 | 0,08 | 0,6061 | 0,6061 | |||||
| HPQ / HP Inc. | 0,00 | 58,58 | 0,08 | 40,35 | 0,5993 | 0,3754 | |||
| GM / General Motors Company | 0,00 | -67,65 | 0,08 | -66,10 | 0,5941 | -0,3243 | |||
| EMR / Emerson Electric Co. | 0,00 | -42,16 | 0,08 | -29,73 | 0,5826 | 0,1491 | |||
| NDAQ / Nasdaq, Inc. | 0,00 | -38,66 | 0,08 | -27,78 | 0,5802 | 0,1603 | |||
| CSGP / CoStar Group, Inc. | 0,00 | 235,17 | 0,08 | 254,55 | 0,5788 | 0,4898 | |||
| AMAT / Applied Materials, Inc. | 0,00 | -59,65 | 0,08 | -49,33 | 0,5668 | -0,0160 | |||
| LRCX / Lam Research Corporation | 0,00 | 40,57 | 0,08 | 90,00 | 0,5645 | 0,4075 | |||
| URI / United Rentals, Inc. | 0,00 | -55,36 | 0,08 | -46,43 | 0,5580 | 0,0139 | |||
| ED / Consolidated Edison, Inc. | 0,00 | -48,99 | 0,07 | -53,80 | 0,5433 | -0,0710 | |||
| CRH / CRH plc | 0,00 | 109,52 | 0,07 | 118,18 | 0,5385 | 0,4096 | |||
| VRTX / Vertex Pharmaceuticals Incorporated | 0,00 | 42,98 | 0,07 | 30,91 | 0,5375 | 0,3232 | |||
| ROK / Rockwell Automation, Inc. | 0,00 | -27,81 | 0,07 | -7,69 | 0,5363 | 0,2339 | |||
| QCOM / QUALCOMM Incorporated | 0,00 | -11,75 | 0,07 | -9,09 | 0,5226 | 0,2236 | |||
| TJX / The TJX Companies, Inc. | 0,00 | -38,52 | 0,07 | -38,10 | 0,4875 | 0,0782 | |||
| OMC / Omnicom Group Inc. | 0,00 | -49,57 | 0,06 | -56,64 | 0,4646 | -0,0910 | |||
| PRU / Prudential Financial, Inc. | 0,00 | -65,76 | 0,06 | -67,38 | 0,4584 | -0,2698 | |||
| AMD / Advanced Micro Devices, Inc. | 0,00 | -57,87 | 0,06 | -42,45 | 0,4582 | 0,0461 | |||
| AMT / American Tower Corporation | 0,00 | -69,60 | 0,06 | -69,04 | 0,4518 | -0,3141 | |||
| TGT / Target Corporation | 0,00 | -40,12 | 0,06 | -43,93 | 0,4516 | 0,0341 | |||
| HPE / Hewlett Packard Enterprise Company | 0,00 | -60,28 | 0,06 | -47,27 | 0,4324 | 0,0025 | |||
| ES / Eversource Energy | 0,00 | -68,41 | 0,06 | -67,78 | 0,4316 | -0,2666 | |||
| MU / Micron Technology, Inc. | 0,00 | -52,76 | 0,06 | -33,33 | 0,4217 | 0,0923 | |||
| JLL / Jones Lang LaSalle Incorporated | 0,00 | -52,62 | 0,06 | -51,33 | 0,4111 | -0,0290 | |||
| ADI / Analog Devices, Inc. | 0,00 | 0,06 | 0,4108 | 0,4108 | |||||
| MOS / The Mosaic Company | 0,00 | -50,45 | 0,05 | -33,33 | 0,4039 | 0,0881 | |||
| STLD / Steel Dynamics, Inc. | 0,00 | 0,05 | 0,4039 | 0,4039 | |||||
| ADBE / Adobe Inc. | 0,00 | -60,34 | 0,05 | -60,00 | 0,4012 | -0,1236 | |||
| MKC / McCormick & Company, Incorporated | 0,00 | -44,03 | 0,05 | -48,54 | 0,3948 | -0,0059 | |||
| NTRS / Northern Trust Corporation | 0,00 | 0,05 | 0,3888 | 0,3888 | |||||
| PODD / Insulet Corporation | 0,00 | 97,62 | 0,05 | 136,36 | 0,3863 | 0,3008 | |||
| EA / Electronic Arts Inc. | 0,00 | 86,71 | 0,05 | 104,00 | 0,3821 | 0,2851 | |||
| TPR / Tapestry, Inc. | 0,00 | -38,49 | 0,05 | -22,73 | 0,3805 | 0,1209 | |||
| RL / Ralph Lauren Corporation | 0,00 | 65,49 | 0,05 | 112,50 | 0,3799 | 0,2832 | |||
| CIEN / Ciena Corporation | 0,00 | 186,30 | 0,05 | 284,62 | 0,3777 | 0,3264 | |||
| TWLO / Twilio Inc. | 0,00 | 22,36 | 0,05 | 56,25 | 0,3730 | 0,2474 | |||
| TXN / Texas Instruments Incorporated | 0,00 | -63,08 | 0,05 | -57,76 | 0,3691 | -0,0837 | |||
| AMGN / Amgen Inc. | 0,00 | -74,67 | 0,05 | -77,67 | 0,3619 | -0,4726 | |||
| SNPS / Synopsys, Inc. | 0,00 | -17,39 | 0,05 | -2,04 | 0,3607 | 0,1696 | |||
| PFE / Pfizer Inc. | 0,00 | -29,51 | 0,05 | -32,39 | 0,3573 | 0,0800 | |||
| EL / The Estée Lauder Companies Inc. | 0,00 | -36,16 | 0,05 | -21,31 | 0,3561 | 0,1176 | |||
| CDNS / Cadence Design Systems, Inc. | 0,00 | -60,86 | 0,05 | -53,00 | 0,3538 | -0,0366 | |||
| WAB / Westinghouse Air Brake Technologies Corporation | 0,00 | 0,05 | 0,3504 | 0,3504 | |||||
| ULTA / Ulta Beauty, Inc. | 0,00 | -53,30 | 0,05 | -40,26 | 0,3430 | 0,0418 | |||
| ALNY / Alnylam Pharmaceuticals, Inc. | 0,00 | -48,12 | 0,04 | -36,62 | 0,3333 | 0,0549 | |||
| BBY / Best Buy Co., Inc. | 0,00 | -9,82 | 0,04 | -16,98 | 0,3287 | 0,1195 | |||
| STT / State Street Corporation | 0,00 | -65,51 | 0,04 | -59,05 | 0,3214 | -0,0892 | |||
| IPG / The Interpublic Group of Companies, Inc. | 0,00 | -27,54 | 0,04 | -33,85 | 0,3188 | 0,0633 | |||
| IR / Ingersoll Rand Inc. | 0,00 | 0,04 | 0,3136 | 0,3136 | |||||
| AON / Aon plc | 0,00 | 0,04 | 0,3118 | 0,3118 | |||||
| LULU / lululemon athletica inc. | 0,00 | -42,16 | 0,04 | -51,16 | 0,3115 | -0,0243 | |||
| GILD / Gilead Sciences, Inc. | 0,00 | -64,60 | 0,04 | -65,22 | 0,3006 | -0,1486 | |||
| CPRT / Copart, Inc. | 0,00 | 405,19 | 0,04 | 375,00 | 0,2828 | 0,2490 | |||
| RBA / RB Global, Inc. | 0,00 | 0,04 | 0,2784 | 0,2784 | |||||
| WSM / Williams-Sonoma, Inc. | 0,00 | -46,39 | 0,04 | -44,78 | 0,2783 | 0,0154 | |||
| NUE / Nucor Corporation | 0,00 | -75,64 | 0,04 | -74,29 | 0,2734 | -0,2723 | |||
| TFC / Truist Financial Corporation | 0,00 | -80,43 | 0,04 | -79,89 | 0,2636 | -0,4114 | |||
| EQR / Equity Residential | 0,00 | -22,95 | 0,04 | -27,08 | 0,2634 | 0,0736 | |||
| GPC / Genuine Parts Company | 0,00 | 46,73 | 0,04 | 52,17 | 0,2624 | 0,1705 | |||
| BMY / Bristol-Myers Squibb Company | 0,00 | -60,63 | 0,04 | -70,34 | 0,2623 | -0,1971 | |||
| VRSN / VeriSign, Inc. | 0,00 | 6,09 | 0,04 | 20,69 | 0,2610 | 0,1478 | |||
| HUM / Humana Inc. | 0,00 | -67,49 | 0,04 | -70,09 | 0,2608 | -0,1936 | |||
| DHR / Danaher Corporation | 0,00 | -56,80 | 0,04 | -58,33 | 0,2604 | -0,0670 | |||
| PYPL / PayPal Holdings, Inc. | 0,00 | -55,82 | 0,03 | -50,00 | 0,2571 | -0,0103 | |||
| TEAM / Atlassian Corporation | 0,00 | 0,03 | 0,2497 | 0,2497 | |||||
| BFAM / Bright Horizons Family Solutions Inc. | 0,00 | -49,44 | 0,03 | -51,47 | 0,2490 | -0,0159 | |||
| INTC / Intel Corporation | 0,00 | -47,99 | 0,03 | -49,23 | 0,2485 | -0,0050 | |||
| LIN / Linde plc | 0,00 | -81,93 | 0,03 | -81,87 | 0,2467 | -0,4626 | |||
| GWRE / Guidewire Software, Inc. | 0,00 | 0,03 | 0,2441 | 0,2441 | |||||
| REGN / Regeneron Pharmaceuticals, Inc. | 0,00 | 67,57 | 0,03 | 39,13 | 0,2411 | 0,1501 | |||
| CNM / Core & Main, Inc. | 0,00 | -41,87 | 0,03 | -27,27 | 0,2396 | 0,0669 | |||
| USFD / US Foods Holding Corp. | 0,00 | 0,03 | 0,2287 | 0,2287 | |||||
| PLNT / Planet Fitness, Inc. | 0,00 | 7,42 | 0,03 | 20,83 | 0,2221 | 0,1262 | |||
| FERG / Ferguson Enterprises Inc. | 0,00 | -79,70 | 0,03 | -72,38 | 0,2161 | -0,1938 | |||
| HIG / The Hartford Insurance Group, Inc. | 0,00 | -55,62 | 0,03 | -53,97 | 0,2152 | -0,0323 | |||
| DELL / Dell Technologies Inc. | 0,00 | -39,18 | 0,03 | -20,00 | 0,2143 | 0,0772 | |||
| LOW / Lowe's Companies, Inc. | 0,00 | -83,57 | 0,03 | -84,53 | 0,2103 | -0,4939 | |||
| NKE / NIKE, Inc. | 0,00 | -57,64 | 0,03 | -53,45 | 0,2057 | -0,0214 | |||
| SJM / The J. M. Smucker Company | 0,00 | -72,45 | 0,03 | -77,31 | 0,2022 | -0,2609 | |||
| AWK / American Water Works Company, Inc. | 0,00 | -86,15 | 0,03 | -86,96 | 0,2009 | -0,6042 | |||
| AKAM / Akamai Technologies, Inc. | 0,00 | -23,90 | 0,03 | -23,53 | 0,1938 | 0,0593 | |||
| SHW / The Sherwin-Williams Company | 0,00 | -82,65 | 0,03 | -82,89 | 0,1933 | -0,3996 | |||
| MTN / Vail Resorts, Inc. | 0,00 | -53,67 | 0,03 | -55,36 | 0,1909 | -0,0287 | |||
| UTHR / United Therapeutics Corporation | 0,00 | 0,03 | 0,1894 | 0,1894 | |||||
| SCI / Service Corporation International | 0,00 | -49,59 | 0,02 | -50,00 | 0,1845 | -0,0042 | |||
| RJF / Raymond James Financial, Inc. | 0,00 | 0,02 | 0,1829 | 0,1829 | |||||
| WCC / WESCO International, Inc. | 0,00 | 0,02 | 0,1742 | 0,1742 | |||||
| EW / Edwards Lifesciences Corporation | 0,00 | -76,97 | 0,02 | -75,28 | 0,1639 | -0,1814 | |||
| NBIX / Neurocrine Biosciences, Inc. | 0,00 | 0,02 | 0,1592 | 0,1592 | |||||
| RMD / ResMed Inc. | 0,00 | -82,93 | 0,02 | -80,39 | 0,1491 | -0,2475 | |||
| VRSK / Verisk Analytics, Inc. | 0,00 | -94,66 | 0,02 | -94,59 | 0,1454 | -1,2160 | |||
| LITE / Lumentum Holdings Inc. | 0,00 | 33,99 | 0,02 | 111,11 | 0,1443 | 0,1074 | |||
| DECK / Deckers Outdoor Corporation | 0,00 | -43,93 | 0,02 | -48,57 | 0,1374 | -0,0017 | |||
| DVA / DaVita Inc. | 0,00 | -57,28 | 0,02 | -60,87 | 0,1361 | -0,0430 | |||
| DAR / Darling Ingredients Inc. | 0,00 | -70,49 | 0,02 | -65,31 | 0,1324 | -0,0609 | |||
| VTR / Ventas, Inc. | 0,00 | -55,18 | 0,02 | -60,98 | 0,1254 | -0,0340 | |||
| WDAY / Workday, Inc. | 0,00 | -75,96 | 0,02 | -76,12 | 0,1227 | -0,1371 | |||
| NEE / NextEra Energy, Inc. | 0,00 | -41,98 | 0,02 | -42,86 | 0,1208 | 0,0095 | |||
| TSCO / Tractor Supply Company | 0,00 | -78,53 | 0,02 | -79,49 | 0,1196 | -0,1848 | |||
| US61747C7074 / Morgan Stanley Institutional Liquidity Funds Government Portfolio, Institutional Class | 0,02 | -21,24 | 0,02 | -25,00 | 0,1169 | 0,0392 | |||
| FMC / FMC Corporation | 0,00 | -58,91 | 0,02 | -59,46 | 0,1141 | -0,0328 | |||
| DKS / DICK'S Sporting Goods, Inc. | 0,00 | -7,23 | 0,02 | -6,25 | 0,1128 | 0,0480 | |||
| GAP / The Gap, Inc. | 0,00 | -53,17 | 0,01 | -51,72 | 0,1086 | -0,0061 | |||
| ESTC / Elastic N.V. | 0,00 | 0,01 | 0,1056 | 0,1056 | |||||
| G / Genpact Limited | 0,00 | -52,46 | 0,01 | -57,58 | 0,1040 | -0,0271 | |||
| FITB / Fifth Third Bancorp | 0,00 | -84,91 | 0,01 | -85,00 | 0,0944 | -0,2177 | |||
| ETSY / Etsy, Inc. | 0,00 | 64,94 | 0,01 | 71,43 | 0,0944 | 0,0662 | |||
| TRV / The Travelers Companies, Inc. | 0,00 | -94,39 | 0,01 | -94,69 | 0,0872 | -0,7175 | |||
| XYL / Xylem Inc. | 0,00 | -72,61 | 0,01 | -70,27 | 0,0824 | -0,0630 | |||
| JBHT / J.B. Hunt Transport Services, Inc. | 0,00 | 0,01 | 0,0819 | 0,0819 | |||||
| BALL / Ball Corporation | 0,00 | -89,47 | 0,01 | -89,25 | 0,0785 | -0,2838 | |||
| LKQ / LKQ Corporation | 0,00 | 0,01 | 0,0746 | 0,0746 | |||||
| KLAC / KLA Corporation | 0,00 | -86,42 | 0,01 | -83,64 | 0,0730 | -0,1405 | |||
| RKT / Rocket Companies, Inc. | 0,00 | -47,17 | 0,01 | -35,71 | 0,0687 | 0,0108 | |||
| RGEN / Repligen Corporation | 0,00 | 0,01 | 0,0599 | 0,0599 | |||||
| SWK / Stanley Black & Decker, Inc. | 0,00 | -64,43 | 0,01 | -68,18 | 0,0532 | -0,0356 | |||
| HXL / Hexcel Corporation | 0,00 | -29,59 | 0,01 | -33,33 | 0,0498 | 0,0139 | |||
| LAD / Lithia Motors, Inc. | 0,00 | 0,01 | 0,0475 | 0,0475 | |||||
| RRX / Regal Rexnord Corporation | 0,00 | 0,01 | 0,0440 | 0,0440 | |||||
| MRNA / Moderna, Inc. | 0,00 | 31,25 | 0,01 | 25,00 | 0,0429 | 0,0253 | |||
| FSLR / First Solar, Inc. | 0,00 | -48,00 | 0,00 | -33,33 | 0,0319 | 0,0074 | |||
| EXAS / Exact Sciences Corporation | 0,00 | -84,54 | 0,00 | -81,82 | 0,0319 | -0,0560 | |||
| EXPD / Expeditors International of Washington, Inc. | 0,00 | -92,77 | 0,00 | -93,44 | 0,0313 | -0,2073 | |||
| Aptiv plc / EC (JE00BTDN8H13) | 0,00 | 0,00 | 0,0293 | 0,0293 | |||||
| SNOW / Snowflake Inc. | 0,00 | -100,00 | 0,00 | -100,00 | -0,1184 |