Grundlæggende statistik
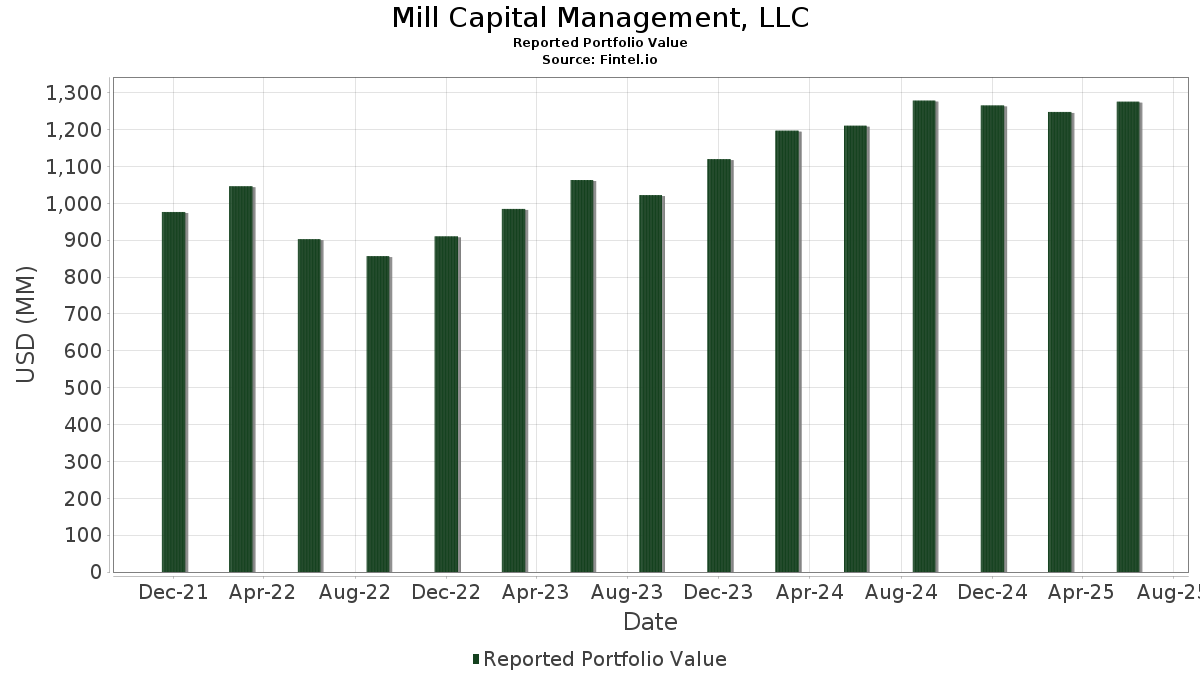
| Porteføljeværdi | $ 1.275.738.845 |
| Nuværende stillinger | 120 |
Seneste beholdninger, ydeevne, AUM (fra 13F, 13D)
Mill Capital Management, LLC har afsløret 120 samlede besiddelser i deres seneste SEC-arkivering. Den seneste porteføljeværdi er beregnet til at være $ 1.275.738.845 USD. Faktiske aktiver under forvaltning (AUM) er denne værdi plus kontanter (som ikke er oplyst). Mill Capital Management, LLCs største beholdninger er Apple Inc. (US:AAPL) , Microsoft Corporation (US:MSFT) , Berkshire Hathaway Inc. (US:BRK.A) , Visa Inc. (US:V) , and Alphabet Inc. (US:GOOG) . Mill Capital Management, LLCs nye stillinger omfatter SPDR Series Trust - SPDR Portfolio Aggregate Bond ETF (US:SPAB) , .
Top øger dette kvartal
Vi bruger ændringen i porteføljeallokeringen, fordi dette er den mest meningsfulde metrik. Ændringer kan skyldes handler eller ændringer i aktiekurser.
| Sikkerhed | Aktier (MM) |
Værdi (MM$) |
Portefølje % | ΔPortefølje % |
|---|---|---|---|---|
| 0,21 | 102,25 | 8,0153 | 1,6184 | |
| 0,20 | 59,18 | 4,6390 | 0,5464 | |
| 0,38 | 67,36 | 5,2798 | 0,5262 | |
| 0,01 | 32,74 | 2,5662 | 0,4777 | |
| 0,16 | 19,76 | 1,5490 | 0,4354 | |
| 0,13 | 39,99 | 3,1349 | 0,4335 | |
| 0,19 | 41,73 | 3,2714 | 0,3954 | |
| 0,03 | 39,70 | 3,1119 | 0,2092 | |
| 0,02 | 14,34 | 1,1244 | 0,1859 | |
| 0,06 | 15,48 | 1,2136 | 0,1838 |
Top falder i dette kvartal
Vi bruger ændringen i porteføljeallokeringen, fordi dette er den mest meningsfulde metrik. Ændringer kan skyldes handler eller ændringer i aktiekurser.
| Sikkerhed | Aktier (MM) |
Værdi (MM$) |
Portefølje % | ΔPortefølje % |
|---|---|---|---|---|
| 0,00 | 87,46 | 6,8553 | -0,9508 | |
| 0,54 | 110,66 | 8,6742 | -0,9042 | |
| 0,05 | 15,69 | 1,2302 | -0,7742 | |
| 0,08 | 32,24 | 2,5271 | -0,6243 | |
| 0,14 | 23,45 | 1,8379 | -0,5638 | |
| 0,08 | 37,16 | 2,9126 | -0,4087 | |
| 0,36 | 39,16 | 3,0694 | -0,3852 | |
| 0,44 | 21,62 | 1,6951 | -0,2962 | |
| 0,20 | 69,90 | 5,4794 | -0,2014 | |
| 0,60 | 21,29 | 1,6691 | -0,1482 |
13F og Fondsarkivering
Denne formular blev indsendt den 2025-08-04 for rapporteringsperioden 2025-06-30. Klik på linkikonet for at se den fulde transaktionshistorik.
Opgrader for at låse op for premium-data og eksportere til Excel ![]() .
.
| Sikkerhed | Type | Gennemsnitlig aktiekurs | Aktier (MM) |
Δ Aktier (%) |
Δ Aktier (%) |
Værdi ($MM) |
Portefølje (%) |
ΔPortefølje (%) |
|
|---|---|---|---|---|---|---|---|---|---|
| AAPL / Apple Inc. | 0,54 | 0,24 | 110,66 | -7,42 | 8,6742 | -0,9042 | |||
| MSFT / Microsoft Corporation | 0,21 | -3,32 | 102,25 | 28,10 | 8,0153 | 1,6184 | |||
| BRK.A / Berkshire Hathaway Inc. | 0,00 | -1,64 | 87,46 | -10,22 | 6,8553 | -0,9508 | |||
| V / Visa Inc. | 0,20 | -2,66 | 69,90 | -1,39 | 5,4794 | -0,2014 | |||
| GOOG / Alphabet Inc. | 0,38 | 0,01 | 67,36 | 13,55 | 5,2798 | 0,5262 | |||
| JPM / JPMorgan Chase & Co. | 0,20 | -1,95 | 59,18 | 15,88 | 4,6390 | 0,5464 | |||
| AMZN / Amazon.com, Inc. | 0,19 | 0,85 | 41,73 | 16,29 | 3,2714 | 0,3954 | |||
| AXP / American Express Company | 0,13 | 0,07 | 39,99 | 18,64 | 3,1349 | 0,4335 | |||
| TDG / TransDigm Group Incorporated | 0,03 | -0,30 | 39,70 | 9,60 | 3,1119 | 0,2092 | |||
| XOM / Exxon Mobil Corporation | 0,36 | 0,21 | 39,16 | -9,17 | 3,0694 | -0,3852 | |||
| BRK.B / Berkshire Hathaway Inc. | 0,08 | -1,71 | 37,16 | -10,35 | 2,9126 | -0,4087 | |||
| BKNG / Booking Holdings Inc. | 0,01 | -0,04 | 32,74 | 25,62 | 2,5662 | 0,4777 | |||
| TMO / Thermo Fisher Scientific Inc. | 0,08 | 0,61 | 32,24 | -18,02 | 2,5271 | -0,6243 | |||
| UNP / Union Pacific Corporation | 0,13 | 0,52 | 29,78 | -2,10 | 2,3343 | -0,1033 | |||
| AMT / American Tower Corporation | 0,12 | 0,46 | 26,98 | 2,03 | 2,1148 | -0,0041 | |||
| ICE / Intercontinental Exchange, Inc. | 0,14 | 0,35 | 25,86 | 6,74 | 2,0272 | 0,0855 | |||
| FI / Fiserv, Inc. | 0,14 | 0,21 | 23,45 | -21,77 | 1,8379 | -0,5638 | |||
| CPRT / Copart, Inc. | 0,44 | 0,36 | 21,62 | -12,97 | 1,6951 | -0,2962 | |||
| CMCSA / Comcast Corporation | 0,60 | -2,92 | 21,29 | -6,10 | 1,6691 | -0,1482 | |||
| MU / Micron Technology, Inc. | 0,16 | 0,26 | 19,76 | 42,21 | 1,5490 | 0,4354 | |||
| ZTS / Zoetis Inc. | 0,12 | 0,57 | 19,40 | -4,75 | 1,5211 | -0,1115 | |||
| VRSN / VeriSign, Inc. | 0,07 | 0,27 | 19,22 | 14,07 | 1,5062 | 0,1563 | |||
| LIN / Linde plc | 0,04 | 0,26 | 18,54 | 1,02 | 1,4535 | -0,0174 | |||
| CPAY / Corpay, Inc. | 0,05 | 0,36 | 18,23 | -4,51 | 1,4289 | -0,1008 | |||
| JNJ / Johnson & Johnson | 0,12 | 0,61 | 18,05 | -7,33 | 1,4149 | -0,1461 | |||
| LH / Labcorp Holdings Inc. | 0,06 | 0,41 | 16,70 | 13,25 | 1,3093 | 0,1274 | |||
| UNH / UnitedHealth Group Incorporated | 0,05 | 5,34 | 15,69 | -37,25 | 1,2302 | -0,7742 | |||
| LHX / L3Harris Technologies, Inc. | 0,06 | 0,53 | 15,48 | 20,48 | 1,2136 | 0,1838 | |||
| CRM / Salesforce, Inc. | 0,05 | 1,05 | 14,94 | 2,68 | 1,1709 | 0,0051 | |||
| ASML / ASML Holding N.V. - Depositary Receipt (Common Stock) | 0,02 | 1,27 | 14,34 | 22,48 | 1,1244 | 0,1859 | |||
| GOOGL / Alphabet Inc. | 0,08 | -0,00 | 14,18 | 13,96 | 1,1116 | 0,1144 | |||
| PM / Philip Morris International Inc. | 0,07 | -2,77 | 13,17 | 11,56 | 1,0321 | 0,0863 | |||
| OTIS / Otis Worldwide Corporation | 0,13 | 0,33 | 12,70 | -3,73 | 0,9952 | -0,0617 | |||
| TT / Trane Technologies plc | 0,02 | 0,00 | 7,80 | 29,84 | 0,6113 | 0,1299 | |||
| WFC / Wells Fargo & Company | 0,09 | 0,00 | 6,82 | 11,60 | 0,5348 | 0,0449 | |||
| MRK / Merck & Co., Inc. | 0,08 | -2,32 | 6,70 | -13,86 | 0,5249 | -0,0980 | |||
| PG / The Procter & Gamble Company | 0,04 | 0,00 | 6,00 | -6,50 | 0,4700 | -0,0440 | |||
| GE / General Electric Company | 0,02 | 0,00 | 4,97 | 28,59 | 0,3899 | 0,0799 | |||
| ETN / Eaton Corporation plc | 0,01 | 0,00 | 4,21 | 31,34 | 0,3302 | 0,0732 | |||
| PFE / Pfizer Inc. | 0,17 | -3,04 | 4,14 | -7,25 | 0,3247 | -0,0332 | |||
| CVX / Chevron Corporation | 0,03 | 0,00 | 3,97 | -14,40 | 0,3113 | -0,0605 | |||
| ELV / Elevance Health, Inc. | 0,01 | 0,00 | 3,94 | -10,59 | 0,3092 | -0,0443 | |||
| MDLZ / Mondelez International, Inc. | 0,05 | -4,85 | 3,50 | -5,45 | 0,2746 | -0,0222 | |||
| CAT / Caterpillar Inc. | 0,01 | 0,00 | 3,49 | 17,73 | 0,2738 | 0,0360 | |||
| ORCL / Oracle Corporation | 0,02 | 0,00 | 3,43 | 56,38 | 0,2690 | 0,0931 | |||
| MLM / Martin Marietta Materials, Inc. | 0,01 | 0,00 | 3,42 | 14,82 | 0,2679 | 0,0294 | |||
| LRCX / Lam Research Corporation | 0,04 | 0,00 | 3,41 | 33,88 | 0,2671 | 0,0631 | |||
| DUK / Duke Energy Corporation | 0,03 | 0,02 | 3,07 | -3,25 | 0,2408 | -0,0136 | |||
| HD / The Home Depot, Inc. | 0,01 | 0,00 | 2,69 | 0,04 | 0,2112 | -0,0046 | |||
| KO / The Coca-Cola Company | 0,04 | -1,80 | 2,52 | -3,00 | 0,1979 | -0,0107 | |||
| YUM / Yum! Brands, Inc. | 0,02 | 0,00 | 2,52 | -5,83 | 0,1977 | -0,0169 | |||
| RSG / Republic Services, Inc. | 0,01 | 0,00 | 2,49 | 1,84 | 0,1953 | -0,0008 | |||
| SHEL / Shell plc - Depositary Receipt (Common Stock) | 0,03 | 0,00 | 2,41 | -3,91 | 0,1889 | -0,0121 | |||
| NSC / Norfolk Southern Corporation | 0,01 | -0,47 | 2,34 | 7,59 | 0,1833 | 0,0091 | |||
| GEV / GE Vernova Inc. | 0,00 | -0,27 | 2,32 | 72,88 | 0,1819 | 0,0743 | |||
| BMY / Bristol-Myers Squibb Company | 0,05 | 0,00 | 2,20 | -24,11 | 0,1722 | -0,0598 | |||
| MMM / 3M Company | 0,01 | 0,00 | 2,01 | 3,67 | 0,1573 | 0,0022 | |||
| TXN / Texas Instruments Incorporated | 0,01 | 0,00 | 1,97 | 15,52 | 0,1546 | 0,0178 | |||
| SYK / Stryker Corporation | 0,00 | 0,00 | 1,91 | 6,30 | 0,1494 | 0,0057 | |||
| GSCE / GS Connect S&P GSCI Enhanced Commodity Total Return ETN | 0,00 | -0,35 | 1,80 | 29,07 | 0,1410 | 0,0293 | |||
| COP / ConocoPhillips | 0,02 | 0,00 | 1,69 | -14,54 | 0,1327 | -0,0261 | |||
| EMR / Emerson Electric Co. | 0,01 | 0,00 | 1,68 | 21,68 | 0,1320 | 0,0210 | |||
| NEE / NextEra Energy, Inc. | 0,02 | 0,00 | 1,67 | -2,06 | 0,1306 | -0,0057 | |||
| BAC / Bank of America Corporation | 0,04 | 0,00 | 1,66 | 13,44 | 0,1304 | 0,0128 | |||
| MCD / McDonald's Corporation | 0,01 | 0,00 | 1,50 | -6,49 | 0,1175 | -0,0109 | |||
| DIS / The Walt Disney Company | 0,01 | 0,00 | 1,46 | 25,69 | 0,1147 | 0,0214 | |||
| LLY / Eli Lilly and Company | 0,00 | -0,06 | 1,40 | -5,71 | 0,1101 | -0,0092 | |||
| TJX / The TJX Companies, Inc. | 0,01 | -15,94 | 1,30 | -14,79 | 0,1021 | -0,0204 | |||
| CME / CME Group Inc. | 0,00 | 0,00 | 1,24 | 3,94 | 0,0972 | 0,0016 | |||
| IR / Ingersoll Rand Inc. | 0,01 | 0,00 | 1,24 | 3,87 | 0,0969 | 0,0016 | |||
| MSI / Motorola Solutions, Inc. | 0,00 | 0,00 | 1,22 | -4,00 | 0,0959 | -0,0062 | |||
| IBM / International Business Machines Corporation | 0,00 | 0,00 | 1,21 | 18,57 | 0,0951 | 0,0131 | |||
| LOW / Lowe's Companies, Inc. | 0,01 | 0,00 | 1,12 | -4,83 | 0,0880 | -0,0066 | |||
| FCNCA / First Citizens BancShares, Inc. | 0,00 | 0,00 | 1,03 | 5,55 | 0,0805 | 0,0025 | |||
| L / Loews Corporation | 0,01 | 0,00 | 1,03 | -0,29 | 0,0805 | -0,0020 | |||
| IAU / iShares Gold Trust | 0,02 | 0,00 | 1,01 | 5,74 | 0,0794 | 0,0027 | |||
| BDX / Becton, Dickinson and Company | 0,01 | 0,00 | 0,95 | -24,82 | 0,0748 | -0,0269 | |||
| CB / Chubb Limited | 0,00 | 0,00 | 0,93 | -4,02 | 0,0729 | -0,0048 | |||
| KMB / Kimberly-Clark Corporation | 0,01 | 0,00 | 0,91 | -9,36 | 0,0714 | -0,0091 | |||
| HON / Honeywell International Inc. | 0,00 | 0,00 | 0,88 | 9,98 | 0,0691 | 0,0049 | |||
| ABBV / AbbVie Inc. | 0,00 | 0,00 | 0,81 | -11,44 | 0,0638 | -0,0098 | |||
| IWR / iShares Trust - iShares Russell Mid-Cap ETF | 0,01 | 0,00 | 0,80 | 8,09 | 0,0629 | 0,0034 | |||
| DEO / Diageo plc - Depositary Receipt (Common Stock) | 0,01 | -15,17 | 0,80 | -18,30 | 0,0626 | -0,0158 | |||
| FITB / Fifth Third Bancorp | 0,02 | -4,18 | 0,71 | 0,57 | 0,0554 | -0,0009 | |||
| PEP / PepsiCo, Inc. | 0,01 | -4,08 | 0,70 | -15,50 | 0,0547 | -0,0115 | |||
| SPAB / SPDR Series Trust - SPDR Portfolio Aggregate Bond ETF | 0,03 | 0,65 | 0,0510 | 0,0510 | |||||
| ZBH / Zimmer Biomet Holdings, Inc. | 0,01 | 0,00 | 0,62 | -19,48 | 0,0483 | -0,0130 | |||
| CMI / Cummins Inc. | 0,00 | 0,00 | 0,55 | 4,61 | 0,0427 | 0,0009 | |||
| NVS / Novartis AG - Depositary Receipt (Common Stock) | 0,00 | 0,00 | 0,54 | 8,70 | 0,0421 | 0,0024 | |||
| GEHC / GE HealthCare Technologies Inc. | 0,01 | -0,03 | 0,52 | -8,26 | 0,0410 | -0,0047 | |||
| WEC / WEC Energy Group, Inc. | 0,00 | 0,00 | 0,50 | -4,38 | 0,0394 | -0,0027 | |||
| PSX / Phillips 66 | 0,00 | 0,00 | 0,49 | -3,33 | 0,0388 | -0,0023 | |||
| BP / BP p.l.c. - Depositary Receipt (Common Stock) | 0,02 | 0,00 | 0,49 | -11,31 | 0,0387 | -0,0060 | |||
| AVGO / Broadcom Inc. | 0,00 | 0,00 | 0,48 | 64,51 | 0,0378 | 0,0143 | |||
| EQR / Equity Residential | 0,01 | 0,00 | 0,42 | -5,82 | 0,0331 | -0,0028 | |||
| EBGEF / Enbridge Inc. - Preferred Stock | 0,01 | 0,00 | 0,42 | 2,45 | 0,0328 | 0,0000 | |||
| ORI / Old Republic International Corporation | 0,01 | 0,77 | 0,42 | -1,18 | 0,0327 | -0,0011 | |||
| GRMN / Garmin Ltd. | 0,00 | 0,00 | 0,42 | -3,92 | 0,0327 | -0,0021 | |||
| PNC / The PNC Financial Services Group, Inc. | 0,00 | 0,00 | 0,39 | 6,32 | 0,0303 | 0,0011 | |||
| LNC / Lincoln National Corporation | 0,01 | 0,00 | 0,35 | -3,54 | 0,0278 | -0,0017 | |||
| SPY / SPDR S&P 500 ETF | 0,00 | 11,73 | 0,35 | 23,49 | 0,0272 | 0,0047 | |||
| DD / DuPont de Nemours, Inc. | 0,00 | -6,91 | 0,34 | -14,36 | 0,0267 | -0,0052 | |||
| WMT / Walmart Inc. | 0,00 | 0,00 | 0,34 | 11,26 | 0,0264 | 0,0022 | |||
| YUMC / Yum China Holdings, Inc. | 0,01 | -4,36 | 0,32 | -17,90 | 0,0252 | -0,0062 | |||
| ADP / Automatic Data Processing, Inc. | 0,00 | 0,00 | 0,31 | 0,98 | 0,0242 | -0,0003 | |||
| DGX / Quest Diagnostics Incorporated | 0,00 | 0,00 | 0,29 | 6,20 | 0,0228 | 0,0008 | |||
| RF / Regions Financial Corporation | 0,01 | 0,00 | 0,28 | 8,14 | 0,0219 | 0,0012 | |||
| TRV / The Travelers Companies, Inc. | 0,00 | 0,00 | 0,27 | 1,14 | 0,0210 | -0,0002 | |||
| SUSA / iShares Trust - iShares ESG Optimized MSCI USA ETF | 0,00 | 0,00 | 0,24 | 10,09 | 0,0189 | 0,0014 | |||
| BLK / BlackRock, Inc. | 0,00 | 0,00 | 0,24 | 11,27 | 0,0186 | 0,0014 | |||
| CTVA / Corteva, Inc. | 0,00 | -10,80 | 0,23 | 5,61 | 0,0178 | 0,0006 | |||
| TSLA / Tesla, Inc. | 0,00 | 0,23 | 0,0177 | 0,0177 | |||||
| SSB / SouthState Corporation | 0,00 | 0,00 | 0,22 | -0,88 | 0,0176 | -0,0005 | |||
| ITW / Illinois Tool Works Inc. | 0,00 | 0,00 | 0,21 | -0,47 | 0,0166 | -0,0004 | |||
| MO / Altria Group, Inc. | 0,00 | -51,12 | 0,20 | -52,47 | 0,0159 | -0,0182 | |||
| IVV / iShares Trust - iShares Core S&P 500 ETF | 0,00 | 0,00 | 0,16 | 10,71 | 0,0122 | 0,0009 | |||
| IWF / iShares Trust - iShares Russell 1000 Growth ETF | 0,00 | 0,00 | 0,08 | 16,67 | 0,0067 | 0,0009 | |||
| IJK / iShares Trust - iShares S&P Mid-Cap 400 Growth ETF | 0,00 | -25,00 | 0,08 | -18,18 | 0,0064 | -0,0016 | |||
| IWP / iShares Trust - iShares Russell Mid-Cap Growth ETF | 0,00 | 0,00 | 0,08 | 19,70 | 0,0062 | 0,0008 | |||
| IWM / iShares Trust - iShares Russell 2000 ETF | 0,00 | 0,00 | 0,05 | 9,52 | 0,0036 | 0,0002 | |||
| IJR / iShares Trust - iShares Core S&P Small-Cap ETF | 0,00 | -100,00 | 0,00 | 0,0000 |