Grundlæggende statistik
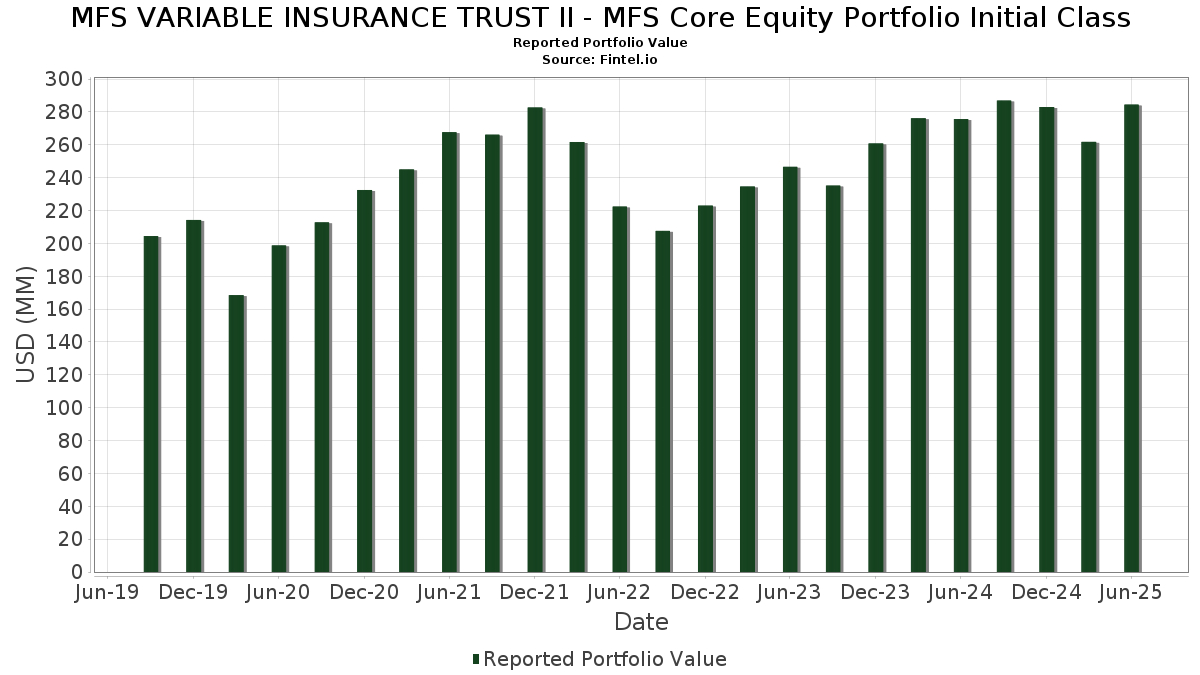
| Porteføljeværdi | $ 284.439.607 |
| Nuværende stillinger | 178 |
Seneste beholdninger, ydeevne, AUM (fra 13F, 13D)
MFS VARIABLE INSURANCE TRUST II - MFS Core Equity Portfolio Initial Class har afsløret 178 samlede besiddelser i deres seneste SEC-arkivering. Den seneste porteføljeværdi er beregnet til at være $ 284.439.607 USD. Faktiske aktiver under forvaltning (AUM) er denne værdi plus kontanter (som ikke er oplyst). MFS VARIABLE INSURANCE TRUST II - MFS Core Equity Portfolio Initial Classs største beholdninger er Microsoft Corporation (US:MSFT) , Amazon.com, Inc. (US:AMZN) , NVIDIA Corporation (US:NVDA) , Meta Platforms, Inc. (US:META) , and Apple Inc. (US:AAPL) . MFS VARIABLE INSURANCE TRUST II - MFS Core Equity Portfolio Initial Classs nye stillinger omfatter KLA Corporation (AT:KLAC) , Vistra Corp. (US:VST) , Tapestry, Inc. (IT:1TPR) , Vertex, Inc. (US:VERX) , and Hancock Whitney Corporation (US:HWC) .
Top øger dette kvartal
Vi bruger ændringen i porteføljeallokeringen, fordi dette er den mest meningsfulde metrik. Ændringer kan skyldes handler eller ændringer i aktiekurser.
| Sikkerhed | Aktier (MM) |
Værdi (MM$) |
Portefølje % | ΔPortefølje % |
|---|---|---|---|---|
| 0,01 | 4,92 | 1,7303 | 1,7303 | |
| 0,04 | 20,58 | 7,2358 | 1,2621 | |
| 0,03 | 8,09 | 2,8457 | 1,1478 | |
| 0,01 | 2,41 | 0,8486 | 0,8486 | |
| 0,00 | 1,75 | 0,6142 | 0,6142 | |
| 0,01 | 9,05 | 3,1826 | 0,4639 | |
| 0,01 | 1,64 | 0,5751 | 0,4565 | |
| 0,01 | 1,14 | 0,4023 | 0,4023 | |
| 0,01 | 1,23 | 0,4310 | 0,2811 | |
| 0,01 | 0,73 | 0,2575 | 0,2575 |
Top falder i dette kvartal
Vi bruger ændringen i porteføljeallokeringen, fordi dette er den mest meningsfulde metrik. Ændringer kan skyldes handler eller ændringer i aktiekurser.
| Sikkerhed | Aktier (MM) |
Værdi (MM$) |
Portefølje % | ΔPortefølje % |
|---|---|---|---|---|
| 0,00 | 1,59 | 0,5582 | -1,3706 | |
| 0,01 | 1,38 | 0,4860 | -0,8754 | |
| 1,68 | 1,68 | 0,5915 | -0,5598 | |
| 0,00 | 1,26 | 0,4429 | -0,4237 | |
| 0,02 | 3,61 | 1,2699 | -0,3315 | |
| 0,01 | 0,90 | 0,3159 | -0,2941 | |
| 0,00 | 0,55 | 0,1919 | -0,2901 | |
| 0,04 | 8,73 | 3,0691 | -0,2850 | |
| 0,04 | 2,69 | 0,9460 | -0,2810 | |
| 0,02 | 1,44 | 0,5056 | -0,2416 |
13F og Fondsarkivering
Denne formular blev indsendt den 2025-08-25 for rapporteringsperioden 2025-06-30. Klik på linkikonet for at se den fulde transaktionshistorik.
Opgrader for at låse op for premium-data og eksportere til Excel ![]() .
.
| Sikkerhed | Type | Gennemsnitlig aktiekurs | Aktier (MM) |
Δ Aktier (%) |
Δ Aktier (%) |
Værdi ($MM) |
Portefølje (%) |
ΔPortefølje (%) |
|
|---|---|---|---|---|---|---|---|---|---|
| MSFT / Microsoft Corporation | 0,04 | -0,73 | 20,58 | 31,54 | 7,2358 | 1,2621 | |||
| AMZN / Amazon.com, Inc. | 0,06 | -0,73 | 13,40 | 14,47 | 4,7101 | 0,2417 | |||
| NVDA / NVIDIA Corporation | 0,07 | -20,93 | 11,40 | 15,26 | 4,0071 | 0,2318 | |||
| META / Meta Platforms, Inc. | 0,01 | -0,73 | 9,05 | 27,14 | 3,1826 | 0,4639 | |||
| AAPL / Apple Inc. | 0,04 | 7,58 | 8,73 | -0,63 | 3,0691 | -0,2850 | |||
| GOOGL / Alphabet Inc. | 0,05 | -0,73 | 8,35 | 13,13 | 2,9363 | 0,1177 | |||
| AVGO / Broadcom Inc. | 0,03 | 639,55 | 8,09 | 82,65 | 2,8457 | 1,1478 | |||
| JPM / JPMorgan Chase & Co. | 0,02 | -0,73 | 6,04 | 17,32 | 2,1247 | 0,1581 | |||
| MA / Mastercard Incorporated | 0,01 | 4,92 | 1,7303 | 1,7303 | |||||
| TRU / TransUnion | 0,05 | 13,33 | 4,41 | 20,18 | 1,5499 | 0,1493 | |||
| JNJ / Johnson & Johnson | 0,03 | 5,08 | 4,27 | -3,22 | 1,5023 | -0,1833 | |||
| ABBV / AbbVie Inc. | 0,02 | -2,80 | 3,61 | -13,88 | 1,2699 | -0,3315 | |||
| PFE / Pfizer Inc. | 0,13 | 35,84 | 3,27 | 29,93 | 1,1496 | 0,1889 | |||
| HD / The Home Depot, Inc. | 0,01 | -0,73 | 3,14 | -0,70 | 1,1039 | -0,1032 | |||
| CDNS / Cadence Design Systems, Inc. | 0,01 | -0,73 | 3,09 | 20,27 | 1,0848 | 0,1053 | |||
| CDW / CDW Corporation | 0,02 | 6,91 | 3,04 | 19,13 | 1,0688 | 0,0946 | |||
| CRM / Salesforce, Inc. | 0,01 | -0,73 | 2,91 | 0,87 | 1,0225 | -0,0782 | |||
| SPOT / Spotify Technology S.A. | 0,00 | -0,72 | 2,85 | 38,51 | 1,0029 | 0,2166 | |||
| LRCX / Lam Research Corporation | 0,03 | -0,73 | 2,83 | 32,96 | 0,9944 | 0,1819 | |||
| BKNG / Booking Holdings Inc. | 0,00 | -0,63 | 2,73 | 24,87 | 0,9588 | 0,1250 | |||
| XOM / Exxon Mobil Corporation | 0,03 | 11,93 | 2,72 | 1,45 | 0,9574 | -0,0674 | |||
| TNET / TriNet Group, Inc. | 0,04 | -9,29 | 2,69 | -16,28 | 0,9460 | -0,2810 | |||
| CI / The Cigna Group | 0,01 | -0,73 | 2,47 | -0,24 | 0,8699 | -0,0772 | |||
| MDT / Medtronic plc | 0,03 | -0,73 | 2,47 | -3,67 | 0,8685 | -0,1109 | |||
| AMT / American Tower Corporation | 0,01 | 2,41 | 0,8486 | 0,8486 | |||||
| BJ / BJ's Wholesale Club Holdings, Inc. | 0,02 | -0,73 | 2,33 | -6,20 | 0,8196 | -0,1291 | |||
| AON / Aon plc | 0,01 | -0,74 | 2,31 | -11,25 | 0,8128 | -0,1819 | |||
| ETN / Eaton Corporation plc | 0,01 | -0,73 | 2,13 | 30,44 | 0,7504 | 0,1253 | |||
| WAT / Waters Corporation | 0,01 | 2,37 | 2,01 | -3,09 | 0,7057 | -0,0848 | |||
| VRTX / Vertex Pharmaceuticals Incorporated | 0,00 | -4,87 | 2,00 | -12,67 | 0,7029 | -0,1709 | |||
| BSX / Boston Scientific Corporation | 0,02 | -3,34 | 2,00 | 2,94 | 0,7015 | -0,0387 | |||
| WFC / Wells Fargo & Company | 0,02 | -1,58 | 2,00 | 9,86 | 0,7015 | 0,0080 | |||
| PM / Philip Morris International Inc. | 0,01 | -0,73 | 1,97 | 13,95 | 0,6920 | 0,0322 | |||
| CB / Chubb Limited | 0,01 | -0,73 | 1,92 | -4,80 | 0,6761 | -0,0949 | |||
| GE / General Electric Company | 0,01 | -9,64 | 1,90 | 16,22 | 0,6679 | 0,0437 | |||
| KKR / KKR & Co. Inc. | 0,01 | 6,95 | 1,86 | 23,02 | 0,6543 | 0,0769 | |||
| DIS / The Walt Disney Company | 0,01 | -0,73 | 1,86 | 24,75 | 0,6541 | 0,0846 | |||
| MS / Morgan Stanley | 0,01 | -0,73 | 1,86 | 19,87 | 0,6533 | 0,0614 | |||
| ADI / Analog Devices, Inc. | 0,01 | -14,03 | 1,82 | 1,45 | 0,6401 | -0,0450 | |||
| APH / Amphenol Corporation | 0,02 | -0,73 | 1,78 | 49,54 | 0,6243 | 0,1707 | |||
| BDX / Becton, Dickinson and Company | 0,01 | 16,68 | 1,76 | -12,29 | 0,6198 | -0,1473 | |||
| KLAC / KLA Corporation | 0,00 | 1,75 | 0,6142 | 0,6142 | |||||
| LNG / Cheniere Energy, Inc. | 0,01 | -0,73 | 1,75 | 4,49 | 0,6139 | -0,0243 | |||
| EMR / Emerson Electric Co. | 0,01 | 16,58 | 1,70 | 41,80 | 0,5991 | 0,1402 | |||
| TEAM / Atlassian Corporation | 0,01 | -0,73 | 1,69 | -4,96 | 0,5933 | -0,0849 | |||
| US55291X1090 / MFS Institutional Money Market Portfolio | 1,68 | -44,21 | 1,68 | -44,21 | 0,5915 | -0,5598 | |||
| MCK / McKesson Corporation | 0,00 | -12,00 | 1,68 | -4,17 | 0,5895 | -0,0786 | |||
| AJG / Arthur J. Gallagher & Co. | 0,01 | -0,72 | 1,67 | -7,96 | 0,5859 | -0,1053 | |||
| NSIT / Insight Enterprises, Inc. | 0,01 | 10,90 | 1,64 | 2,12 | 0,5754 | -0,0366 | |||
| RTX / RTX Corporation | 0,01 | 186,25 | 1,64 | 481,85 | 0,5751 | 0,4565 | |||
| PEP / PepsiCo, Inc. | 0,01 | -0,73 | 1,64 | -12,57 | 0,5749 | -0,1393 | |||
| PNC / The PNC Financial Services Group, Inc. | 0,01 | -8,27 | 1,61 | -2,72 | 0,5657 | -0,0657 | |||
| V / Visa Inc. | 0,00 | -68,98 | 1,59 | -68,58 | 0,5582 | -1,3706 | |||
| HWM / Howmet Aerospace Inc. | 0,01 | -4,47 | 1,59 | 37,08 | 0,5579 | 0,1159 | |||
| ARMK / Aramark | 0,04 | -0,73 | 1,47 | 20,42 | 0,5186 | 0,0509 | |||
| CRH / CRH plc | 0,02 | 8,87 | 1,47 | 13,58 | 0,5178 | 0,0229 | |||
| COP / ConocoPhillips | 0,02 | -14,01 | 1,44 | -26,53 | 0,5056 | -0,2416 | |||
| CME / CME Group Inc. | 0,01 | -0,73 | 1,43 | 3,11 | 0,5017 | -0,0266 | |||
| Aptiv PLC / EC (JE00BTDN8H13) | 0,02 | -11,78 | 1,40 | 1,16 | 0,4913 | -0,0362 | |||
| TMUS / T-Mobile US, Inc. | 0,01 | -56,61 | 1,38 | -61,23 | 0,4860 | -0,8754 | |||
| MCO / Moody's Corporation | 0,00 | -0,74 | 1,34 | 6,87 | 0,4707 | -0,0074 | |||
| MDLZ / Mondelez International, Inc. | 0,02 | -0,73 | 1,32 | -1,35 | 0,4634 | -0,0466 | |||
| TT / Trane Technologies plc | 0,00 | -0,73 | 1,31 | 28,85 | 0,4619 | 0,0727 | |||
| HLT / Hilton Worldwide Holdings Inc. | 0,00 | -0,74 | 1,29 | 16,19 | 0,4543 | 0,0297 | |||
| TSLA / Tesla, Inc. | 0,00 | -54,72 | 1,26 | -44,51 | 0,4429 | -0,4237 | |||
| NXPI / NXP Semiconductors N.V. | 0,01 | -0,73 | 1,26 | 14,19 | 0,4413 | 0,0214 | |||
| APG / APi Group Corporation | 0,02 | 37,66 | 1,24 | 96,68 | 0,4373 | 0,1957 | |||
| J / Jacobs Solutions Inc. | 0,01 | 187,10 | 1,23 | 212,50 | 0,4310 | 0,2811 | |||
| WAB / Westinghouse Air Brake Technologies Corporation | 0,01 | -0,72 | 1,21 | 14,53 | 0,4244 | 0,0223 | |||
| SCHW / The Charles Schwab Corporation | 0,01 | -0,73 | 1,20 | 15,72 | 0,4221 | 0,0259 | |||
| LDOS / Leidos Holdings, Inc. | 0,01 | 22,59 | 1,20 | 43,35 | 0,4212 | 0,1020 | |||
| AIG / American International Group, Inc. | 0,01 | 11,88 | 1,20 | 10,22 | 0,4209 | 0,0059 | |||
| DE / Deere & Company | 0,00 | 12,37 | 1,19 | 21,78 | 0,4189 | 0,0452 | |||
| CCEP / COCA COLA EUROPACIFIC COMPANY GUAR REGS 11/27 1.5 | 0,01 | -0,73 | 1,18 | 5,72 | 0,4162 | -0,0112 | |||
| PCG / PG&E Corporation | 0,08 | -0,73 | 1,18 | -19,47 | 0,4148 | -0,1444 | |||
| LIN / Linde plc | 0,00 | -0,72 | 1,16 | 0,00 | 0,4072 | -0,0349 | |||
| AME / AMETEK, Inc. | 0,01 | -0,73 | 1,15 | 4,36 | 0,4046 | -0,0165 | |||
| VST / Vistra Corp. | 0,01 | 1,14 | 0,4023 | 0,4023 | |||||
| GWRE / Guidewire Software, Inc. | 0,00 | -22,94 | 1,12 | -3,13 | 0,3922 | -0,0476 | |||
| ROST / Ross Stores, Inc. | 0,01 | -0,73 | 1,09 | -0,91 | 0,3832 | -0,0367 | |||
| NDSN / Nordson Corporation | 0,01 | -0,73 | 1,08 | 5,48 | 0,3788 | -0,0111 | |||
| WTW / Willis Towers Watson Public Limited Company | 0,00 | 12,17 | 1,06 | 1,72 | 0,3744 | -0,0253 | |||
| KVUE / Kenvue Inc. | 0,05 | -0,73 | 1,01 | -13,34 | 0,3543 | -0,0898 | |||
| OKTA / Okta, Inc. | 0,01 | 22,42 | 0,99 | 16,31 | 0,3486 | 0,0231 | |||
| FI / Fiserv, Inc. | 0,01 | 16,83 | 0,98 | -8,74 | 0,3451 | -0,0658 | |||
| VRSK / Verisk Analytics, Inc. | 0,00 | -0,73 | 0,98 | 3,93 | 0,3445 | -0,0156 | |||
| SBUX / Starbucks Corporation | 0,01 | -0,73 | 0,96 | -7,24 | 0,3379 | -0,0578 | |||
| GFL / GFL Environmental Inc. | 0,02 | 3,75 | 0,96 | 8,38 | 0,3368 | -0,0007 | |||
| CL / Colgate-Palmolive Company | 0,01 | -0,73 | 0,95 | -3,74 | 0,3353 | -0,0428 | |||
| FRT / Federal Realty Investment Trust | 0,01 | -0,73 | 0,94 | -3,59 | 0,3311 | -0,0419 | |||
| DUK / Duke Energy Corporation | 0,01 | 16,34 | 0,94 | 12,57 | 0,3309 | 0,0116 | |||
| GEV / GE Vernova Inc. | 0,00 | -0,74 | 0,92 | 72,20 | 0,3249 | 0,1198 | |||
| MSI / Motorola Solutions, Inc. | 0,00 | -0,72 | 0,92 | -4,65 | 0,3244 | -0,0451 | |||
| PG / The Procter & Gamble Company | 0,01 | -0,72 | 0,92 | -7,17 | 0,3232 | -0,0550 | |||
| NEE / NextEra Energy, Inc. | 0,01 | -11,67 | 0,90 | -13,46 | 0,3165 | -0,0809 | |||
| HES / Hess Corporation | 0,01 | -35,16 | 0,90 | -43,77 | 0,3159 | -0,2941 | |||
| TECH / Bio-Techne Corporation | 0,02 | 30,71 | 0,89 | 14,73 | 0,3126 | 0,0166 | |||
| STE / STERIS plc | 0,00 | -30,93 | 0,88 | -26,84 | 0,3080 | -0,1489 | |||
| NNN / NNN REIT, Inc. | 0,02 | 153,92 | 0,86 | 157,06 | 0,3012 | 0,1740 | |||
| GD / General Dynamics Corporation | 0,00 | 2,05 | 0,86 | 9,32 | 0,3010 | 0,0017 | |||
| TYL / Tyler Technologies, Inc. | 0,00 | 19,19 | 0,85 | 21,60 | 0,2991 | 0,0318 | |||
| MPWR / Monolithic Power Systems, Inc. | 0,00 | -0,77 | 0,85 | 25,15 | 0,2975 | 0,0393 | |||
| CMCSA / Comcast Corporation | 0,02 | -0,73 | 0,82 | -3,98 | 0,2884 | -0,0378 | |||
| FIS / Fidelity National Information Services, Inc. | 0,01 | 15,77 | 0,81 | 26,28 | 0,2857 | 0,0398 | |||
| US21871X1090 / Corebridge Financial, Inc. | 0,02 | -0,73 | 0,79 | 11,55 | 0,2788 | 0,0076 | |||
| CR / Crane Company | 0,00 | -0,72 | 0,76 | 23,21 | 0,2669 | 0,0314 | |||
| LKQ / LKQ Corporation | 0,02 | -0,73 | 0,74 | -13,72 | 0,2612 | -0,0672 | |||
| SRE / Sempra | 0,01 | -0,73 | 0,74 | 5,41 | 0,2603 | -0,0079 | |||
| 1TPR / Tapestry, Inc. | 0,01 | 0,73 | 0,2575 | 0,2575 | |||||
| BPOP / Popular, Inc. | 0,01 | -13,26 | 0,72 | 3,43 | 0,2548 | -0,0126 | |||
| SHW / The Sherwin-Williams Company | 0,00 | 19,03 | 0,72 | 17,10 | 0,2529 | 0,0183 | |||
| USFD / US Foods Holding Corp. | 0,01 | -0,73 | 0,72 | 16,80 | 0,2519 | 0,0177 | |||
| TTWO / Take-Two Interactive Software, Inc. | 0,00 | -0,74 | 0,71 | 16,29 | 0,2514 | 0,0167 | |||
| REXR / Rexford Industrial Realty, Inc. | 0,02 | -0,73 | 0,71 | -9,83 | 0,2484 | -0,0507 | |||
| CTVA / Corteva, Inc. | 0,01 | -16,79 | 0,69 | -1,42 | 0,2438 | -0,0248 | |||
| HUBS / HubSpot, Inc. | 0,00 | -9,59 | 0,69 | -11,92 | 0,2417 | -0,0563 | |||
| APD / Air Products and Chemicals, Inc. | 0,00 | 19,49 | 0,69 | 14,33 | 0,2414 | 0,0120 | |||
| DXCM / DexCom, Inc. | 0,01 | 30,65 | 0,67 | 67,16 | 0,2364 | 0,0827 | |||
| ROP / Roper Technologies, Inc. | 0,00 | -0,76 | 0,67 | -4,58 | 0,2348 | -0,0324 | |||
| ESTC / Elastic N.V. | 0,01 | 27,38 | 0,66 | 20,77 | 0,2331 | 0,0231 | |||
| ACN / Accenture plc | 0,00 | 71,81 | 0,66 | 64,57 | 0,2306 | 0,0784 | |||
| ELF / e.l.f. Beauty, Inc. | 0,01 | 30,59 | 0,65 | 158,73 | 0,2294 | 0,1331 | |||
| BLDR / Builders FirstSource, Inc. | 0,01 | -19,97 | 0,65 | -25,29 | 0,2289 | -0,1037 | |||
| EPAM / EPAM Systems, Inc. | 0,00 | -0,73 | 0,65 | 3,84 | 0,2285 | -0,0102 | |||
| PNR / Pentair plc | 0,01 | -0,72 | 0,65 | 16,55 | 0,2281 | 0,0155 | |||
| RJF / Raymond James Financial, Inc. | 0,00 | 17,19 | 0,64 | 29,44 | 0,2257 | 0,0363 | |||
| CW / Curtiss-Wright Corporation | 0,00 | 0,63 | 0,2218 | 0,2218 | |||||
| GWW / W.W. Grainger, Inc. | 0,00 | 9,51 | 0,61 | 15,31 | 0,2147 | 0,0125 | |||
| EFX / Equifax Inc. | 0,00 | -1,55 | 0,61 | 4,82 | 0,2144 | -0,0077 | |||
| FERG / Ferguson Enterprises Inc. | 0,00 | -0,72 | 0,60 | 34,75 | 0,2116 | 0,0413 | |||
| TPG / TPG Inc. | 0,01 | 25,84 | 0,59 | 39,19 | 0,2062 | 0,0453 | |||
| EA / Electronic Arts Inc. | 0,00 | 54,72 | 0,58 | 70,97 | 0,2053 | 0,0749 | |||
| EXE / Expand Energy Corporation | 0,00 | -0,73 | 0,57 | 4,17 | 0,2021 | -0,0084 | |||
| MDB / MongoDB, Inc. | 0,00 | -0,72 | 0,55 | 18,75 | 0,1940 | 0,0168 | |||
| VEEV / Veeva Systems Inc. | 0,00 | -65,22 | 0,55 | -56,81 | 0,1919 | -0,2901 | |||
| NTRS / Northern Trust Corporation | 0,00 | -0,73 | 0,54 | 27,68 | 0,1882 | 0,0280 | |||
| S / SentinelOne, Inc. | 0,03 | 15,42 | 0,51 | 16,17 | 0,1795 | 0,0115 | |||
| PFG / Principal Financial Group, Inc. | 0,01 | -0,73 | 0,51 | -6,45 | 0,1787 | -0,0289 | |||
| Smurfit WestRock PLC / EC (IE00028FXN24) | 0,01 | -0,73 | 0,50 | -4,96 | 0,1752 | -0,0249 | |||
| SIGI / Selective Insurance Group, Inc. | 0,01 | 110,99 | 0,49 | 100,00 | 0,1738 | 0,0793 | |||
| EG / Everest Group, Ltd. | 0,00 | 0,49 | 0,1720 | 0,1720 | |||||
| MHK / Mohawk Industries, Inc. | 0,00 | -0,73 | 0,48 | -8,85 | 0,1703 | -0,0326 | |||
| VERX / Vertex, Inc. | 0,01 | 0,47 | 0,1661 | 0,1661 | |||||
| FTI / TechnipFMC plc | 0,01 | -28,01 | 0,47 | -21,80 | 0,1656 | -0,0642 | |||
| EXR / Extra Space Storage Inc. | 0,00 | -0,72 | 0,47 | -1,47 | 0,1652 | -0,0168 | |||
| AIZ / Assurant, Inc. | 0,00 | -0,72 | 0,46 | -6,69 | 0,1621 | -0,0262 | |||
| HUM / Humana Inc. | 0,00 | -0,74 | 0,46 | -8,20 | 0,1614 | -0,0297 | |||
| HWC / Hancock Whitney Corporation | 0,01 | 0,46 | 0,1603 | 0,1603 | |||||
| ELS / Equity LifeStyle Properties, Inc. | 0,01 | 0,45 | 0,1591 | 0,1591 | |||||
| RRX / Regal Rexnord Corporation | 0,00 | -0,74 | 0,45 | 26,35 | 0,1570 | 0,0221 | |||
| EXC / Exelon Corporation | 0,01 | -0,73 | 0,44 | -6,58 | 0,1550 | -0,0250 | |||
| HIW / Highwoods Properties, Inc. | 0,01 | -0,73 | 0,42 | 4,21 | 0,1482 | -0,0064 | |||
| XEL / Xcel Energy Inc. | 0,01 | -35,49 | 0,41 | -37,93 | 0,1457 | -0,1093 | |||
| PR / Permian Resources Corporation | 0,03 | -0,73 | 0,40 | -2,42 | 0,1421 | -0,0160 | |||
| JBHT / J.B. Hunt Transport Services, Inc. | 0,00 | -18,86 | 0,40 | -21,30 | 0,1406 | -0,0533 | |||
| EMN / Eastman Chemical Company | 0,01 | -0,73 | 0,40 | -15,96 | 0,1390 | -0,0405 | |||
| Viking Holdings Ltd / EC (BMG93A5A1010) | 0,01 | 103,13 | 0,38 | 173,57 | 0,1349 | 0,0811 | |||
| PPBI / Pacific Premier Bancorp, Inc. | 0,02 | 86,78 | 0,38 | 85,02 | 0,1348 | 0,0556 | |||
| HAS / Hasbro, Inc. | 0,00 | -0,74 | 0,37 | 19,22 | 0,1290 | 0,0114 | |||
| ODFL / Old Dominion Freight Line, Inc. | 0,00 | 0,35 | 0,1236 | 0,1236 | |||||
| STZ / Constellation Brands, Inc. | 0,00 | -0,74 | 0,35 | -11,90 | 0,1224 | -0,0287 | |||
| PSX / Phillips 66 | 0,00 | -0,72 | 0,34 | -4,18 | 0,1212 | -0,0160 | |||
| DKNG / DraftKings Inc. | 0,01 | -0,73 | 0,34 | 28,46 | 0,1207 | 0,0185 | |||
| BFAM / Bright Horizons Family Solutions Inc. | 0,00 | -0,72 | 0,34 | -3,40 | 0,1202 | -0,0149 | |||
| VLO / Valero Energy Corporation | 0,00 | -0,74 | 0,34 | 0,89 | 0,1199 | -0,0090 | |||
| EVRG / Evergy, Inc. | 0,00 | -0,74 | 0,33 | -0,60 | 0,1175 | -0,0111 | |||
| LOPE / Grand Canyon Education, Inc. | 0,00 | -36,15 | 0,33 | -30,27 | 0,1175 | -0,0654 | |||
| FSLR / First Solar, Inc. | 0,00 | 0,32 | 0,1112 | 0,1112 | |||||
| OMC / Omnicom Group Inc. | 0,00 | -0,72 | 0,32 | -13,90 | 0,1112 | -0,0290 | |||
| EXAS / Exact Sciences Corporation | 0,01 | 0,29 | 0,1025 | 0,1025 | |||||
| SARO / StandardAero, Inc. | 0,01 | -0,73 | 0,28 | 17,99 | 0,0993 | 0,0079 | |||
| ONTO / Onto Innovation Inc. | 0,00 | -0,72 | 0,25 | -17,38 | 0,0887 | -0,0279 | |||
| DD / DuPont de Nemours, Inc. | 0,00 | -37,47 | 0,24 | -42,48 | 0,0848 | -0,0755 | |||
| TJX / The TJX Companies, Inc. | 0,00 | 0,22 | 0,0771 | 0,0771 | |||||
| FLEX / Flex Ltd. | 0,00 | 0,21 | 0,0732 | 0,0732 | |||||
| MTSI / MACOM Technology Solutions Holdings, Inc. | 0,00 | -0,70 | 0,18 | 41,41 | 0,0639 | 0,0150 | |||
| BC / Brunswick Corporation | 0,00 | -0,73 | 0,17 | 1,76 | 0,0609 | -0,0040 | |||
| VFC / V.F. Corporation | 0,01 | -0,73 | 0,14 | -24,73 | 0,0483 | -0,0215 | |||
| FLOC / Flowco Holdings Inc. | 0,00 | -100,00 | 0,00 | -100,00 | -0,0006 | ||||
| AXS / AXIS Capital Holdings Limited | 0,00 | -100,00 | 0,00 | -100,00 | -0,1063 | ||||
| THRY / Thryv Holdings, Inc. | 0,00 | -100,00 | 0,00 | -100,00 | -0,0710 | ||||
| CCI / Crown Castle Inc. | 0,00 | -100,00 | 0,00 | -100,00 | 0,0910 | ||||
| PEGA / Pegasystems Inc. | 0,00 | -100,00 | 0,00 | -100,00 | -0,1970 | ||||
| NWL / Newell Brands Inc. | 0,00 | -100,00 | 0,00 | -100,00 | -0,0670 |