Grundlæggende statistik
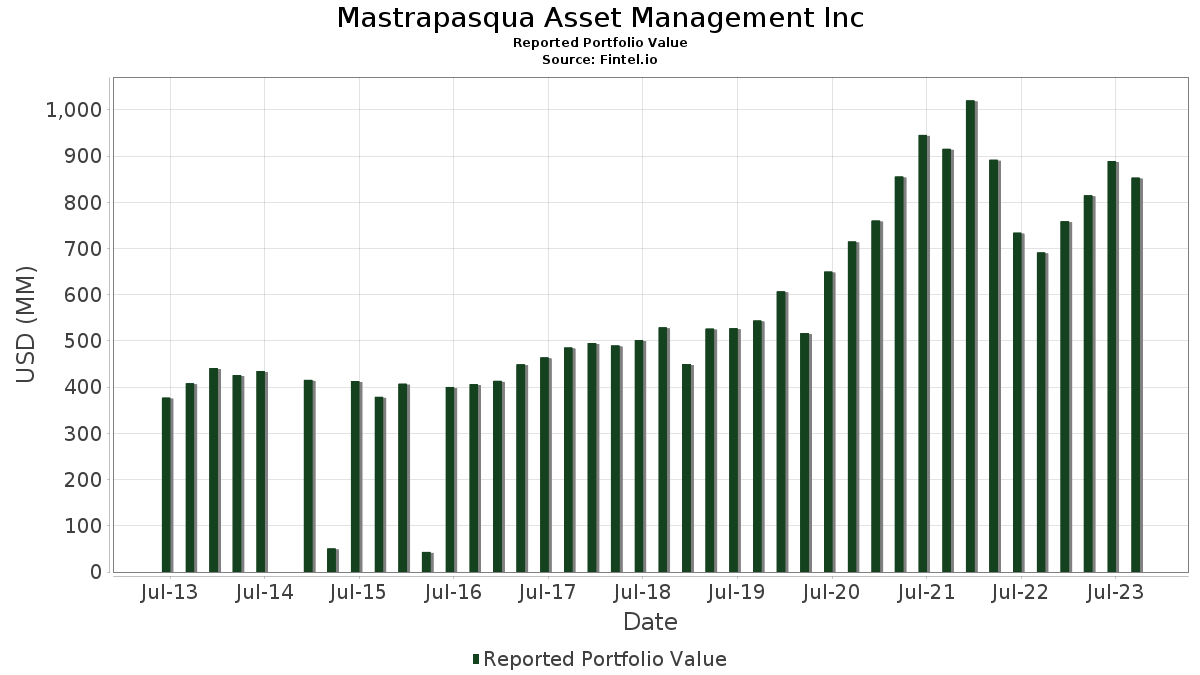
| Porteføljeværdi | $ 853.025.092 |
| Nuværende stillinger | 149 |
Seneste beholdninger, ydeevne, AUM (fra 13F, 13D)
Mastrapasqua Asset Management Inc har afsløret 149 samlede besiddelser i deres seneste SEC-arkivering. Den seneste porteføljeværdi er beregnet til at være $ 853.025.092 USD. Faktiske aktiver under forvaltning (AUM) er denne værdi plus kontanter (som ikke er oplyst). Mastrapasqua Asset Management Incs største beholdninger er NVIDIA Corporation (US:NVDA) , Microsoft Corporation (US:MSFT) , Apple Inc. (US:AAPL) , Broadcom Inc. (US:AVGO) , and Eli Lilly and Company (US:LLY) . Mastrapasqua Asset Management Incs nye stillinger omfatter Alphabet Inc. (US:GOOGL) , Kratos Defense & Security Solutions, Inc. (US:KTOS) , Cameco Corporation (US:CCJ) , Digital Realty Trust, Inc. (US:DLR) , and Dell Technologies Inc. (US:DELL) .
Top øger dette kvartal
Vi bruger ændringen i porteføljeallokeringen, fordi dette er den mest meningsfulde metrik. Ændringer kan skyldes handler eller ændringer i aktiekurser.
| Sikkerhed | Aktier (MM) |
Værdi (MM$) |
Portefølje % | ΔPortefølje % |
|---|---|---|---|---|
| 0,04 | 23,65 | 2,7725 | 0,4394 | |
| 0,06 | 15,27 | 1,7905 | 0,3614 | |
| 0,16 | 21,52 | 2,5225 | 0,2850 | |
| 0,14 | 62,30 | 7,3033 | 0,2752 | |
| 0,07 | 22,07 | 2,5878 | 0,2051 | |
| 0,05 | 12,50 | 1,4652 | 0,1965 | |
| 0,03 | 17,67 | 2,0714 | 0,1602 | |
| 0,12 | 7,14 | 0,8376 | 0,1573 | |
| 0,03 | 2,32 | 0,2718 | 0,1255 | |
| 0,05 | 8,94 | 1,0483 | 0,1165 |
Top falder i dette kvartal
Vi bruger ændringen i porteføljeallokeringen, fordi dette er den mest meningsfulde metrik. Ændringer kan skyldes handler eller ændringer i aktiekurser.
| Sikkerhed | Aktier (MM) |
Værdi (MM$) |
Portefølje % | ΔPortefølje % |
|---|---|---|---|---|
| 0,30 | 51,01 | 5,9793 | -0,6842 | |
| 0,19 | 13,75 | 1,6113 | -0,5050 | |
| 0,17 | 53,39 | 6,2593 | -0,2690 | |
| 0,00 | 0,00 | -0,1541 | ||
| 0,00 | 0,00 | -0,1410 | ||
| 0,14 | 10,57 | 1,2395 | -0,1387 | |
| 0,06 | 12,01 | 1,4085 | -0,1380 | |
| 0,06 | 8,94 | 1,0485 | -0,1173 | |
| 0,00 | 0,00 | -0,1163 | ||
| 0,00 | 0,00 | -0,1162 |
13F og Fondsarkivering
Denne formular blev indsendt den 2023-10-25 for rapporteringsperioden 2023-09-30. Klik på linkikonet for at se den fulde transaktionshistorik.
Opgrader for at låse op for premium-data og eksportere til Excel ![]() .
.
| Sikkerhed | Type | Gennemsnitlig aktiekurs | Aktier (MM) |
Δ Aktier (%) |
Δ Aktier (%) |
Værdi ($MM) |
Portefølje (%) |
ΔPortefølje (%) |
|
|---|---|---|---|---|---|---|---|---|---|
| NVDA / NVIDIA Corporation | 0,14 | -3,04 | 62,30 | -0,30 | 7,3033 | 0,2752 | |||
| MSFT / Microsoft Corporation | 0,17 | -0,78 | 53,39 | -8,01 | 6,2593 | -0,2690 | |||
| AAPL / Apple Inc. | 0,30 | -2,46 | 51,01 | -13,90 | 5,9793 | -0,6842 | |||
| AVGO / Broadcom Inc. | 0,03 | -1,10 | 27,18 | -5,31 | 3,1866 | -0,0421 | |||
| LLY / Eli Lilly and Company | 0,04 | -0,45 | 23,65 | 14,01 | 2,7725 | 0,4394 | |||
| META / Meta Platforms, Inc. | 0,07 | -0,39 | 22,07 | 4,21 | 2,5878 | 0,2051 | |||
| GOOG / Alphabet Inc. | 0,16 | -0,76 | 21,52 | 8,17 | 2,5225 | 0,2850 | |||
| AMZN / Amazon.com, Inc. | 0,17 | -0,42 | 21,04 | -2,89 | 2,4660 | 0,0295 | |||
| V / Visa Inc. | 0,09 | -0,51 | 19,59 | -3,64 | 2,2962 | 0,0100 | |||
| TMO / Thermo Fisher Scientific Inc. | 0,04 | -0,79 | 18,54 | -3,75 | 2,1733 | 0,0068 | |||
| COST / Costco Wholesale Corporation | 0,03 | -0,90 | 17,67 | 3,99 | 2,0714 | 0,1602 | |||
| MMC / Marsh & McLennan Companies, Inc. | 0,09 | -0,65 | 16,59 | 0,52 | 1,9449 | 0,0885 | |||
| ZTS / Zoetis Inc. | 0,09 | -0,19 | 15,92 | 0,84 | 1,8666 | 0,0904 | |||
| HD / The Home Depot, Inc. | 0,05 | -0,08 | 15,32 | -2,81 | 1,7961 | 0,0230 | |||
| AMGN / Amgen Inc. | 0,06 | -0,69 | 15,27 | 20,20 | 1,7905 | 0,3614 | |||
| RTX / RTX Corporation | 0,19 | -0,57 | 13,75 | -26,95 | 1,6113 | -0,5050 | |||
| CAT / Caterpillar Inc. | 0,05 | -0,13 | 12,50 | 10,81 | 1,4652 | 0,1965 | |||
| IQV / IQVIA Holdings Inc. | 0,06 | -0,17 | 12,01 | -12,61 | 1,4085 | -0,1380 | |||
| WMT / Walmart Inc. | 0,07 | -0,40 | 11,35 | 1,35 | 1,3305 | 0,0708 | |||
| NXPI / NXP Semiconductors N.V. | 0,06 | -1,74 | 11,29 | -4,02 | 1,3231 | 0,0003 | |||
| AJG / Arthur J. Gallagher & Co. | 0,05 | -1,46 | 10,98 | 2,29 | 1,2878 | 0,0799 | |||
| MCHP / Microchip Technology Incorporated | 0,14 | -0,95 | 10,57 | -13,70 | 1,2395 | -0,1387 | |||
| ABT / Abbott Laboratories | 0,11 | 0,52 | 10,30 | -10,70 | 1,2071 | -0,0898 | |||
| PG / The Procter & Gamble Company | 0,07 | 0,20 | 10,09 | -3,68 | 1,1830 | 0,0045 | |||
| PEP / PepsiCo, Inc. | 0,06 | 0,54 | 9,70 | -8,02 | 1,1370 | -0,0491 | |||
| WM / Waste Management, Inc. | 0,06 | -0,40 | 9,61 | -12,44 | 1,1268 | -0,1080 | |||
| MRK / Merck & Co., Inc. | 0,09 | -0,17 | 9,54 | -10,93 | 1,1187 | -0,0865 | |||
| NSC / Norfolk Southern Corporation | 0,05 | 0,07 | 9,04 | -13,10 | 1,0592 | -0,1102 | |||
| C.WSA / Citigroup, Inc. | 0,01 | -0,51 | 9,02 | -6,95 | 1,0569 | -0,0328 | |||
| UPS / United Parcel Service, Inc. | 0,06 | -0,77 | 8,94 | -13,71 | 1,0485 | -0,1173 | |||
| LNG / Cheniere Energy, Inc. | 0,05 | -0,90 | 8,94 | 7,94 | 1,0483 | 0,1165 | |||
| BAC / Bank of America Corporation | 0,33 | -0,68 | 8,93 | -5,22 | 1,0470 | -0,0128 | |||
| HON / Honeywell International Inc. | 0,05 | 0,05 | 8,62 | -10,93 | 1,0099 | -0,0780 | |||
| GS / The Goldman Sachs Group, Inc. | 0,03 | -1,07 | 8,58 | -0,75 | 1,0063 | 0,0334 | |||
| IBM / International Business Machines Corporation | 0,06 | -0,13 | 8,44 | 4,72 | 0,9893 | 0,0829 | |||
| MCD / McDonald's Corporation | 0,03 | 0,79 | 8,11 | -11,02 | 0,9511 | -0,0745 | |||
| ROK / Rockwell Automation, Inc. | 0,03 | 0,96 | 8,04 | -12,39 | 0,9425 | -0,0897 | |||
| ZS / Zscaler, Inc. | 0,05 | -2,03 | 8,00 | 4,20 | 0,9375 | 0,0742 | |||
| LMT / Lockheed Martin Corporation | 0,02 | -2,83 | 7,82 | -13,68 | 0,9163 | -0,1022 | |||
| DE / Deere & Company | 0,02 | 0,26 | 7,39 | -6,63 | 0,8658 | -0,0238 | |||
| TJX / The TJX Companies, Inc. | 0,08 | -0,25 | 7,31 | 4,56 | 0,8569 | 0,0706 | |||
| SLB / Schlumberger Limited | 0,12 | -0,47 | 7,14 | 18,12 | 0,8376 | 0,1573 | |||
| PH / Parker-Hannifin Corporation | 0,02 | 0,24 | 7,02 | 0,11 | 0,8229 | 0,0342 | |||
| DHI / D.R. Horton, Inc. | 0,06 | 2,33 | 6,76 | -9,63 | 0,7922 | -0,0488 | |||
| ORCL / Oracle Corporation | 0,06 | 4,58 | 6,12 | -6,98 | 0,7176 | -0,0226 | |||
| GOOGL / Alphabet Inc. | 0,04 | 5,38 | 0,6311 | 0,0695 | |||||
| AKAM / Akamai Technologies, Inc. | 0,05 | -1,30 | 4,82 | 17,01 | 0,5645 | 0,1016 | |||
| INTU / Intuit Inc. | 0,01 | -1,94 | 4,55 | 9,36 | 0,5331 | 0,0653 | |||
| PANW / Palo Alto Networks, Inc. | 0,02 | -1,87 | 4,50 | -9,96 | 0,5277 | -0,0346 | |||
| TW / Tradeweb Markets Inc. | 0,06 | -1,72 | 4,44 | 15,11 | 0,5206 | 0,0866 | |||
| KEYS / Keysight Technologies, Inc. | 0,03 | 1,18 | 3,85 | -20,06 | 0,4519 | -0,0904 | |||
| LOW / Lowe's Companies, Inc. | 0,02 | -0,90 | 3,77 | -8,72 | 0,4420 | -0,0227 | |||
| A / Agilent Technologies, Inc. | 0,03 | -1,14 | 3,66 | -8,07 | 0,4288 | -0,0187 | |||
| CDW / CDW Corporation | 0,02 | -0,75 | 3,62 | 9,11 | 0,4240 | 0,0512 | |||
| VEEV / Veeva Systems Inc. | 0,02 | -0,42 | 3,58 | 2,46 | 0,4202 | 0,0267 | |||
| TSCO / Tractor Supply Company | 0,02 | -0,60 | 3,51 | -8,71 | 0,4116 | -0,0210 | |||
| QCOM / QUALCOMM Incorporated | 0,03 | -4,60 | 3,43 | -10,98 | 0,4019 | -0,0314 | |||
| LHX / L3Harris Technologies, Inc. | 0,02 | -6,56 | 3,28 | -16,89 | 0,3842 | -0,0594 | |||
| PLTR / Palantir Technologies Inc. | 0,20 | -0,63 | 3,25 | 3,73 | 0,3810 | 0,0285 | |||
| GTLS / Chart Industries, Inc. | 0,02 | -0,07 | 3,20 | 5,79 | 0,3751 | 0,0348 | |||
| STE / STERIS plc | 0,01 | -0,28 | 3,17 | -2,73 | 0,3712 | 0,0050 | |||
| TXT / Textron Inc. | 0,04 | -23,76 | 3,16 | -11,91 | 0,3701 | -0,0330 | |||
| VEA / Vanguard Tax-Managed Funds - Vanguard FTSE Developed Markets ETF | 0,07 | 0,00 | 3,01 | -5,34 | 0,3534 | -0,0048 | |||
| SHV / iShares Trust - iShares Short Treasury Bond ETF | 0,03 | -1,47 | 2,77 | -1,42 | 0,3247 | 0,0086 | |||
| VRTX / Vertex Pharmaceuticals Incorporated | 0,01 | -1,90 | 2,69 | -3,06 | 0,3156 | 0,0032 | |||
| BX / Blackstone Inc. | 0,02 | -7,21 | 2,55 | 6,92 | 0,2991 | 0,0307 | |||
| CRL / Charles River Laboratories International, Inc. | 0,01 | -0,43 | 2,48 | -7,22 | 0,2907 | -0,0098 | |||
| RVTY / Revvity, Inc. | 0,02 | -0,14 | 2,43 | -6,95 | 0,2844 | -0,0088 | |||
| FLEX / Flex Ltd. | 0,09 | -0,49 | 2,42 | -2,89 | 0,2836 | 0,0035 | |||
| MAS / Masco Corporation | 0,05 | -0,77 | 2,41 | -7,56 | 0,2825 | -0,0107 | |||
| AL / Air Lease Corporation | 0,06 | -1,03 | 2,40 | -6,79 | 0,2817 | -0,0083 | |||
| BWXT / BWX Technologies, Inc. | 0,03 | 70,19 | 2,32 | 78,31 | 0,2718 | 0,1255 | |||
| SNPS / Synopsys, Inc. | 0,01 | -2,95 | 2,31 | 2,30 | 0,2710 | 0,0168 | |||
| CSX / CSX Corporation | 0,08 | -2,57 | 2,31 | -12,11 | 0,2705 | -0,0249 | |||
| GPC / Genuine Parts Company | 0,02 | -0,91 | 2,29 | -15,47 | 0,2685 | -0,0362 | |||
| ONTO / Onto Innovation Inc. | 0,02 | -0,24 | 2,28 | 9,20 | 0,2671 | 0,0325 | |||
| ITT / ITT Inc. | 0,02 | -0,71 | 2,27 | 4,32 | 0,2660 | 0,0213 | |||
| NVT / nVent Electric plc | 0,04 | -0,20 | 2,17 | 2,36 | 0,2542 | 0,0159 | |||
| NDAQ / Nasdaq, Inc. | 0,04 | -0,66 | 2,15 | -3,19 | 0,2523 | 0,0023 | |||
| HXL / Hexcel Corporation | 0,03 | 67,02 | 2,12 | 43,12 | 0,2487 | 0,0820 | |||
| GPK / Graphic Packaging Holding Company | 0,09 | 71,58 | 2,07 | 59,05 | 0,2432 | 0,0965 | |||
| AMAT / Applied Materials, Inc. | 0,01 | -1,69 | 2,02 | -5,83 | 0,2369 | -0,0045 | |||
| DGX / Quest Diagnostics Incorporated | 0,02 | -1,12 | 1,98 | -14,30 | 0,2327 | -0,0278 | |||
| JPM / JPMorgan Chase & Co. | 0,01 | 8,52 | 1,95 | 8,17 | 0,2284 | 0,0259 | |||
| BRKR / Bruker Corporation | 0,03 | -1,00 | 1,92 | -16,55 | 0,2247 | -0,0337 | |||
| ROP / Roper Technologies, Inc. | 0,00 | -1,36 | 1,83 | -0,65 | 0,2144 | 0,0074 | |||
| PAYX / Paychex, Inc. | 0,01 | -2,91 | 1,71 | 0,06 | 0,2008 | 0,0083 | |||
| GD / General Dynamics Corporation | 0,01 | -1,74 | 1,71 | 0,94 | 0,2007 | 0,0099 | |||
| WSM / Williams-Sonoma, Inc. | 0,01 | -2,00 | 1,71 | 21,69 | 0,2007 | 0,0425 | |||
| XOM / Exxon Mobil Corporation | 0,01 | -0,67 | 1,68 | 8,96 | 0,1968 | 0,0234 | |||
| FFIV / F5, Inc. | 0,01 | -0,90 | 1,65 | 9,17 | 0,1940 | 0,0235 | |||
| CVX / Chevron Corporation | 0,01 | -13,59 | 1,63 | -7,40 | 0,1908 | -0,0069 | |||
| TER / Teradyne, Inc. | 0,02 | 0,43 | 1,63 | -9,36 | 0,1908 | -0,0112 | |||
| ULTA / Ulta Beauty, Inc. | 0,00 | -2,41 | 1,62 | -17,16 | 0,1897 | -0,0300 | |||
| MLM / Martin Marietta Materials, Inc. | 0,00 | -0,13 | 1,58 | -11,19 | 0,1852 | -0,0149 | |||
| DAR / Darling Ingredients Inc. | 0,03 | -3,42 | 1,50 | -20,97 | 0,1759 | -0,0376 | |||
| WWD / Woodward, Inc. | 0,01 | -0,46 | 1,49 | 3,99 | 0,1743 | 0,0135 | |||
| KO / The Coca-Cola Company | 0,03 | -1,07 | 1,48 | -8,03 | 0,1733 | -0,0075 | |||
| BMY / Bristol-Myers Squibb Company | 0,02 | -0,60 | 1,43 | -9,76 | 0,1680 | -0,0107 | |||
| TXN / Texas Instruments Incorporated | 0,01 | -1,35 | 1,35 | -12,89 | 0,1585 | -0,0160 | |||
| PFE / Pfizer Inc. | 0,04 | -0,14 | 1,32 | -9,70 | 0,1550 | -0,0097 | |||
| UNP / Union Pacific Corporation | 0,01 | -1,89 | 1,32 | -2,37 | 0,1548 | 0,0027 | |||
| KMB / Kimberly-Clark Corporation | 0,01 | -0,39 | 1,23 | -12,77 | 0,1442 | -0,0145 | |||
| TFX / Teleflex Incorporated | 0,01 | -0,98 | 1,15 | -19,65 | 0,1348 | -0,0262 | |||
| DOW / Dow Inc. | 0,02 | -1,21 | 1,14 | -4,37 | 0,1336 | -0,0004 | |||
| PHM / PulteGroup, Inc. | 0,02 | -0,64 | 1,12 | -5,31 | 0,1317 | -0,0017 | |||
| C / Citigroup Inc. | 0,03 | 0,00 | 1,12 | -10,73 | 0,1308 | -0,0097 | |||
| GIS / General Mills, Inc. | 0,02 | -0,53 | 1,09 | -16,97 | 0,1273 | -0,0199 | |||
| JNJ / Johnson & Johnson | 0,01 | 0,12 | 1,08 | -5,74 | 0,1270 | -0,0023 | |||
| HII / Huntington Ingalls Industries, Inc. | 0,01 | -0,18 | 1,05 | -10,21 | 0,1227 | -0,0085 | |||
| BA / The Boeing Company | 0,01 | -1,25 | 1,03 | -10,38 | 0,1204 | -0,0085 | |||
| AEP / American Electric Power Company, Inc. | 0,01 | -1,45 | 1,01 | -11,99 | 0,1180 | -0,0106 | |||
| VWO / Vanguard International Equity Index Funds - Vanguard FTSE Emerging Markets ETF | 0,03 | 0,00 | 1,01 | -3,64 | 0,1179 | 0,0005 | |||
| KBR / KBR, Inc. | 0,02 | -0,90 | 0,97 | -10,16 | 0,1141 | -0,0078 | |||
| BWA / BorgWarner Inc. | 0,02 | -5,28 | 0,97 | -21,83 | 0,1134 | -0,0258 | |||
| BOOT / Boot Barn Holdings, Inc. | 0,01 | -0,65 | 0,93 | -4,71 | 0,1090 | -0,0008 | |||
| SO / The Southern Company | 0,01 | 0,35 | 0,92 | -7,47 | 0,1075 | -0,0041 | |||
| KTOS / Kratos Defense & Security Solutions, Inc. | 0,06 | 0,91 | 0,1071 | 0,1071 | |||||
| TGT / Target Corporation | 0,01 | 0,90 | 0,1051 | 0,1051 | |||||
| PSA / Public Storage | 0,00 | -2,37 | 0,89 | -11,88 | 0,1044 | -0,0092 | |||
| CCJ / Cameco Corporation | 0,02 | 0,87 | 0,1022 | 0,1022 | |||||
| TSEM / Tower Semiconductor Ltd. | 0,03 | -6,11 | 0,86 | -38,54 | 0,1006 | -0,0564 | |||
| VZ / Verizon Communications Inc. | 0,03 | -0,04 | 0,86 | -12,91 | 0,1006 | -0,0102 | |||
| HSY / The Hershey Company | 0,00 | -38,33 | 0,84 | -50,59 | 0,0989 | -0,0931 | |||
| ETN / Eaton Corporation plc | 0,00 | -2,92 | 0,79 | 2,98 | 0,0932 | 0,0063 | |||
| GXO / GXO Logistics, Inc. | 0,01 | -5,52 | 0,77 | -11,77 | 0,0905 | -0,0079 | |||
| MKSI / MKS Inc. | 0,01 | -5,19 | 0,64 | -24,14 | 0,0752 | -0,0199 | |||
| DLR / Digital Realty Trust, Inc. | 0,00 | 0,57 | 0,0668 | 0,0668 | |||||
| DELL / Dell Technologies Inc. | 0,01 | 0,57 | 0,0666 | 0,0666 | |||||
| MMM / 3M Company | 0,01 | 1,97 | 0,53 | -4,51 | 0,0620 | -0,0004 | |||
| ENBBF / Enbridge Inc - FR PRF PERPETUAL USD 25 - Ser J | 0,02 | -1,85 | 0,50 | -12,08 | 0,0589 | -0,0054 | |||
| ABBV / AbbVie Inc. | 0,00 | -2,54 | 0,40 | 7,82 | 0,0469 | 0,0052 | |||
| MS / Morgan Stanley | 0,00 | 51,72 | 0,36 | 45,34 | 0,0421 | 0,0143 | |||
| NVS / Novartis AG - Depositary Receipt (Common Stock) | 0,00 | 3,15 | 0,33 | 4,06 | 0,0391 | 0,0031 | |||
| GILD / Gilead Sciences, Inc. | 0,00 | 3,48 | 0,32 | 0,62 | 0,0379 | 0,0018 | |||
| CSCO / Cisco Systems, Inc. | 0,01 | -1,33 | 0,32 | 2,58 | 0,0373 | 0,0024 | |||
| IRM / Iron Mountain Incorporated | 0,00 | 3,22 | 0,29 | 7,78 | 0,0342 | 0,0038 | |||
| JEF / Jefferies Financial Group Inc. | 0,01 | 3,77 | 0,26 | 14,78 | 0,0310 | 0,0050 | |||
| K / Kellanova | 0,00 | 5,21 | 0,26 | -7,04 | 0,0310 | -0,0010 | |||
| HR / Healthcare Realty Trust Incorporated | 0,02 | 4,47 | 0,25 | -15,61 | 0,0299 | -0,0040 | |||
| AMD / Advanced Micro Devices, Inc. | 0,00 | -17,24 | 0,25 | -25,45 | 0,0289 | -0,0082 | |||
| SPY / SPDR S&P 500 ETF | 0,00 | -5,73 | 0,25 | -8,89 | 0,0289 | -0,0016 | |||
| NI / NiSource Inc. | 0,01 | 4,58 | 0,23 | -5,83 | 0,0266 | -0,0004 | |||
| TRN / Trinity Industries, Inc. | 0,01 | 4,99 | 0,22 | -0,46 | 0,0256 | 0,0009 | |||
| FLO / Flowers Foods, Inc. | 0,01 | 5,08 | 0,22 | -6,47 | 0,0255 | -0,0006 | |||
| QQQ / Invesco QQQ Trust, Series 1 | 0,00 | 0,21 | 0,0251 | 0,0251 | |||||
| XBI / SPDR Series Trust - SPDR S&P Biotech ETF | 0,00 | 13,46 | 0,21 | -0,48 | 0,0242 | 0,0009 | |||
| IRT / Independence Realty Trust, Inc. | 0,01 | 6,70 | 0,15 | -18,03 | 0,0177 | -0,0029 | |||
| BB / BlackBerry Limited | 0,02 | 6,85 | 0,07 | -8,75 | 0,0086 | -0,0005 | |||
| FMC / FMC Corporation | 0,00 | -100,00 | 0,00 | -100,00 | -0,1050 | ||||
| BLMN / Bloomin' Brands, Inc. | 0,00 | -100,00 | 0,00 | -100,00 | -0,1410 | ||||
| RSPT / Invesco Exchange-Traded Fund Trust - Invesco S&P 500 Equal Weight Technology ETF | 0,00 | -100,00 | 0,00 | -100,00 | -0,0341 | ||||
| CTVA / Corteva, Inc. | 0,00 | -100,00 | 0,00 | -100,00 | -0,1541 | ||||
| TKR / The Timken Company | 0,00 | -100,00 | 0,00 | -100,00 | -0,1163 | ||||
| FITB / Fifth Third Bancorp | 0,00 | -100,00 | 0,00 | -100,00 | -0,1162 |