Grundlæggende statistik
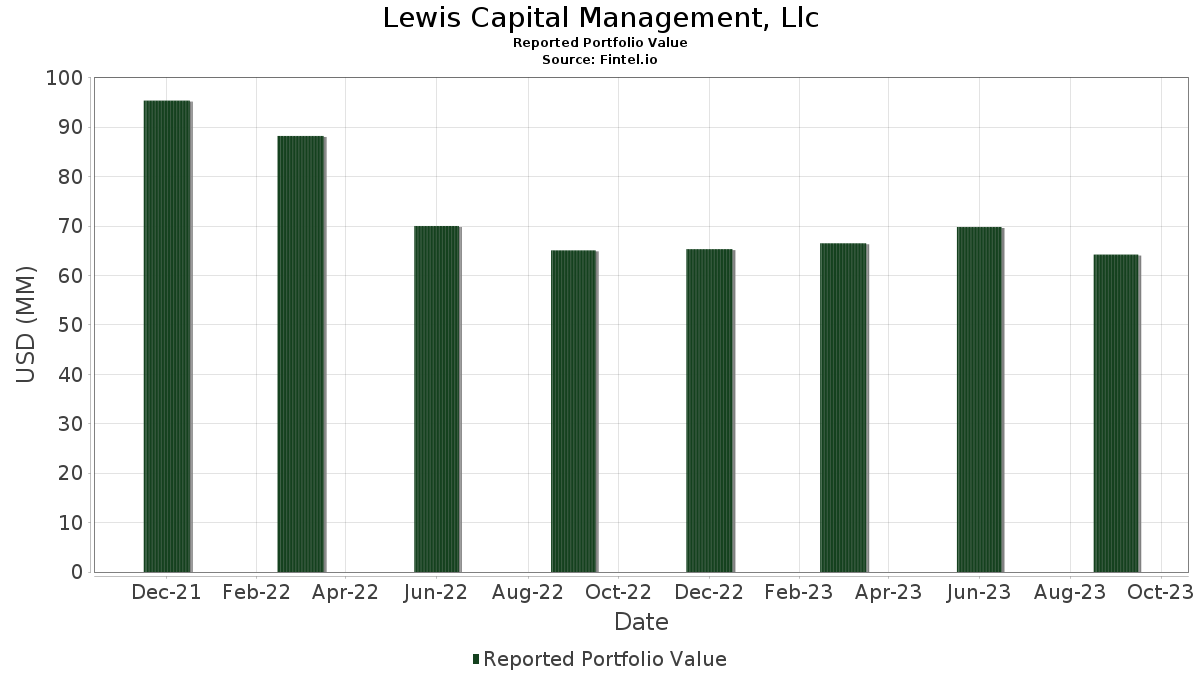
| Porteføljeværdi | $ 64.230.946 |
| Nuværende stillinger | 58 |
Seneste beholdninger, ydeevne, AUM (fra 13F, 13D)
Lewis Capital Management, Llc har afsløret 58 samlede besiddelser i deres seneste SEC-arkivering. Den seneste porteføljeværdi er beregnet til at være $ 64.230.946 USD. Faktiske aktiver under forvaltning (AUM) er denne værdi plus kontanter (som ikke er oplyst). Lewis Capital Management, Llcs største beholdninger er The Walt Disney Company (US:DIS) , Astronics Corporation (US:ATRO) , Apple Inc. (US:AAPL) , Computer Task Group, Inc. (US:CTG) , and Vanguard Specialized Funds - Vanguard Dividend Appreciation ETF (US:VIG) .
Top øger dette kvartal
Vi bruger ændringen i porteføljeallokeringen, fordi dette er den mest meningsfulde metrik. Ændringer kan skyldes handler eller ændringer i aktiekurser.
| Sikkerhed | Aktier (MM) |
Værdi (MM$) |
Portefølje % | ΔPortefølje % |
|---|---|---|---|---|
| 0,38 | 3,92 | 6,0958 | 1,9178 | |
| 0,01 | 1,69 | 2,6285 | 0,6924 | |
| 0,01 | 1,40 | 2,1762 | 0,6175 | |
| 0,18 | 2,68 | 4,1789 | 0,4096 | |
| 0,00 | 0,21 | 0,3331 | 0,3331 | |
| 0,02 | 3,18 | 4,9560 | 0,2334 | |
| 0,00 | 0,71 | 1,1006 | 0,1829 | |
| 0,02 | 4,10 | 6,3779 | 0,1796 | |
| 0,00 | 0,78 | 1,2088 | 0,1485 | |
| 0,00 | 0,58 | 0,9097 | 0,1468 |
Top falder i dette kvartal
Vi bruger ændringen i porteføljeallokeringen, fordi dette er den mest meningsfulde metrik. Ændringer kan skyldes handler eller ændringer i aktiekurser.
| Sikkerhed | Aktier (MM) |
Værdi (MM$) |
Portefølje % | ΔPortefølje % |
|---|---|---|---|---|
| 0,00 | 0,00 | -2,1833 | ||
| 0,33 | 5,31 | 8,2654 | -0,8876 | |
| 0,02 | 0,39 | 0,6068 | -0,6469 | |
| 0,05 | 1,28 | 1,9892 | -0,6159 | |
| 0,00 | 0,00 | -0,3128 | ||
| 0,00 | 0,00 | -0,3108 | ||
| 0,01 | 1,30 | 2,0307 | -0,2884 | |
| 0,18 | 14,37 | 22,3700 | -0,1871 | |
| 0,00 | 0,86 | 1,3315 | -0,0976 | |
| 0,01 | 0,79 | 1,2247 | -0,0909 |
13F og Fondsarkivering
Denne formular blev indsendt den 2023-11-08 for rapporteringsperioden 2023-09-30. Klik på linkikonet for at se den fulde transaktionshistorik.
Opgrader for at låse op for premium-data og eksportere til Excel ![]() .
.
| Sikkerhed | Type | Gennemsnitlig aktiekurs | Aktier (MM) |
Δ Aktier (%) |
Δ Aktier (%) |
Værdi ($MM) |
Portefølje (%) |
ΔPortefølje (%) |
|
|---|---|---|---|---|---|---|---|---|---|
| DIS / The Walt Disney Company | 0,18 | 0,51 | 14,37 | -8,75 | 22,3700 | -0,1871 | |||
| ATRO / Astronics Corporation | 0,33 | 4,04 | 5,31 | -16,92 | 8,2654 | -0,8876 | |||
| AAPL / Apple Inc. | 0,02 | 7,26 | 4,10 | -5,34 | 6,3779 | 0,1796 | |||
| CTG / Computer Task Group, Inc. | 0,38 | -1,10 | 3,92 | 34,26 | 6,0958 | 1,9178 | |||
| VIG / Vanguard Specialized Funds - Vanguard Dividend Appreciation ETF | 0,02 | 0,94 | 3,18 | -3,43 | 4,9560 | 0,2334 | |||
| ATEN / A10 Networks, Inc. | 0,18 | -0,98 | 2,68 | 2,01 | 4,1789 | 0,4096 | |||
| MSFT / Microsoft Corporation | 0,01 | 34,72 | 1,69 | 24,94 | 2,6285 | 0,6924 | |||
| AMGN / Amgen Inc. | 0,01 | 6,12 | 1,40 | 28,40 | 2,1762 | 0,6175 | |||
| CMI / Cummins Inc. | 0,01 | 0,00 | 1,31 | -6,82 | 2,0416 | 0,0258 | |||
| CRMT / America's Car-Mart, Inc. | 0,01 | -11,65 | 1,30 | -19,41 | 2,0307 | -0,2884 | |||
| SILC / Silicom Ltd. | 0,05 | -0,78 | 1,28 | -29,76 | 1,9892 | -0,6159 | |||
| PERI / Perion Network Ltd. | 0,04 | -0,97 | 1,09 | -1,09 | 1,6967 | 0,1182 | |||
| MCD / McDonald's Corporation | 0,00 | -0,20 | 1,03 | -11,94 | 1,6090 | -0,0714 | |||
| AVB / AvalonBay Communities, Inc. | 0,01 | -1,16 | 1,03 | -10,32 | 1,5963 | -0,0413 | |||
| QCOM / QUALCOMM Incorporated | 0,01 | -0,90 | 0,98 | -7,54 | 1,5276 | 0,0074 | |||
| TSLA / Tesla, Inc. | 0,00 | -5,01 | 0,96 | -9,16 | 1,4979 | -0,0200 | |||
| GJR / Strats Trust For Procter & Gambel Security - Preferred Security | 0,01 | -0,35 | 0,96 | -4,20 | 1,4938 | 0,0591 | |||
| SPY / SPDR S&P 500 ETF | 0,00 | 2,46 | 0,95 | -1,15 | 1,4715 | 0,1012 | |||
| PFE / Pfizer Inc. | 0,03 | 7,00 | 0,88 | -3,30 | 1,3696 | 0,0672 | |||
| NFLX / Netflix, Inc. | 0,00 | 0,00 | 0,86 | -14,24 | 1,3315 | -0,0976 | |||
| AXP / American Express Company | 0,01 | 0,02 | 0,79 | -14,38 | 1,2247 | -0,0909 | |||
| UNH / UnitedHealth Group Incorporated | 0,00 | 0,00 | 0,78 | 4,86 | 1,2088 | 0,1485 | |||
| CHRW / C.H. Robinson Worldwide, Inc. | 0,01 | 0,00 | 0,76 | -8,78 | 1,1814 | -0,0093 | |||
| XLP / The Select Sector SPDR Trust - The Consumer Staples Select Sector SPDR Fund | 0,01 | -1,84 | 0,73 | -8,92 | 1,1300 | -0,0116 | |||
| WMT / Walmart Inc. | 0,00 | 8,47 | 0,71 | 10,31 | 1,1006 | 0,1829 | |||
| BKFOF / Brookfield Corporation - Preferred Stock | 0,02 | -0,93 | 0,61 | -7,99 | 0,9505 | 0,0005 | |||
| TXN / Texas Instruments Incorporated | 0,00 | 0,00 | 0,60 | -11,70 | 0,9407 | -0,0392 | |||
| GS / The Goldman Sachs Group, Inc. | 0,00 | 9,39 | 0,58 | 9,77 | 0,9097 | 0,1468 | |||
| MDT / Medtronic plc | 0,01 | -2,98 | 0,57 | -13,74 | 0,8807 | -0,0584 | |||
| GOOGL / Alphabet Inc. | 0,00 | -3,23 | 0,55 | 5,33 | 0,8622 | 0,1101 | |||
| BRK.A / Berkshire Hathaway Inc. | 0,00 | 0,00 | 0,53 | 2,71 | 0,8274 | 0,0857 | |||
| TRV / The Travelers Companies, Inc. | 0,00 | 9,40 | 0,47 | 2,83 | 0,7371 | 0,0779 | |||
| JNJ / Johnson & Johnson | 0,00 | -6,02 | 0,43 | -11,70 | 0,6705 | -0,0271 | |||
| ESLT / Elbit Systems Ltd. | 0,00 | 0,00 | 0,42 | -5,16 | 0,6593 | 0,0190 | |||
| OTTR / Otter Tail Corporation | 0,01 | 0,00 | 0,41 | -3,95 | 0,6442 | 0,0277 | |||
| VSAT / Viasat, Inc. | 0,02 | -0,47 | 0,39 | -55,54 | 0,6068 | -0,6469 | |||
| ATVI / Activision Blizzard Inc | 0,00 | -1,99 | 0,38 | 8,83 | 0,5953 | 0,0921 | |||
| XEL / Xcel Energy Inc. | 0,01 | -2,25 | 0,35 | -9,97 | 0,5488 | -0,0125 | |||
| NVDA / NVIDIA Corporation | 0,00 | 0,00 | 0,33 | 2,83 | 0,5106 | 0,0537 | |||
| HD / The Home Depot, Inc. | 0,00 | 0,00 | 0,31 | -2,83 | 0,4817 | 0,0261 | |||
| HON / Honeywell International Inc. | 0,00 | 0,00 | 0,30 | -11,14 | 0,4602 | -0,0154 | |||
| LOW / Lowe's Companies, Inc. | 0,00 | 0,00 | 0,29 | -7,94 | 0,4530 | 0,0004 | |||
| CSCO / Cisco Systems, Inc. | 0,01 | 0,06 | 0,27 | 3,88 | 0,4185 | 0,0482 | |||
| ABBV / AbbVie Inc. | 0,00 | 0,00 | 0,26 | 10,55 | 0,4084 | 0,0688 | |||
| ENS / EnerSys | 0,00 | 0,00 | 0,26 | -12,97 | 0,3981 | -0,0218 | |||
| ORCL / Oracle Corporation | 0,00 | 14,29 | 0,25 | 1,60 | 0,3958 | 0,0375 | |||
| TGT / Target Corporation | 0,00 | -0,56 | 0,25 | -16,78 | 0,3954 | -0,0410 | |||
| STZ / Constellation Brands, Inc. | 0,00 | -5,93 | 0,25 | -3,83 | 0,3913 | 0,0165 | |||
| SBUX / Starbucks Corporation | 0,00 | 0,00 | 0,25 | -7,89 | 0,3824 | 0,0005 | |||
| C / Citigroup Inc. - Corporate Bond/Note | 0,01 | 1,05 | 0,24 | -9,89 | 0,3700 | -0,0071 | |||
| RSP / Invesco Exchange-Traded Fund Trust - Invesco S&P 500 Equal Weight ETF | 0,00 | 0,00 | 0,24 | -5,24 | 0,3668 | 0,0104 | |||
| KO / The Coca-Cola Company | 0,00 | 15,68 | 0,23 | 7,41 | 0,3627 | 0,0524 | |||
| KLAC / KLA Corporation | 0,00 | 0,00 | 0,23 | -5,37 | 0,3570 | 0,0097 | |||
| XOM / Exxon Mobil Corporation | 0,00 | 0,00 | 0,22 | 10,00 | 0,3427 | 0,0551 | |||
| GPN / Global Payments Inc. | 0,00 | 0,21 | 0,3331 | 0,3331 | |||||
| COST / Costco Wholesale Corporation | 0,00 | -11,55 | 0,20 | -7,31 | 0,3166 | 0,0028 | |||
| ABT / Abbott Laboratories | 0,00 | 0,00 | 0,20 | -10,96 | 0,3166 | -0,0113 | |||
| CTLP / Cantaloupe, Inc. | 0,02 | 0,00 | 0,10 | -21,26 | 0,1562 | -0,0268 | |||
| AMZN / Amazon.com, Inc. | 0,00 | -100,00 | 0,00 | -100,00 | -0,3128 | ||||
| VZ / Verizon Communications Inc. | 0,00 | -100,00 | 0,00 | -100,00 | -2,1833 | ||||
| RTX / RTX Corporation | 0,00 | -100,00 | 0,00 | -100,00 | -0,3108 |