Grundlæggende statistik
| Porteføljeværdi | $ 90.464.000 |
| Nuværende stillinger | 119 |
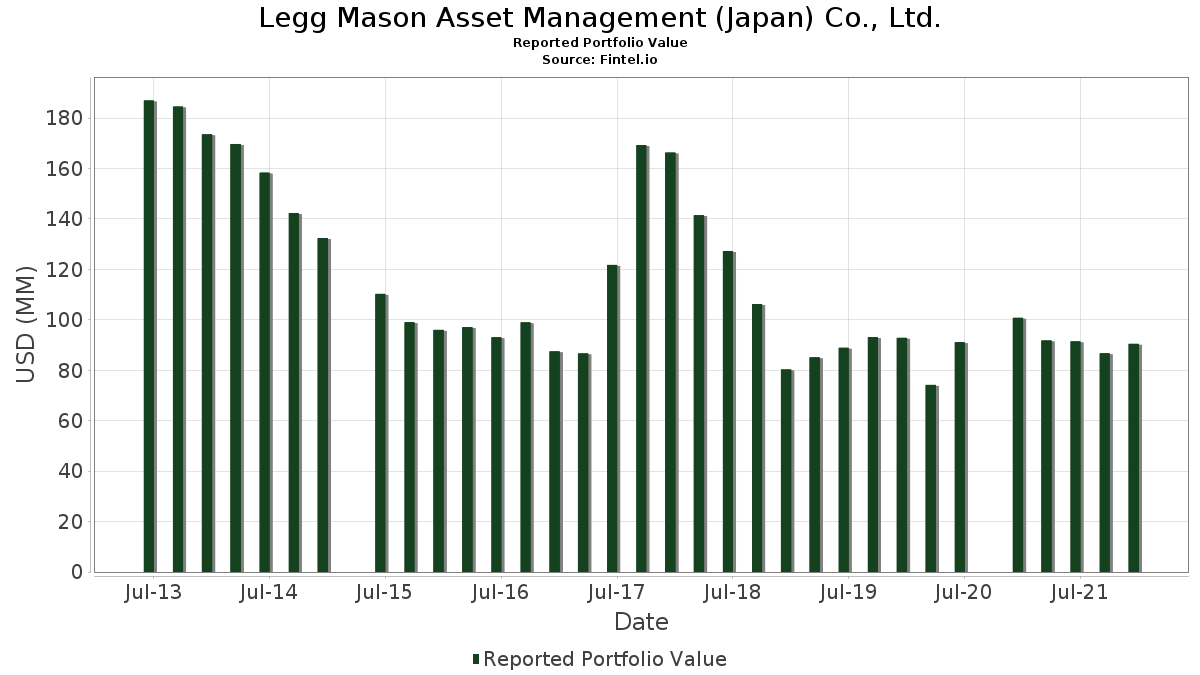
Seneste beholdninger, ydeevne, AUM (fra 13F, 13D)
Legg Mason Asset Management (Japan) Co., Ltd. har afsløret 119 samlede besiddelser i deres seneste SEC-arkivering. Den seneste porteføljeværdi er beregnet til at være $ 90.464.000 USD. Faktiske aktiver under forvaltning (AUM) er denne værdi plus kontanter (som ikke er oplyst). Legg Mason Asset Management (Japan) Co., Ltd.s største beholdninger er Apple Inc. (US:AAPL) , Microsoft Corporation (US:MSFT) , Pfizer Inc. (US:PFE) , Alphabet Inc. (US:GOOG) , and Amazon.com, Inc. (US:AMZN) . Legg Mason Asset Management (Japan) Co., Ltd.s nye stillinger omfatter Moderna, Inc. (US:MRNA) , Southwest Gas Holdings, Inc. (US:SWX) , .
Top øger dette kvartal
Vi bruger ændringen i porteføljeallokeringen, fordi dette er den mest meningsfulde metrik. Ændringer kan skyldes handler eller ændringer i aktiekurser.
| Sikkerhed | Aktier (MM) |
Værdi (MM$) |
Portefølje % | ΔPortefølje % |
|---|---|---|---|---|
| 0,00 | 0,97 | 1,0711 | 1,0711 | |
| 0,00 | 0,66 | 0,7329 | 0,7329 | |
| 0,01 | 2,66 | 2,9371 | 0,6894 | |
| 0,01 | 0,55 | 0,6036 | 0,6036 | |
| 0,02 | 1,24 | 1,3674 | 0,5601 | |
| 0,00 | 0,41 | 0,4587 | 0,4587 | |
| 0,04 | 2,12 | 2,3468 | 0,4359 | |
| 0,03 | 4,61 | 5,0982 | 0,4298 | |
| 0,01 | 0,81 | 0,8899 | 0,3697 | |
| 0,00 | 0,32 | 0,3548 | 0,3548 |
Top falder i dette kvartal
Vi bruger ændringen i porteføljeallokeringen, fordi dette er den mest meningsfulde metrik. Ændringer kan skyldes handler eller ændringer i aktiekurser.
| Sikkerhed | Aktier (MM) |
Værdi (MM$) |
Portefølje % | ΔPortefølje % |
|---|---|---|---|---|
| 0,00 | 0,00 | -1,0529 | ||
| 0,00 | 0,00 | -1,0229 | ||
| 0,00 | 0,00 | -0,8269 | ||
| 0,00 | 0,00 | -0,6689 | ||
| 0,00 | 0,00 | -0,6043 | ||
| 0,00 | 0,00 | -0,4671 | ||
| 0,00 | 0,00 | -0,3483 | ||
| 0,00 | 0,41 | 0,4532 | -0,2998 | |
| 0,01 | 0,86 | 0,9529 | -0,2603 | |
| 0,00 | 0,95 | 1,0479 | -0,2056 |
13F og Fondsarkivering
Denne formular blev indsendt den 2022-02-14 for rapporteringsperioden 2021-12-31. Klik på linkikonet for at se den fulde transaktionshistorik.
Opgrader for at låse op for premium-data og eksportere til Excel ![]() .
.
| Sikkerhed | Type | Gennemsnitlig aktiekurs | Aktier (MM) |
Δ Aktier (%) |
Δ Aktier (%) |
Værdi ($MM) |
Portefølje (%) |
ΔPortefølje (%) |
|
|---|---|---|---|---|---|---|---|---|---|
| AAPL / Apple Inc. | 0,03 | -9,22 | 4,61 | 13,93 | 5,0982 | 0,4298 | |||
| MSFT / Microsoft Corporation | 0,01 | 14,29 | 2,66 | 36,33 | 2,9371 | 0,6894 | |||
| PFE / Pfizer Inc. | 0,04 | -6,68 | 2,12 | 28,12 | 2,3468 | 0,4359 | |||
| GOOG / Alphabet Inc. | 0,00 | -4,70 | 1,88 | 3,47 | 2,0760 | -0,0172 | |||
| AMZN / Amazon.com, Inc. | 0,00 | -4,71 | 1,42 | -3,28 | 1,5664 | -0,1231 | |||
| PG / The Procter & Gamble Company | 0,01 | -13,37 | 1,40 | 1,38 | 1,5432 | -0,0449 | |||
| GOOGL / Alphabet Inc. | 0,00 | -4,71 | 1,35 | 3,22 | 1,4890 | -0,0160 | |||
| WBA / Walgreens Boots Alliance, Inc. | 0,02 | 59,30 | 1,24 | 76,71 | 1,3674 | 0,5601 | |||
| COST / Costco Wholesale Corporation | 0,00 | -4,73 | 1,20 | 20,34 | 1,3276 | 0,1767 | |||
| LOW / Lowe's Companies, Inc. | 0,00 | -4,75 | 1,12 | 21,34 | 1,2381 | 0,1736 | |||
| AMAT / Applied Materials, Inc. | 0,01 | -16,32 | 1,07 | 2,29 | 1,1872 | -0,0237 | |||
| PEP / PepsiCo, Inc. | 0,01 | -5,48 | 1,06 | 9,08 | 1,1684 | 0,0509 | |||
| AZO / AutoZone, Inc. | 0,00 | -13,82 | 1,05 | 6,41 | 1,1563 | 0,0226 | |||
| XOM / Exxon Mobil Corporation | 0,02 | -4,76 | 1,04 | -0,95 | 1,1485 | -0,0612 | |||
| MCD / McDonald's Corporation | 0,00 | -4,94 | 1,03 | 5,64 | 1,1397 | 0,0141 | |||
| IBM / International Business Machines Corporation | 0,01 | 7,22 | 1,01 | 3,07 | 1,1143 | -0,0136 | |||
| MOH / Molina Healthcare, Inc. | 0,00 | -4,73 | 0,99 | 11,70 | 1,0977 | 0,0724 | |||
| MMM / 3M Company | 0,01 | 10,71 | 0,98 | 12,11 | 1,0844 | 0,0753 | |||
| PM / Philip Morris International Inc. | 0,01 | 11,62 | 0,97 | 11,94 | 1,0778 | 0,0733 | |||
| AMGN / Amgen Inc. | 0,00 | 0,97 | 1,0711 | 1,0711 | |||||
| VZ / Verizon Communications Inc. | 0,02 | 2,64 | 0,96 | -1,23 | 1,0634 | -0,0599 | |||
| TGT / Target Corporation | 0,00 | -13,74 | 0,95 | -12,79 | 1,0479 | -0,2056 | |||
| LMT / Lockheed Martin Corporation | 0,00 | 6,12 | 0,94 | 9,27 | 1,0424 | 0,0472 | |||
| JNJ / Johnson & Johnson | 0,01 | -8,33 | 0,94 | -2,89 | 1,0402 | -0,0773 | |||
| TER / Teradyne, Inc. | 0,01 | -4,76 | 0,94 | 42,64 | 1,0391 | 0,2791 | |||
| FTNT / Fortinet, Inc. | 0,00 | -4,74 | 0,93 | 17,23 | 1,0302 | 0,1134 | |||
| MCK / McKesson Corporation | 0,00 | -4,75 | 0,93 | 18,69 | 1,0247 | 0,1240 | |||
| DLR / Digital Realty Trust, Inc. | 0,01 | 0,00 | 0,91 | 22,48 | 1,0059 | 0,1491 | |||
| KR / The Kroger Co. | 0,02 | -4,76 | 0,90 | 6,61 | 0,9982 | 0,0214 | |||
| REGN / Regeneron Pharmaceuticals, Inc. | 0,00 | -4,73 | 0,90 | -0,55 | 0,9982 | -0,0490 | |||
| INTC / Intel Corporation | 0,02 | -4,76 | 0,89 | -7,97 | 0,9827 | -0,1313 | |||
| MRK / Merck & Co., Inc. | 0,01 | -14,72 | 0,88 | -12,94 | 0,9739 | -0,1932 | |||
| CME / CME Group Inc. | 0,00 | 0,00 | 0,88 | 18,12 | 0,9728 | 0,1136 | |||
| KMB / Kimberly-Clark Corporation | 0,01 | -4,73 | 0,86 | 2,86 | 0,9540 | -0,0136 | |||
| C / Citigroup Inc. - Corporate Bond/Note | 0,01 | -4,76 | 0,86 | -18,06 | 0,9529 | -0,2603 | |||
| KO / The Coca-Cola Company | 0,01 | -8,78 | 0,86 | 2,99 | 0,9518 | -0,0124 | |||
| IDXX / IDEXX Laboratories, Inc. | 0,00 | -4,72 | 0,85 | 0,83 | 0,9396 | -0,0326 | |||
| UTHR / United Therapeutics Corporation | 0,00 | -4,76 | 0,85 | 11,58 | 0,9374 | 0,0609 | |||
| CRUS / Cirrus Logic, Inc. | 0,01 | -4,75 | 0,84 | 6,46 | 0,9297 | 0,0186 | |||
| ODFL / Old Dominion Freight Line, Inc. | 0,00 | -4,72 | 0,82 | 19,42 | 0,9109 | 0,1151 | |||
| CSCO / Cisco Systems, Inc. | 0,01 | -4,76 | 0,82 | 10,95 | 0,9075 | 0,0541 | |||
| O / Realty Income Corporation | 0,01 | 0,00 | 0,82 | 10,39 | 0,9042 | 0,0497 | |||
| UPS / United Parcel Service, Inc. | 0,00 | -4,76 | 0,81 | 12,10 | 0,9009 | 0,0625 | |||
| SO / The Southern Company | 0,01 | -6,33 | 0,81 | 3,70 | 0,8976 | -0,0054 | |||
| AEP / American Electric Power Company, Inc. | 0,01 | -7,18 | 0,81 | 1,64 | 0,8899 | -0,0235 | |||
| SRE / Sempra | 0,01 | 70,75 | 0,81 | 78,49 | 0,8899 | 0,3697 | |||
| DECK / Deckers Outdoor Corporation | 0,00 | -4,75 | 0,80 | -3,14 | 0,8854 | -0,0683 | |||
| ED / Consolidated Edison, Inc. | 0,01 | -15,63 | 0,80 | -0,75 | 0,8832 | -0,0451 | |||
| PFH / Prudential Financial, Inc. - Corporate Bond/Note | 0,01 | -10,80 | 0,79 | -8,22 | 0,8766 | -0,1198 | |||
| CC / The Chemours Company | 0,02 | -4,76 | 0,79 | 10,01 | 0,8744 | 0,0452 | |||
| K / Kellanova | 0,01 | -3,18 | 0,79 | -2,36 | 0,8677 | -0,0595 | |||
| PFG / Principal Financial Group, Inc. | 0,01 | -2,73 | 0,77 | 9,32 | 0,8556 | 0,0391 | |||
| VRTX / Vertex Pharmaceuticals Incorporated | 0,00 | 17,15 | 0,77 | 41,76 | 0,8556 | 0,2259 | |||
| ES / Eversource Energy | 0,01 | -8,66 | 0,77 | 1,59 | 0,8490 | -0,0229 | |||
| MAN / ManpowerGroup Inc. | 0,01 | -4,75 | 0,76 | -14,40 | 0,8412 | -0,1840 | |||
| SJM / The J. M. Smucker Company | 0,01 | -6,71 | 0,76 | 5,45 | 0,8346 | 0,0089 | |||
| LRCX / Lam Research Corporation | 0,00 | -32,03 | 0,75 | -14,07 | 0,8302 | -0,1778 | |||
| RHI / Robert Half Inc. | 0,01 | -4,75 | 0,74 | 5,85 | 0,8202 | 0,0118 | |||
| NLOK / NortonLifeLock Inc | 0,03 | -4,76 | 0,74 | -2,26 | 0,8136 | -0,0548 | |||
| CIWV / Citizens Financial Corp. | 0,02 | -4,76 | 0,73 | -4,21 | 0,8047 | -0,0717 | |||
| QCOM / QUALCOMM Incorporated | 0,00 | -4,75 | 0,72 | 34,95 | 0,7981 | 0,1811 | |||
| META / Meta Platforms, Inc. | 0,00 | -4,73 | 0,71 | -5,58 | 0,7859 | -0,0824 | |||
| BNS / The Bank of Nova Scotia | 0,01 | -5,66 | 0,71 | 8,59 | 0,7826 | 0,0307 | |||
| BIO / Bio-Rad Laboratories, Inc. | 0,00 | -4,73 | 0,70 | -3,58 | 0,7738 | -0,0635 | |||
| DE / Deere & Company | 0,00 | -4,75 | 0,68 | -2,44 | 0,7528 | -0,0522 | |||
| WEC / WEC Energy Group, Inc. | 0,01 | -6,69 | 0,68 | 2,73 | 0,7484 | -0,0116 | |||
| ESS / Essex Property Trust, Inc. | 0,00 | 0,00 | 0,67 | 10,05 | 0,7384 | 0,0384 | |||
| CAT / Caterpillar Inc. | 0,00 | 0,66 | 0,7329 | 0,7329 | |||||
| MTD / Mettler-Toledo International Inc. | 0,00 | -4,66 | 0,66 | 17,44 | 0,7296 | 0,0814 | |||
| FCN / FTI Consulting, Inc. | 0,00 | -4,75 | 0,66 | 8,40 | 0,7274 | 0,0273 | |||
| MET / MetLife, Inc. | 0,01 | -4,77 | 0,65 | -3,58 | 0,7152 | -0,0586 | |||
| XEL / Xcel Energy Inc. | 0,01 | -4,14 | 0,63 | 3,97 | 0,6942 | -0,0024 | |||
| PHM / PulteGroup, Inc. | 0,01 | -4,77 | 0,62 | 18,63 | 0,6898 | 0,0832 | |||
| BBY / Best Buy Co., Inc. | 0,01 | -4,76 | 0,61 | -8,55 | 0,6743 | -0,0949 | |||
| RF / Regions Financial Corporation | 0,03 | -4,76 | 0,61 | -2,56 | 0,6721 | -0,0475 | |||
| FRT / Federal Realty Investment Trust | 0,00 | 0,00 | 0,60 | 15,11 | 0,6655 | 0,0623 | |||
| CHKP / Check Point Software Technologies Ltd. | 0,01 | -4,75 | 0,60 | -1,81 | 0,6610 | -0,0413 | |||
| EVRG / Evergy, Inc. | 0,01 | -6,47 | 0,59 | 3,12 | 0,6577 | -0,0077 | |||
| IP / International Paper Company | 0,01 | -4,76 | 0,58 | -19,94 | 0,6433 | -0,1951 | |||
| ATVI / Activision Blizzard Inc | 0,01 | -4,76 | 0,55 | -18,11 | 0,6047 | -0,1657 | |||
| WFC / Wells Fargo & Company | 0,01 | 0,55 | 0,6036 | 0,6036 | |||||
| EA / Electronic Arts Inc. | 0,00 | -4,74 | 0,54 | -11,66 | 0,5947 | -0,1076 | |||
| YELP / Yelp Inc. | 0,01 | -4,76 | 0,53 | -7,36 | 0,5848 | -0,0737 | |||
| ALLY / Ally Financial Inc. | 0,01 | -4,77 | 0,52 | -11,21 | 0,5781 | -0,1011 | |||
| LOGN / Logitech International S.A. | 0,01 | -4,75 | 0,52 | -9,76 | 0,5726 | -0,0894 | |||
| QRVO / Qorvo, Inc. | 0,00 | -4,75 | 0,52 | -10,86 | 0,5715 | -0,0974 | |||
| MAS / Masco Corporation | 0,01 | -4,76 | 0,50 | 20,33 | 0,5560 | 0,0740 | |||
| SYF / Synchrony Financial | 0,01 | -4,76 | 0,50 | -9,53 | 0,5560 | -0,0852 | |||
| WPC / W. P. Carey Inc. | 0,01 | -1,65 | 0,49 | 10,61 | 0,5417 | 0,0308 | |||
| OGE / OGE Energy Corp. | 0,01 | -3,81 | 0,48 | 12,01 | 0,5361 | 0,0368 | |||
| GS.PRJ / Goldman Sachs Group, 5.50% Dep Shares Fixd/Float Non-Cumul Preferred Stock Ser J | 0,00 | -4,69 | 0,47 | -3,51 | 0,5162 | -0,0419 | |||
| HRL / Hormel Foods Corporation | 0,01 | -14,11 | 0,45 | 2,29 | 0,4930 | -0,0098 | |||
| RE / Everest Re Group Ltd | 0,00 | -4,72 | 0,43 | 3,86 | 0,4764 | -0,0022 | |||
| HGH / Hartford Financial Services Group Inc. - FXDFR DB REDEEM 15/04/2042 USD 25 | 0,01 | -4,75 | 0,41 | -6,53 | 0,4587 | -0,0533 | |||
| MRNA / Moderna, Inc. | 0,00 | 0,41 | 0,4587 | 0,4587 | |||||
| EL / The Estée Lauder Companies Inc. | 0,00 | -49,17 | 0,41 | -37,21 | 0,4532 | -0,2998 | |||
| MTG / MGIC Investment Corporation | 0,03 | -4,76 | 0,40 | -8,12 | 0,4377 | -0,0593 | |||
| MFC / HEXAOM | 0,02 | -5,15 | 0,39 | -5,85 | 0,4267 | -0,0461 | |||
| PPL / PPL Corporation | 0,01 | -4,76 | 0,38 | 2,67 | 0,4245 | -0,0068 | |||
| HCC / Warrior Met Coal, Inc. | 0,00 | 0,00 | 0,38 | 22,76 | 0,4234 | 0,0636 | |||
| ROST / Ross Stores, Inc. | 0,00 | -4,73 | 0,36 | 0,00 | 0,3946 | -0,0171 | |||
| XRX / Xerox Holdings Corporation | 0,02 | -4,76 | 0,35 | 6,95 | 0,3913 | 0,0096 | |||
| CUBE / CubeSmart | 0,01 | 0,00 | 0,34 | 17,53 | 0,3781 | 0,0425 | |||
| FNF / Fidelity National Financial, Inc. | 0,01 | -4,76 | 0,33 | 9,57 | 0,3670 | 0,0176 | |||
| CMS / CMS Energy Corporation | 0,00 | 0,32 | 0,3548 | 0,3548 | |||||
| STAG / STAG Industrial, Inc. | 0,01 | -4,32 | 0,32 | 16,85 | 0,3526 | 0,0378 | |||
| TSLA / Tesla, Inc. | 0,00 | -4,44 | 0,32 | 30,33 | 0,3515 | 0,0701 | |||
| TDC / Teradata Corporation | 0,01 | -4,76 | 0,31 | -29,60 | 0,3471 | -0,1672 | |||
| NNN / NNN REIT, Inc. | 0,01 | -2,98 | 0,31 | 7,93 | 0,3460 | 0,0116 | |||
| KGC / Kinross Gold Corporation | 0,05 | -4,86 | 0,31 | 3,02 | 0,3394 | -0,0043 | |||
| ZM / Zoom Communications Inc. | 0,00 | -4,72 | 0,30 | -32,82 | 0,3372 | -0,1864 | |||
| INGR / Ingredion Incorporated | 0,00 | -4,76 | 0,28 | 3,69 | 0,3106 | -0,0019 | |||
| HLF / Herbalife Ltd. | 0,01 | -4,77 | 0,28 | -8,20 | 0,3095 | -0,0422 | |||
| PNW / Pinnacle West Capital Corporation | 0,00 | 0,27 | 0,2996 | 0,2996 | |||||
| LEG / Leggett & Platt, Incorporated | 0,01 | 0,00 | 0,27 | -8,28 | 0,2940 | -0,0404 | |||
| ORI / Old Republic International Corporation | 0,01 | -1,86 | 0,26 | 4,42 | 0,2874 | 0,0002 | |||
| UNM / Unum Group | 0,01 | -4,76 | 0,25 | -6,46 | 0,2719 | -0,0314 | |||
| SWX / Southwest Gas Holdings, Inc. | 0,00 | 0,20 | 0,2222 | 0,2222 | |||||
| FLO / Flowers Foods, Inc. | 0,01 | 0,20 | 0,2211 | 0,2211 | |||||
| CLX / The Clorox Company | 0,00 | -100,00 | 0,00 | -100,00 | -0,6043 | ||||
| TTWO / Take-Two Interactive Software, Inc. | 0,00 | -100,00 | 0,00 | -100,00 | -0,6689 | ||||
| SGEN / Seagen Inc | 0,00 | -100,00 | 0,00 | -100,00 | -0,8269 | ||||
| COR / Cencora, Inc. | 0,00 | -100,00 | 0,00 | -100,00 | -0,4671 | ||||
| PEG / Public Service Enterprise Group Incorporated | 0,00 | -100,00 | 0,00 | -100,00 | -0,3483 | ||||
| ICLR / ICON Public Limited Company | 0,00 | -100,00 | 0,00 | -100,00 | -1,0529 | ||||
| CMA / Comerica Incorporated | 0,00 | -100,00 | 0,00 | -100,00 | -1,0229 |