Grundlæggende statistik
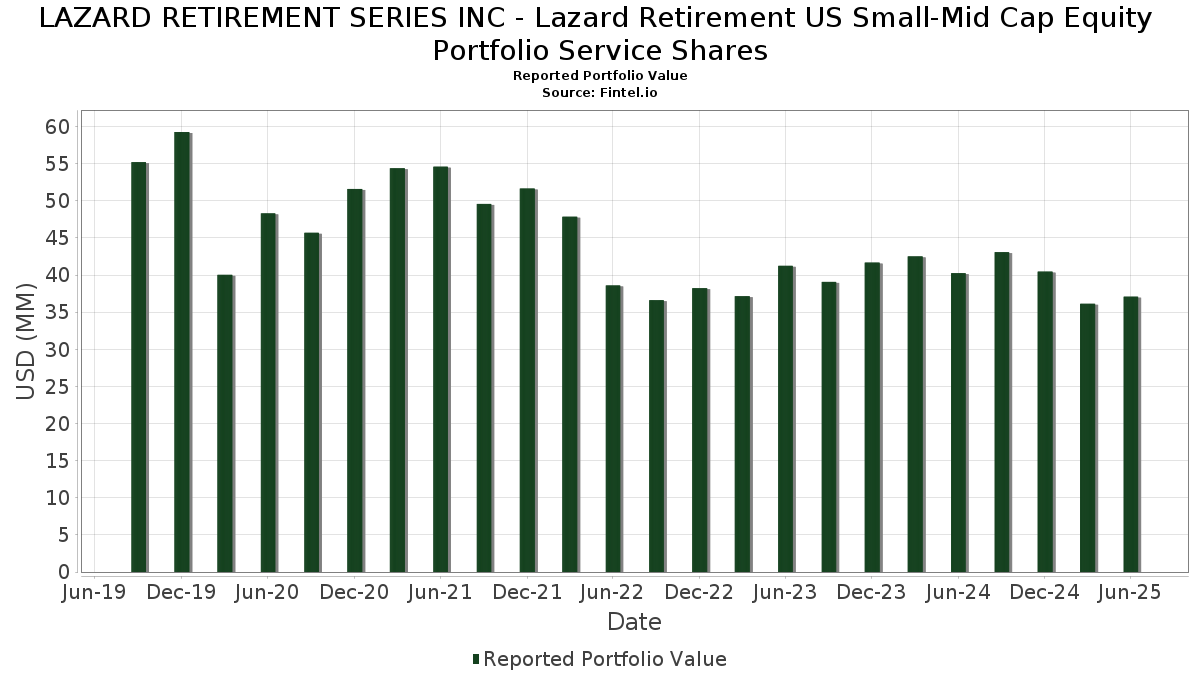
| Porteføljeværdi | $ 37.081.496 |
| Nuværende stillinger | 76 |
Seneste beholdninger, ydeevne, AUM (fra 13F, 13D)
LAZARD RETIREMENT SERIES INC - Lazard Retirement US Small-Mid Cap Equity Portfolio Service Shares har afsløret 76 samlede besiddelser i deres seneste SEC-arkivering. Den seneste porteføljeværdi er beregnet til at være $ 37.081.496 USD. Faktiske aktiver under forvaltning (AUM) er denne værdi plus kontanter (som ikke er oplyst). LAZARD RETIREMENT SERIES INC - Lazard Retirement US Small-Mid Cap Equity Portfolio Service Sharess største beholdninger er BankUnited, Inc. (US:BKU) , CubeSmart (US:CUBE) , ABM Industries Incorporated (US:ABM) , First American Financial Corporation (US:FAF) , and Reinsurance Group of America, Incorporated (US:RGA) . LAZARD RETIREMENT SERIES INC - Lazard Retirement US Small-Mid Cap Equity Portfolio Service Sharess nye stillinger omfatter Doximity, Inc. (US:DOCS) , Caris Life Sciences, Inc. (US:CAI) , Kontoor Brands, Inc. (US:KTB) , The J. M. Smucker Company (US:SJM) , and Rambus Inc. (US:RMBS) .
Top øger dette kvartal
Vi bruger ændringen i porteføljeallokeringen, fordi dette er den mest meningsfulde metrik. Ændringer kan skyldes handler eller ændringer i aktiekurser.
| Sikkerhed | Aktier (MM) |
Værdi (MM$) |
Portefølje % | ΔPortefølje % |
|---|---|---|---|---|
| 0,64 | 1,7296 | 1,7296 | ||
| 0,02 | 0,87 | 2,3463 | 1,3807 | |
| 0,01 | 0,43 | 1,1641 | 1,1641 | |
| 0,01 | 0,38 | 1,0301 | 1,0301 | |
| 0,01 | 0,34 | 0,9135 | 0,9135 | |
| 0,00 | 0,30 | 0,8179 | 0,8179 | |
| 0,00 | 0,22 | 0,5962 | 0,5962 | |
| 0,00 | 0,21 | 0,5658 | 0,5658 | |
| 0,00 | 0,59 | 1,5958 | 0,5298 | |
| 0,01 | 0,42 | 1,1322 | 0,4899 |
Top falder i dette kvartal
Vi bruger ændringen i porteføljeallokeringen, fordi dette er den mest meningsfulde metrik. Ændringer kan skyldes handler eller ændringer i aktiekurser.
| Sikkerhed | Aktier (MM) |
Værdi (MM$) |
Portefølje % | ΔPortefølje % |
|---|---|---|---|---|
| 0,00 | 0,00 | -1,1086 | ||
| 0,00 | 0,43 | 1,1709 | -0,9688 | |
| 0,02 | 0,08 | 0,2098 | -0,8612 | |
| 0,01 | 0,20 | 0,5303 | -0,7680 | |
| 0,00 | 0,36 | 0,9863 | -0,6123 | |
| 0,04 | 0,38 | 1,0247 | -0,5229 | |
| 0,03 | 0,45 | 1,2243 | -0,4592 | |
| 0,03 | 0,34 | 0,9179 | -0,3516 | |
| 0,02 | 0,44 | 1,1782 | -0,3398 | |
| 0,03 | 0,35 | 0,9529 | -0,3087 |
13F og Fondsarkivering
Denne formular blev indsendt den 2025-08-21 for rapporteringsperioden 2025-06-30. Klik på linkikonet for at se den fulde transaktionshistorik.
Opgrader for at låse op for premium-data og eksportere til Excel ![]() .
.
| Sikkerhed | Type | Gennemsnitlig aktiekurs | Aktier (MM) |
Δ Aktier (%) |
Δ Aktier (%) |
Værdi ($MM) |
Portefølje (%) |
ΔPortefølje (%) |
|
|---|---|---|---|---|---|---|---|---|---|
| BKU / BankUnited, Inc. | 0,03 | -1,90 | 0,90 | 1,35 | 2,4428 | -0,0292 | |||
| CUBE / CubeSmart | 0,02 | 10,02 | 0,87 | 9,57 | 2,3513 | 0,1481 | |||
| ABM / ABM Industries Incorporated | 0,02 | 150,07 | 0,87 | 149,43 | 2,3463 | 1,3807 | |||
| FAF / First American Financial Corporation | 0,01 | 6,67 | 0,86 | -0,23 | 2,3360 | -0,0658 | |||
| RGA / Reinsurance Group of America, Incorporated | 0,00 | 16,69 | 0,84 | 17,55 | 2,2821 | 0,2907 | |||
| WTFC / Wintrust Financial Corporation | 0,01 | -1,90 | 0,83 | 8,19 | 2,2503 | 0,1158 | |||
| STEP / StepStone Group Inc. | 0,01 | -1,90 | 0,82 | 4,22 | 2,2032 | 0,0349 | |||
| CWST / Casella Waste Systems, Inc. | 0,01 | 17,22 | 0,79 | 21,22 | 2,1485 | 0,3312 | |||
| MIDD / The Middleby Corporation | 0,01 | 18,50 | 0,73 | 12,27 | 1,9797 | 0,1708 | |||
| BRX / Brixmor Property Group Inc. | 0,03 | 30,93 | 0,72 | 28,47 | 1,9532 | 0,3928 | |||
| COHR / Coherent Corp. | 0,01 | -16,60 | 0,71 | 14,52 | 1,9213 | 0,2010 | |||
| SF / Stifel Financial Corp. | 0,01 | -1,91 | 0,68 | 8,00 | 1,8267 | 0,0915 | |||
| DOCN / DigitalOcean Holdings, Inc. | 0,02 | 12,23 | 0,66 | -4,05 | 1,7945 | -0,1232 | |||
| HOMB / Home Bancshares, Inc. (Conway, AR) | 0,02 | -1,90 | 0,66 | -1,20 | 1,7734 | -0,0687 | |||
| CROX / Crocs, Inc. | 0,01 | -1,34 | 0,65 | -5,82 | 1,7490 | -0,1580 | |||
| FIXED INC CLEARING CORP.REPO / RA (000000000) | 0,64 | 1,7296 | 1,7296 | ||||||
| ENOV / Enovis Corporation | 0,02 | 47,69 | 0,63 | 21,39 | 1,7034 | 0,2618 | |||
| TTC / The Toro Company | 0,01 | -1,90 | 0,60 | -4,75 | 1,6294 | -0,1244 | |||
| SPSC / SPS Commerce, Inc. | 0,00 | 49,78 | 0,59 | 53,65 | 1,5958 | 0,5298 | |||
| EXP / Eagle Materials Inc. | 0,00 | 48,35 | 0,57 | 34,99 | 1,5452 | 0,3719 | |||
| WH / Wyndham Hotels & Resorts, Inc. | 0,01 | 17,91 | 0,57 | 5,75 | 1,5418 | 0,0468 | |||
| ROKU / Roku, Inc. | 0,01 | -8,04 | 0,57 | 14,92 | 1,5408 | 0,1633 | |||
| LNTH / Lantheus Holdings, Inc. | 0,01 | 16,68 | 0,56 | -2,26 | 1,5210 | -0,0733 | |||
| THO / THOR Industries, Inc. | 0,01 | -1,89 | 0,56 | 15,08 | 1,5059 | 0,1618 | |||
| RYTM / Rhythm Pharmaceuticals, Inc. | 0,01 | -4,35 | 0,55 | 14,02 | 1,4960 | 0,1511 | |||
| JBI / Janus International Group, Inc. | 0,07 | 23,21 | 0,55 | 39,49 | 1,4896 | 0,3926 | |||
| INSP / Inspire Medical Systems, Inc. | 0,00 | 50,87 | 0,55 | 23,09 | 1,4842 | 0,2455 | |||
| FWRG / First Watch Restaurant Group, Inc. | 0,03 | 7,28 | 0,54 | 3,44 | 1,4661 | 0,0109 | |||
| EVH / Evolent Health, Inc. | 0,05 | 9,12 | 0,54 | 29,88 | 1,4573 | 0,3051 | |||
| CBSH / Commerce Bancshares, Inc. | 0,01 | -1,91 | 0,54 | -2,01 | 1,4517 | -0,0680 | |||
| VRRM / Verra Mobility Corporation | 0,02 | -1,90 | 0,53 | 10,71 | 1,4257 | 0,1039 | |||
| GRDN / Guardian Pharmacy Services, Inc. | 0,02 | 16,74 | 0,52 | 17,08 | 1,4100 | 0,1738 | |||
| AR / Antero Resources Corporation | 0,01 | -1,02 | 0,51 | -1,35 | 1,3864 | -0,0562 | |||
| CHEF / The Chefs' Warehouse, Inc. | 0,01 | -16,48 | 0,51 | -2,11 | 1,3831 | -0,0669 | |||
| GTES / Gates Industrial Corporation plc | 0,02 | -27,41 | 0,50 | -9,19 | 1,3621 | -0,1766 | |||
| ARQT / Arcutis Biotherapeutics, Inc. | 0,03 | 4,33 | 0,48 | -6,38 | 1,3093 | -0,1268 | |||
| HAYW / Hayward Holdings, Inc. | 0,03 | 40,34 | 0,48 | 39,24 | 1,2968 | 0,3406 | |||
| THRM / Gentherm Incorporated | 0,02 | 24,52 | 0,47 | 31,83 | 1,2656 | 0,2801 | |||
| SARO / StandardAero, Inc. | 0,01 | 29,65 | 0,47 | 54,49 | 1,2567 | 0,4197 | |||
| ZETA / Zeta Global Holdings Corp. | 0,03 | -34,69 | 0,45 | -25,37 | 1,2243 | -0,4592 | |||
| GPK / Graphic Packaging Holding Company | 0,02 | -1,90 | 0,44 | -20,48 | 1,1782 | -0,3398 | |||
| LSTR / Landstar System, Inc. | 0,00 | -1,92 | 0,43 | -9,21 | 1,1733 | -0,1525 | |||
| BJ / BJ's Wholesale Club Holdings, Inc. | 0,00 | -40,60 | 0,43 | -43,84 | 1,1709 | -0,9688 | |||
| DOCS / Doximity, Inc. | 0,01 | 0,43 | 1,1641 | 1,1641 | |||||
| SMPL / The Simply Good Foods Company | 0,01 | -48,77 | 0,42 | -16,07 | 1,1445 | -0,1146 | |||
| WHD / Cactus, Inc. | 0,01 | 89,55 | 0,42 | 80,95 | 1,1322 | 0,4899 | |||
| KRUS / Kura Sushi USA, Inc. | 0,00 | -35,35 | 0,42 | 8,85 | 1,1297 | 0,0635 | |||
| ENS / EnerSys | 0,00 | -0,43 | 0,42 | -6,73 | 1,1256 | -0,1127 | |||
| CARS / Cars.com Inc. | 0,03 | -20,34 | 0,41 | -16,40 | 1,1184 | -0,2514 | |||
| MAX / MediaAlpha, Inc. | 0,04 | 3,63 | 0,41 | 0,49 | 1,1153 | 0,0989 | |||
| NDSN / Nordson Corporation | 0,00 | -1,94 | 0,41 | 4,06 | 1,1100 | 0,0172 | |||
| GNRC / Generac Holdings Inc. | 0,00 | -1,89 | 0,41 | 10,90 | 1,1023 | 0,0829 | |||
| ALGM / Allegro MicroSystems, Inc. | 0,01 | -40,71 | 0,39 | -19,30 | 1,0634 | -0,2891 | |||
| DRVN / Driven Brands Holdings Inc. | 0,02 | -2,39 | 0,38 | 0,00 | 1,0306 | -0,0266 | |||
| CAI / Caris Life Sciences, Inc. | 0,01 | 0,38 | 1,0301 | 1,0301 | |||||
| AUPH / Aurinia Pharmaceuticals Inc. | 0,04 | -35,53 | 0,38 | -32,08 | 1,0247 | -0,5229 | |||
| ONTO / Onto Innovation Inc. | 0,00 | -23,91 | 0,36 | -36,81 | 0,9863 | -0,6123 | |||
| MGY / Magnolia Oil & Gas Corporation | 0,02 | -1,90 | 0,36 | -12,53 | 0,9815 | -0,1718 | |||
| DBRG / DigitalBridge Group, Inc. | 0,03 | -33,97 | 0,35 | -22,64 | 0,9529 | -0,3087 | |||
| AESI / Atlas Energy Solutions Inc. | 0,03 | -1,02 | 0,34 | -25,82 | 0,9179 | -0,3516 | |||
| KTB / Kontoor Brands, Inc. | 0,01 | 0,34 | 0,9135 | 0,9135 | |||||
| CRDO / Credo Technology Group Holding Ltd | 0,00 | -19,56 | 0,33 | 85,39 | 0,8923 | 0,3987 | |||
| AXSM / Axsome Therapeutics, Inc. | 0,00 | -1,90 | 0,33 | -12,30 | 0,8890 | -0,1496 | |||
| MIR / Mirion Technologies, Inc. | 0,01 | -25,46 | 0,32 | 10,53 | 0,8533 | 0,0624 | |||
| SJM / The J. M. Smucker Company | 0,00 | 0,30 | 0,8179 | 0,8179 | |||||
| FND / Floor & Decor Holdings, Inc. | 0,00 | 26,99 | 0,30 | -19,95 | 0,8027 | 0,0512 | |||
| BC / Brunswick Corporation | 0,01 | 4,00 | 0,29 | -31,38 | 0,7921 | -0,2023 | |||
| TRS / TriMas Corporation | 0,01 | -35,79 | 0,28 | -19,35 | 0,7442 | -0,0048 | |||
| PCVX / Vaxcyte, Inc. | 0,01 | 19,86 | 0,25 | 3,31 | 0,6761 | 0,0040 | |||
| JANX / Janux Therapeutics, Inc. | 0,01 | 61,10 | 0,25 | 37,78 | 0,6712 | 0,1717 | |||
| MRVI / Maravai LifeSciences Holdings, Inc. | 0,10 | -1,90 | 0,24 | 6,64 | 0,6539 | 0,0268 | |||
| RMBS / Rambus Inc. | 0,00 | 0,22 | 0,5962 | 0,5962 | |||||
| SLNO / Soleno Therapeutics, Inc. | 0,00 | 0,21 | 0,5658 | 0,5658 | |||||
| SDGR / Schrödinger, Inc. | 0,01 | -58,89 | 0,20 | -58,12 | 0,5303 | -0,7680 | |||
| ABL / Abacus Global Management, Inc. | 0,02 | -70,72 | 0,08 | -80,05 | 0,2098 | -0,8612 | |||
| TPVXX / State Street Institutional Investment Trust - State Street Institutional Treasury Plus Fund Investment Class | 0,04 | 97,98 | 0,04 | 95,45 | 0,1188 | 0,0572 | |||
| CGNX / Cognex Corporation | 0,00 | -100,00 | 0,00 | -100,00 | -1,1086 |