Grundlæggende statistik
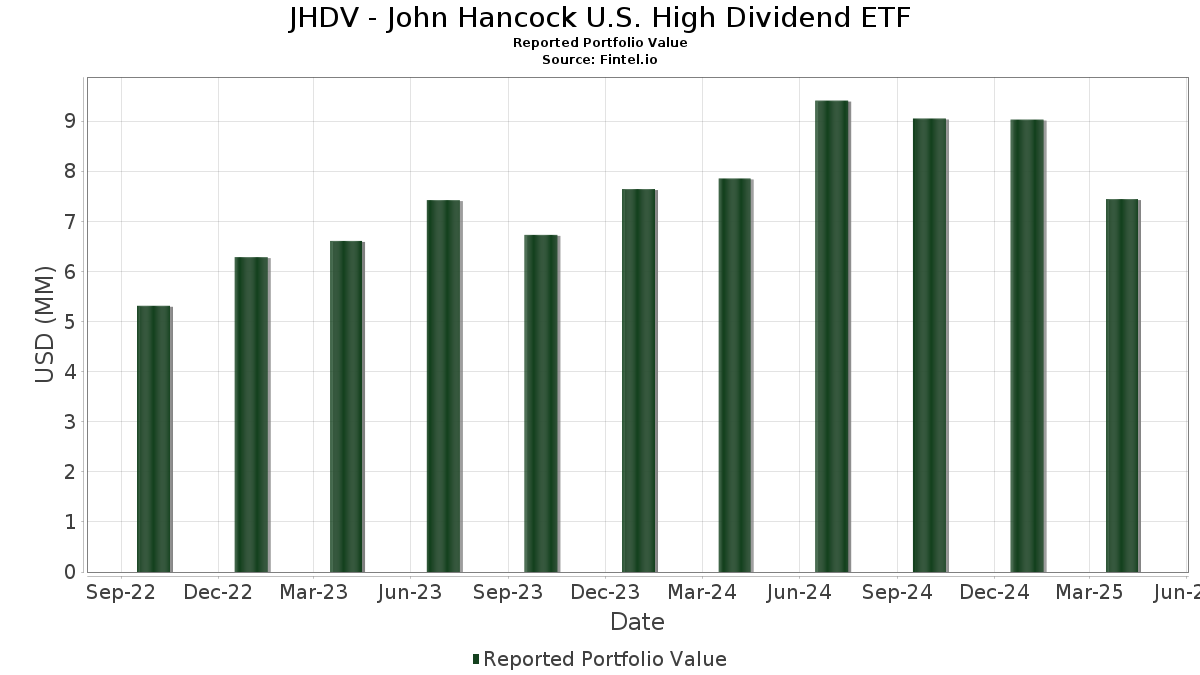
| Porteføljeværdi | $ 7.443.233 |
| Nuværende stillinger | 83 |
Seneste beholdninger, ydeevne, AUM (fra 13F, 13D)
JHDV - John Hancock U.S. High Dividend ETF har afsløret 83 samlede besiddelser i deres seneste SEC-arkivering. Den seneste porteføljeværdi er beregnet til at være $ 7.443.233 USD. Faktiske aktiver under forvaltning (AUM) er denne værdi plus kontanter (som ikke er oplyst). JHDV - John Hancock U.S. High Dividend ETFs største beholdninger er Microsoft Corporation (US:MSFT) , Apple Inc. (US:AAPL) , NVIDIA Corporation (US:NVDA) , Intuit Inc. (US:INTU) , and CME Group Inc. (US:CME) . JHDV - John Hancock U.S. High Dividend ETFs nye stillinger omfatter S&P Global Inc. (US:SPGI) , Walmart Inc. (US:WMT) , JPMorgan Chase & Co. (US:JPM) , NRG Energy, Inc. (US:NRG) , and Texas Roadhouse, Inc. (US:TXRH) .
Top øger dette kvartal
Vi bruger ændringen i porteføljeallokeringen, fordi dette er den mest meningsfulde metrik. Ændringer kan skyldes handler eller ændringer i aktiekurser.
| Sikkerhed | Aktier (MM) |
Værdi (MM$) |
Portefølje % | ΔPortefølje % |
|---|---|---|---|---|
| 0,00 | 0,14 | 1,9193 | 1,9193 | |
| 0,01 | 0,14 | 1,8760 | 1,8760 | |
| 0,00 | 0,11 | 1,5404 | 1,5404 | |
| 0,00 | 0,10 | 1,4117 | 1,4117 | |
| 0,00 | 0,05 | 0,6368 | 0,6368 | |
| 0,00 | 0,44 | 5,9633 | 0,4450 | |
| 0,00 | 0,03 | 0,3925 | 0,3925 | |
| 0,01 | 0,11 | 1,4925 | 0,3907 | |
| 0,00 | 0,10 | 1,3558 | 0,3702 | |
| 0,00 | 0,46 | 6,2768 | 0,3413 |
Top falder i dette kvartal
Vi bruger ændringen i porteføljeallokeringen, fordi dette er den mest meningsfulde metrik. Ændringer kan skyldes handler eller ændringer i aktiekurser.
| Sikkerhed | Aktier (MM) |
Værdi (MM$) |
Portefølje % | ΔPortefølje % |
|---|---|---|---|---|
| 0,00 | 0,05 | 0,6618 | -1,2151 | |
| 0,00 | 0,03 | 0,4240 | -0,5478 | |
| 0,00 | 0,09 | 1,2005 | -0,5362 | |
| 0,00 | 0,00 | -0,4836 | ||
| 0,00 | 0,02 | 0,2317 | -0,4568 | |
| 0,00 | 0,13 | 1,7209 | -0,3554 | |
| 0,00 | 0,12 | 1,6185 | -0,3510 | |
| 0,00 | 0,09 | 1,1908 | -0,3499 | |
| 0,00 | 0,46 | 6,1919 | -0,3480 | |
| 0,00 | 0,14 | 1,9184 | -0,3222 |
13F og Fondsarkivering
Denne formular blev indsendt den 2025-06-26 for rapporteringsperioden 2025-04-30. Klik på linkikonet for at se den fulde transaktionshistorik.
Opgrader for at låse op for premium-data og eksportere til Excel ![]() .
.
| Sikkerhed | Type | Gennemsnitlig aktiekurs | Aktier (MM) |
Δ Aktier (%) |
Δ Aktier (%) |
Værdi ($MM) |
Portefølje (%) |
ΔPortefølje (%) |
|
|---|---|---|---|---|---|---|---|---|---|
| MSFT / Microsoft Corporation | 0,00 | -8,63 | 0,46 | -12,95 | 6,2768 | 0,3413 | |||
| AAPL / Apple Inc. | 0,00 | -13,48 | 0,46 | -22,11 | 6,1919 | -0,3480 | |||
| NVDA / NVIDIA Corporation | 0,00 | -1,98 | 0,44 | -11,09 | 5,9633 | 0,4450 | |||
| INTU / Intuit Inc. | 0,00 | -21,19 | 0,15 | -17,68 | 2,0183 | -0,0017 | |||
| CME / CME Group Inc. | 0,00 | -31,67 | 0,15 | -20,11 | 1,9959 | -0,0555 | |||
| PM / Philip Morris International Inc. | 0,00 | -40,66 | 0,15 | -21,81 | 1,9940 | -0,1068 | |||
| OMF / OneMain Holdings, Inc. | 0,00 | -0,19 | 0,15 | -15,52 | 1,9937 | 0,0544 | |||
| MO / Altria Group, Inc. | 0,00 | -31,75 | 0,14 | -22,70 | 1,9330 | -0,1248 | |||
| SPG / Simon Property Group, Inc. | 0,00 | -11,93 | 0,14 | -20,67 | 1,9313 | -0,0620 | |||
| BMY / Bristol-Myers Squibb Company | 0,00 | -8,87 | 0,14 | -22,40 | 1,9227 | -0,1160 | |||
| SPGI / S&P Global Inc. | 0,00 | 0,14 | 1,9193 | 1,9193 | |||||
| IBM / International Business Machines Corporation | 0,00 | -25,51 | 0,14 | -29,85 | 1,9184 | -0,3222 | |||
| CMCSA / Comcast Corporation | 0,00 | -13,23 | 0,14 | -11,95 | 1,9043 | 0,1271 | |||
| BLK / BlackRock, Inc. | 0,00 | -12,00 | 0,14 | -25,53 | 1,9029 | -0,1901 | |||
| VZ / Verizon Communications Inc. | 0,00 | -31,10 | 0,14 | -23,20 | 1,8918 | -0,1279 | |||
| JH COLLATERAL / STIV (N/A) | 0,01 | 0,14 | 1,8760 | 1,8760 | |||||
| VICI / VICI Properties Inc. | 0,00 | -23,37 | 0,14 | -17,96 | 1,8647 | 0,0033 | |||
| GLPI / Gaming and Leisure Properties, Inc. | 0,00 | -19,29 | 0,14 | -20,12 | 1,8299 | -0,0562 | |||
| LLY / Eli Lilly and Company | 0,00 | -23,53 | 0,13 | -15,23 | 1,7374 | 0,0507 | |||
| TROW / T. Rowe Price Group, Inc. | 0,00 | -9,96 | 0,13 | -31,72 | 1,7209 | -0,3554 | |||
| PFE / Pfizer Inc. | 0,00 | -18,84 | 0,12 | -22,73 | 1,6185 | -0,3510 | |||
| PAYX / Paychex, Inc. | 0,00 | -12,99 | 0,12 | -13,33 | 1,5847 | 0,0805 | |||
| UPS / United Parcel Service, Inc. | 0,00 | -10,89 | 0,11 | -25,97 | 1,5494 | -0,1654 | |||
| WMT / Walmart Inc. | 0,00 | 0,11 | 1,5404 | 1,5404 | |||||
| ORCL / Oracle Corporation | 0,00 | -6,77 | 0,11 | -22,76 | 1,5196 | -0,1011 | |||
| COST / Costco Wholesale Corporation | 0,00 | -20,57 | 0,11 | 58,57 | 1,5054 | 0,1799 | |||
| F / Ford Motor Company | 0,01 | 12,24 | 0,11 | 11,11 | 1,4925 | 0,3907 | |||
| CSCO / Cisco Systems, Inc. | 0,00 | -18,68 | 0,11 | -22,70 | 1,4809 | -0,0920 | |||
| LYB / LyondellBasell Industries N.V. | 0,00 | -9,44 | 0,11 | -30,52 | 1,4562 | -0,2644 | |||
| ACN / Accenture plc | 0,00 | -8,70 | 0,11 | -29,33 | 1,4434 | -0,2304 | |||
| JPM / JPMorgan Chase & Co. | 0,00 | 0,10 | 1,4117 | 1,4117 | |||||
| AFG / American Financial Group, Inc. | 0,00 | 22,03 | 0,10 | 13,64 | 1,3558 | 0,3702 | |||
| QCOM / QUALCOMM Incorporated | 0,00 | -9,65 | 0,10 | -22,76 | 1,2962 | -0,0788 | |||
| KHC / The Kraft Heinz Company | 0,00 | -14,12 | 0,10 | -15,93 | 1,2845 | 0,0226 | |||
| FTXP / Foothills Exploration, Inc. | 0,00 | -30,69 | 0,09 | -33,81 | 1,2441 | -0,3075 | |||
| WMB / The Williams Companies, Inc. | 0,00 | -17,67 | 0,09 | -12,75 | 1,2064 | 0,0654 | |||
| TXN / Texas Instruments Incorporated | 0,00 | -34,40 | 0,09 | -43,59 | 1,2005 | -0,5362 | |||
| VRT / Vertiv Holdings Co | 0,00 | -12,84 | 0,09 | -36,23 | 1,1908 | -0,3499 | |||
| LRCX / Lam Research Corporation | 0,00 | -4,03 | 0,09 | -14,71 | 1,1778 | 0,0359 | |||
| WSO / Watsco, Inc. | 0,00 | -14,42 | 0,08 | -18,18 | 1,1062 | -0,0007 | |||
| SBUX / Starbucks Corporation | 0,00 | -4,03 | 0,08 | -29,46 | 1,0808 | -0,1657 | |||
| JNJ / Johnson & Johnson | 0,00 | -17,64 | 0,08 | -15,96 | 1,0753 | 0,0297 | |||
| GRMN / Garmin Ltd. | 0,00 | 23,49 | 0,07 | 7,46 | 0,9824 | 0,2264 | |||
| VST / Vistra Corp. | 0,00 | 23,27 | 0,07 | -4,17 | 0,9373 | 0,1264 | |||
| ADP / Automatic Data Processing, Inc. | 0,00 | -13,16 | 0,06 | -14,49 | 0,8044 | 0,0362 | |||
| ROK / Rockwell Automation, Inc. | 0,00 | -10,49 | 0,06 | -20,27 | 0,8000 | -0,0266 | |||
| HD / The Home Depot, Inc. | 0,00 | -12,97 | 0,06 | -23,68 | 0,7844 | -0,0631 | |||
| AMCR / Amcor plc | 0,01 | -17,12 | 0,06 | -21,92 | 0,7771 | -0,0380 | |||
| ABT / Abbott Laboratories | 0,00 | -16,74 | 0,05 | -15,25 | 0,6856 | 0,0227 | |||
| SO / The Southern Company | 0,00 | -17,69 | 0,05 | -9,26 | 0,6644 | 0,0576 | |||
| OKE / ONEOK, Inc. | 0,00 | -65,69 | 0,05 | -71,43 | 0,6618 | -1,2151 | |||
| MPWR / Monolithic Power Systems, Inc. | 0,00 | -5,75 | 0,05 | -12,73 | 0,6573 | 0,0407 | |||
| BBY / Best Buy Co., Inc. | 0,00 | -10,70 | 0,05 | -31,88 | 0,6471 | -0,1205 | |||
| DKS / DICK'S Sporting Goods, Inc. | 0,00 | -3,07 | 0,05 | -24,19 | 0,6419 | -0,0548 | |||
| NRG / NRG Energy, Inc. | 0,00 | 0,05 | 0,6368 | 0,6368 | |||||
| KMI / Kinder Morgan, Inc. | 0,00 | -17,18 | 0,05 | -21,05 | 0,6185 | -0,0235 | |||
| FNF / Fidelity National Financial, Inc. | 0,00 | -14,55 | 0,04 | -6,38 | 0,6051 | 0,0760 | |||
| OMC / Omnicom Group Inc. | 0,00 | -4,07 | 0,04 | -15,91 | 0,5095 | 0,0115 | |||
| MDT / Medtronic plc | 0,00 | 54,39 | 0,04 | 48,00 | 0,5040 | 0,2162 | |||
| UNH / UnitedHealth Group Incorporated | 0,00 | -10,64 | 0,03 | -37,04 | 0,4671 | -0,1100 | |||
| WSM / Williams-Sonoma, Inc. | 0,00 | -4,00 | 0,03 | -29,79 | 0,4509 | -0,0779 | |||
| XOM / Exxon Mobil Corporation | 0,00 | -63,69 | 0,03 | -64,37 | 0,4240 | -0,5478 | |||
| EVR / Evercore Inc. | 0,00 | -3,82 | 0,03 | -33,33 | 0,4189 | -0,0896 | |||
| MS / Morgan Stanley | 0,00 | -12,00 | 0,03 | -26,83 | 0,4118 | -0,0500 | |||
| PFG / Principal Financial Group, Inc. | 0,00 | -3,98 | 0,03 | -14,29 | 0,4109 | 0,0194 | |||
| DUK / Duke Energy Corporation | 0,00 | -18,00 | 0,03 | -9,09 | 0,4057 | 0,0321 | |||
| TXRH / Texas Roadhouse, Inc. | 0,00 | 0,03 | 0,3925 | 0,3925 | |||||
| TGT / Target Corporation | 0,00 | -4,08 | 0,03 | -32,50 | 0,3685 | -0,0823 | |||
| HLI / Houlihan Lokey, Inc. | 0,00 | -5,52 | 0,02 | -17,24 | 0,3373 | 0,0080 | |||
| DRI / Darden Restaurants, Inc. | 0,00 | -16,55 | 0,02 | -14,81 | 0,3146 | 0,0128 | |||
| UNP / Union Pacific Corporation | 0,00 | -13,01 | 0,02 | -23,33 | 0,3119 | -0,0271 | |||
| CUBE / CubeSmart | 0,00 | -15,98 | 0,02 | -18,52 | 0,3034 | -0,0012 | |||
| WING / Wingstop Inc. | 0,00 | -1,16 | 0,02 | -12,00 | 0,3032 | 0,0183 | |||
| ETN / Eaton Corporation plc | 0,00 | 8,57 | 0,02 | 0,00 | 0,3024 | 0,0483 | |||
| PSA / Public Storage | 0,00 | -18,89 | 0,02 | -19,23 | 0,2964 | -0,0023 | |||
| HBAN / Huntington Bancshares Incorporated | 0,00 | -13,08 | 0,02 | -27,59 | 0,2961 | -0,0357 | |||
| ADI / Analog Devices, Inc. | 0,00 | -4,27 | 0,02 | -12,50 | 0,2950 | 0,0194 | |||
| CFG / Citizens Financial Group, Inc. | 0,00 | -4,01 | 0,02 | -25,93 | 0,2742 | -0,0289 | |||
| FIX / Comfort Systems USA, Inc. | 0,00 | 24,39 | 0,02 | 17,65 | 0,2740 | 0,0749 | |||
| USB / U.S. Bancorp | 0,00 | -3,97 | 0,02 | -20,83 | 0,2639 | -0,0039 | |||
| EMR / Emerson Electric Co. | 0,00 | 0,02 | 0,2628 | 0,2628 | |||||
| PKG / Packaging Corporation of America | 0,00 | -3,81 | 0,02 | -18,18 | 0,2534 | 0,0051 | |||
| CVX / Chevron Corporation | 0,00 | -69,64 | 0,02 | -72,13 | 0,2317 | -0,4568 | |||
| JHG / Janus Henderson Group plc | 0,00 | -100,00 | 0,00 | -100,00 | -0,4836 | ||||
| PEGA / Pegasystems Inc. | 0,00 | -100,00 | 0,00 | -100,00 | -0,2529 |