Grundlæggende statistik
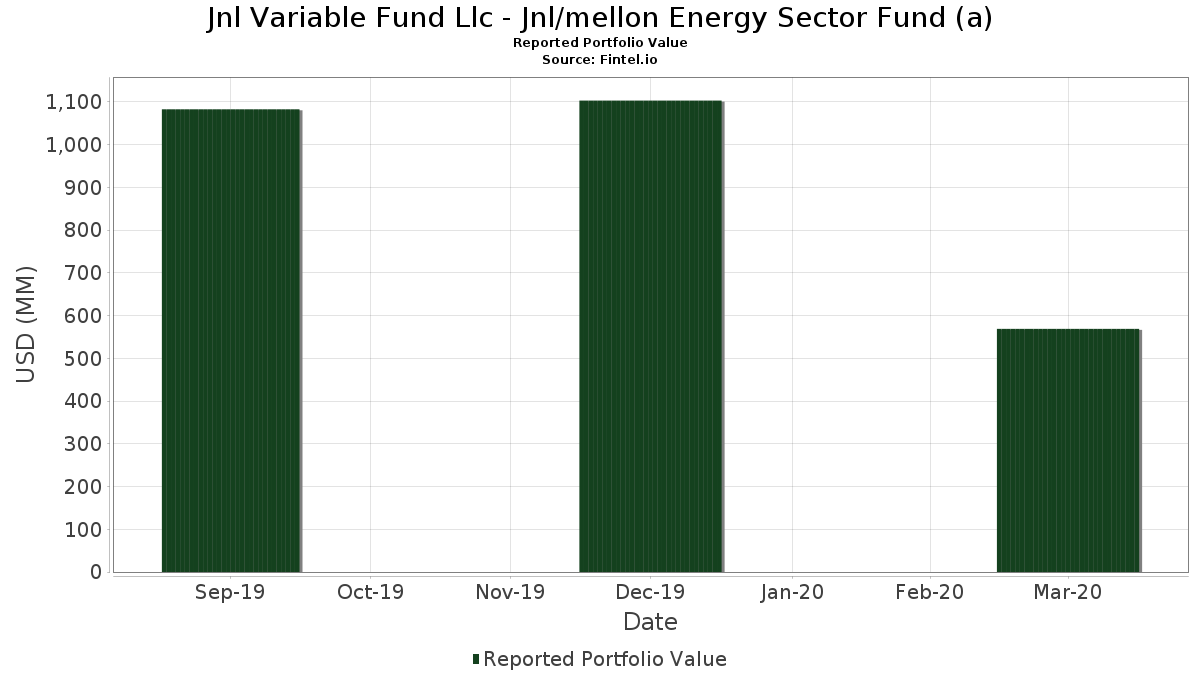
| Porteføljeværdi | $ 568.789.587 |
| Nuværende stillinger | 122 |
Seneste beholdninger, ydeevne, AUM (fra 13F, 13D)
Jnl Variable Fund Llc - Jnl/mellon Energy Sector Fund (a) har afsløret 122 samlede besiddelser i deres seneste SEC-arkivering. Den seneste porteføljeværdi er beregnet til at være $ 568.789.587 USD. Faktiske aktiver under forvaltning (AUM) er denne værdi plus kontanter (som ikke er oplyst). Jnl Variable Fund Llc - Jnl/mellon Energy Sector Fund (a)s største beholdninger er Exxon Mobil Corporation (US:XOM) , Chevron Corporation (US:CVX) , ConocoPhillips (US:COP) , Kinder Morgan, Inc. (US:KMI) , and Phillips 66 (US:PSX) . Jnl Variable Fund Llc - Jnl/mellon Energy Sector Fund (a)s nye stillinger omfatter United States Treasury Bill (US:US912796SV23) , 02/21 0.00000 (US:US912796XE43) , Denbury Resources, Inc. (US:) , TREASURY BILL 12/20 0.00000 (US:US912796TY52) , and .
Top øger dette kvartal
Vi bruger ændringen i porteføljeallokeringen, fordi dette er den mest meningsfulde metrik. Ændringer kan skyldes handler eller ændringer i aktiekurser.
| Sikkerhed | Aktier (MM) |
Værdi (MM$) |
Portefølje % | ΔPortefølje % |
|---|---|---|---|---|
| 1,67 | 120,83 | 21,8913 | 4,4815 | |
| 3,73 | 141,68 | 25,6678 | 3,2005 | |
| 15,56 | 15,56 | 2,8192 | 1,4992 | |
| 1,80 | 25,05 | 4,5375 | 1,2534 | |
| 8,56 | 8,56 | 1,5502 | 1,2264 | |
| 1,07 | 15,15 | 2,7445 | 0,5624 | |
| 0,36 | 6,21 | 1,1252 | 0,5401 | |
| 0,20 | 6,80 | 1,2317 | 0,1576 | |
| 0,14 | 2,33 | 0,4229 | 0,1548 | |
| 0,23 | 1,62 | 0,2936 | 0,0811 |
Top falder i dette kvartal
Vi bruger ændringen i porteføljeallokeringen, fordi dette er den mest meningsfulde metrik. Ændringer kan skyldes handler eller ændringer i aktiekurser.
| Sikkerhed | Aktier (MM) |
Værdi (MM$) |
Portefølje % | ΔPortefølje % |
|---|---|---|---|---|
| 1,22 | 16,49 | 2,9879 | -1,2447 | |
| 0,79 | 9,11 | 1,6499 | -1,1572 | |
| 0,36 | 7,93 | 1,4375 | -0,9425 | |
| 0,78 | 5,33 | 0,9657 | -0,6587 | |
| 0,57 | 13,49 | 2,4446 | -0,5757 | |
| 0,34 | 1,40 | 0,2537 | -0,4757 | |
| 0,21 | 1,44 | 0,2617 | -0,4575 | |
| 0,13 | 3,50 | 0,6346 | -0,4523 | |
| 0,42 | 2,56 | 0,4645 | -0,4365 | |
| 0,70 | 2,31 | 0,4189 | -0,4160 |
13F og Fondsarkivering
Denne formular blev indsendt den 2020-05-28 for rapporteringsperioden 2020-03-31. Klik på linkikonet for at se den fulde transaktionshistorik.
Opgrader for at låse op for premium-data og eksportere til Excel ![]() .
.
| Sikkerhed | Type | Gennemsnitlig aktiekurs | Aktier (MM) |
Δ Aktier (%) |
Δ Aktier (%) |
Værdi ($MM) |
Portefølje (%) |
ΔPortefølje (%) |
|
|---|---|---|---|---|---|---|---|---|---|
| XOM / Exxon Mobil Corporation | 3,73 | 6,42 | 141,68 | -42,09 | 25,6678 | 3,2005 | |||
| CVX / Chevron Corporation | 1,67 | 6,00 | 120,83 | -36,26 | 21,8913 | 4,4815 | |||
| COP / ConocoPhillips | 0,97 | 5,23 | 29,83 | -50,16 | 5,4036 | -0,0918 | |||
| KMI / Kinder Morgan, Inc. | 1,80 | 6,51 | 25,05 | -29,97 | 4,5375 | 1,2534 | |||
| PSX / Phillips 66 | 0,39 | 5,49 | 21,05 | -49,20 | 3,8131 | 0,0085 | |||
| EOG / EOG Resources, Inc. | 0,51 | 6,76 | 18,45 | -54,22 | 3,3429 | -0,3582 | |||
| SLB / Schlumberger Limited | 1,22 | 6,63 | 16,49 | -64,22 | 2,9879 | -1,2447 | |||
| VLO / Valero Energy Corporation | 0,36 | 5,54 | 16,45 | -48,88 | 2,9803 | 0,0251 | |||
| 46628D411 / JNL Securities Lending Collateral Fund | 15,56 | 8,26 | 15,56 | 8,27 | 2,8192 | 1,4992 | |||
| WMB / The Williams Companies, Inc. | 1,07 | 6,87 | 15,15 | -36,25 | 2,7445 | 0,5624 | |||
| MPC / Marathon Petroleum Corporation | 0,57 | 4,65 | 13,49 | -58,97 | 2,4446 | -0,5757 | |||
| PXD / Pioneer Natural Resources Company | 0,15 | 5,16 | 10,23 | -51,27 | 1,8530 | -0,0744 | |||
| OXY / Occidental Petroleum Corporation | 0,79 | 6,03 | 9,11 | -70,21 | 1,6499 | -1,1572 | |||
| 46628D437 / JNL Government Money Market Fund | 8,56 | 142,68 | 8,56 | 142,72 | 1,5502 | 1,2264 | |||
| HES / Hess Corporation | 0,24 | 6,92 | 8,04 | -46,71 | 1,4571 | 0,0712 | |||
| OKE / ONEOK, Inc. | 0,36 | 6,22 | 7,93 | -69,39 | 1,4375 | -0,9425 | |||
| US20605P1012 / Concho Resources, Inc. | 0,18 | 7,21 | 7,62 | -47,55 | 1,3809 | 0,0466 | |||
| LNG / Cheniere Energy, Inc. | 0,20 | 5,96 | 6,80 | -41,88 | 1,2317 | 0,1576 | |||
| COG / Cabot Oil & Gas Corp. | 0,36 | 2,67 | 6,21 | 0,45 | 1,1252 | 0,5401 | |||
| BKR / Baker Hughes Company | 0,58 | 10,34 | 6,04 | -54,80 | 1,0942 | -0,1327 | |||
| HAL / Halliburton Company | 0,78 | 7,64 | 5,33 | -69,87 | 0,9657 | -0,6587 | |||
| FANG / Diamondback Energy, Inc. | 0,13 | 4,89 | 3,50 | -70,41 | 0,6346 | -0,4523 | |||
| NOV / NOV Inc. | 0,34 | 6,10 | 3,33 | -58,36 | 0,6024 | -0,1310 | |||
| HFC / HollyFrontier Corp | 0,13 | 3,47 | 3,30 | -50,00 | 0,5974 | -0,0081 | |||
| US6550441058 / Noble Energy, Inc. | 0,42 | 7,47 | 2,56 | -73,88 | 0,4645 | -0,4365 | |||
| FTI / TechnipFMC plc | 0,37 | 3,68 | 2,52 | -71,06 | 0,4557 | -0,3666 | |||
| TEGP / Tallgrass Energy GP, LP | 0,14 | 7,45 | 2,33 | -20,04 | 0,4229 | 0,1548 | |||
| DVN / Devon Energy Corporation | 0,34 | 0,48 | 2,33 | -73,27 | 0,4227 | -0,3787 | |||
| MRO / Marathon Oil Corporation | 0,70 | 4,97 | 2,31 | -74,57 | 0,4189 | -0,4160 | |||
| TPL / Texas Pacific Land Corporation | 0,01 | 9,23 | 2,10 | -46,86 | 0,3803 | 0,0175 | |||
| EQT / EQT Corporation | 0,23 | 7,99 | 1,62 | -29,96 | 0,2936 | 0,0811 | |||
| US7018771029 / Parsley Energy, Inc. | 0,27 | 17,06 | 1,55 | -64,53 | 0,2810 | -0,1206 | |||
| HP / Helmerich & Payne, Inc. | 0,10 | 6,83 | 1,51 | -63,21 | 0,2742 | -0,1035 | |||
| XEC / Cimarex Energy Co. | 0,09 | 5,09 | 1,48 | -66,32 | 0,2676 | -0,1349 | |||
| INT / World Fuel Services Corp. | 0,06 | 5,61 | 1,46 | -38,75 | 0,2649 | 0,0457 | |||
| TRGP / Targa Resources Corp. | 0,21 | 8,98 | 1,44 | -81,56 | 0,2617 | -0,4575 | |||
| APA / APA Corporation | 0,34 | 7,95 | 1,40 | -82,37 | 0,2537 | -0,4757 | |||
| US98212B1035 / WPX Energy, Inc. | 0,36 | 3,69 | 1,10 | -76,99 | 0,1990 | -0,2392 | |||
| DK / Delek US Holdings, Inc. | 0,06 | 2,41 | 1,02 | -51,87 | 0,1842 | -0,0098 | |||
| ETRN / Equitrans Midstream Corporation | 0,20 | 10,41 | 1,00 | -58,46 | 0,1812 | -0,0398 | |||
| DRQ / Dril-Quip, Inc. | 0,03 | 5,13 | 0,94 | -31,64 | 0,1711 | 0,0442 | |||
| PAGP / Plains GP Holdings, L.P. - Limited Partnership | 0,16 | 10,94 | 0,89 | -67,15 | 0,1611 | -0,0875 | |||
| CNX / CNX Resources Corporation | 0,16 | -4,01 | 0,84 | -42,31 | 0,1530 | 0,0186 | |||
| SWN / Southwestern Energy Company | 0,49 | 7,00 | 0,83 | -25,34 | 0,1507 | 0,0485 | |||
| MUR / Murphy Oil Corporation | 0,13 | 1,39 | 0,80 | -76,83 | 0,1451 | -0,1720 | |||
| PBF / PBF Energy Inc. | 0,11 | 12,50 | 0,75 | -74,62 | 0,1350 | -0,1346 | |||
| REGI / Renewable Energy Group Inc | 0,03 | -1,56 | 0,67 | -25,06 | 0,1215 | 0,0394 | |||
| CLR / Continental Resources Inc (OKLA) | 0,08 | 3,49 | 0,62 | -76,95 | 0,1122 | -0,1345 | |||
| PDCE / PDC Energy Inc | 0,09 | 56,96 | 0,54 | -62,78 | 0,0972 | -0,0351 | |||
| RIG / Transocean Ltd. | 0,46 | 6,51 | 0,53 | -72,37 | 0,0966 | -0,0860 | |||
| WHD / Cactus, Inc. | 0,04 | 6,23 | 0,49 | -64,10 | 0,0879 | -0,0362 | |||
| CVI / CVR Energy, Inc. | 0,03 | 8,34 | 0,44 | -55,76 | 0,0795 | -0,0115 | |||
| AROC / Archrock, Inc. | 0,12 | 4,31 | 0,44 | -60,93 | 0,0790 | -0,0235 | |||
| US8119041015 / Seacor Holdings, Inc. | 0,02 | 7,13 | 0,44 | -33,08 | 0,0788 | 0,0191 | |||
| AM / Antero Midstream Corporation | 0,20 | 4,76 | 0,42 | -71,04 | 0,0765 | -0,0573 | |||
| MGY / Magnolia Oil & Gas Corporation | 0,11 | 5,57 | 0,42 | -66,43 | 0,0761 | -0,0388 | |||
| CHX / ChampionX Corporation | 0,07 | 12,42 | 0,42 | -80,90 | 0,0755 | -0,1245 | |||
| CLB / Core Laboratories Inc. | 0,04 | 6,96 | 0,41 | -76,32 | 0,0748 | -0,0899 | |||
| PTEN / Patterson-UTI Energy, Inc. | 0,18 | 3,04 | 0,41 | -76,95 | 0,0745 | -0,0893 | |||
| RRC / Range Resources Corporation | 0,18 | 0,00 | 0,40 | -52,99 | 0,0727 | -0,0057 | |||
| US912796SV23 / United States Treasury Bill | 0,40 | 0,0724 | 0,0724 | ||||||
| INSW / International Seaways, Inc. | 0,02 | 0,00 | 0,40 | 24,06 | 0,0720 | 0,0417 | |||
| VNOM / Viper Energy, Inc. | 0,06 | 15,75 | 0,38 | -68,95 | 0,0690 | -0,0434 | |||
| ARCH / Arch Resources, Inc. | 0,01 | 0,47 | 0,37 | -59,58 | 0,0662 | -0,0167 | |||
| BOOM / DMC Global Inc. | 0,01 | 5,19 | 0,31 | -46,23 | 0,0558 | 0,0033 | |||
| CHK / Chesapeake Energy Corporation | 1,65 | 70,10 | 0,28 | -64,50 | 0,0516 | -0,0219 | |||
| ENLC / EnLink Midstream, LLC | 0,22 | 0,00 | 0,25 | -82,09 | 0,0445 | -0,0812 | |||
| REX / REX American Resources Corporation | 0,01 | 18,20 | 0,24 | -32,97 | 0,0443 | 0,0108 | |||
| US912796XE43 / 02/21 0.00000 | 0,24 | 0,0441 | 0,0441 | ||||||
| OII / Oceaneering International, Inc. | 0,08 | 0,00 | 0,24 | -80,35 | 0,0435 | -0,0683 | |||
| / Denbury Resources, Inc. | 0,02 | 0,23 | 0,0413 | 0,0413 | |||||
| TDW / Tidewater Inc. | 0,03 | 13,32 | 0,23 | -58,41 | 0,0408 | -0,0089 | |||
| MTDR / Matador Resources Company | 0,09 | -3,95 | 0,22 | -86,77 | 0,0403 | -0,1139 | |||
| MTRX / Matrix Service Company | 0,02 | 0,00 | 0,22 | -58,65 | 0,0399 | -0,0090 | |||
| KOS / Kosmos Energy Ltd. | 0,23 | 0,00 | 0,21 | -84,33 | 0,0378 | -0,0841 | |||
| MNRL / Brigham Minerals Inc - Class A | 0,02 | 15,36 | 0,20 | -55,68 | 0,0370 | -0,0051 | |||
| XPRO / Expro Group Holdings N.V. | 0,08 | 0,00 | 0,20 | -45,43 | 0,0368 | 0,0015 | |||
| CLNE / Clean Energy Fuels Corp. | 0,11 | 0,00 | 0,20 | -23,74 | 0,0355 | 0,0119 | |||
| HLX / Helix Energy Solutions Group, Inc. | 0,12 | 0,00 | 0,19 | -82,96 | 0,0346 | -0,0684 | |||
| PARR / Par Pacific Holdings, Inc. | 0,03 | 0,00 | 0,18 | -69,50 | 0,0332 | -0,0219 | |||
| CPE / Callon Petroleum Company | 0,33 | 0,00 | 0,18 | -88,69 | 0,0325 | -0,1128 | |||
| PUMP / ProPetro Holding Corp. | 0,07 | 0,00 | 0,18 | -77,85 | 0,0322 | -0,0412 | |||
| WTTR / Select Water Solutions, Inc. | 0,05 | 0,00 | 0,17 | -65,27 | 0,0302 | -0,0138 | |||
| BTU / Peabody Energy Corporation | 0,06 | -12,04 | 0,16 | -72,16 | 0,0299 | -0,0243 | |||
| AR / Antero Resources Corporation | 0,22 | 0,00 | 0,16 | -75,00 | 0,0283 | -0,0291 | |||
| NEX / NexTier Oilfield Solutions Inc | 0,13 | 0,00 | 0,15 | -82,61 | 0,0277 | -0,0527 | |||
| BCEI / Bonanza Creek Energy Inc New | 0,01 | 0,00 | 0,15 | -51,79 | 0,0268 | -0,0014 | |||
| WTI / W&T Offshore, Inc. | 0,08 | 0,00 | 0,14 | -69,51 | 0,0260 | -0,0171 | |||
| US912796TY52 / TREASURY BILL 12/20 0.00000 | 0,14 | 0,0253 | 0,0253 | ||||||
| GPRE / Green Plains Inc. | 0,03 | -13,91 | 0,14 | -73,07 | 0,0248 | -0,0216 | |||
| SOI / Solaris Oilfield Infrastructure, Inc. | 0,03 | 0,00 | 0,13 | -62,64 | 0,0242 | -0,0085 | |||
| EXTN / Exterran Corp | 0,03 | 0,00 | 0,13 | -38,60 | 0,0239 | 0,0041 | |||
| BRY / Berry Corporation | 0,05 | 0,00 | 0,13 | -74,40 | 0,0232 | -0,0228 | |||
| LBRT / Liberty Energy Inc. | 0,04 | 7,57 | 0,12 | -74,16 | 0,0212 | -0,0201 | |||
| RES / RPC, Inc. | 0,06 | 0,00 | 0,11 | -60,69 | 0,0207 | -0,0060 | |||
| RTLR / Rattler Midstream Lp - Unit | 0,03 | 0,00 | 0,11 | -80,48 | 0,0207 | -0,0329 | |||
| NBR / Nabors Industries Ltd. | 0,29 | 0,00 | 0,11 | -79,22 | 0,0204 | -0,0307 | |||
| NOG / Northern Oil and Gas, Inc. | 0,17 | 0,00 | 0,11 | -71,72 | 0,0204 | -0,0161 | |||
| SM / SM Energy Company | 0,09 | 0,00 | 0,11 | -89,17 | 0,0198 | -0,0726 | |||
| / Denbury Resources, Inc. | 0,06 | 0,00 | 0,11 | -74,53 | 0,0198 | -0,0196 | |||
| SLCA / U.S. Silica Holdings, Inc. | 0,06 | 0,00 | 0,10 | -70,90 | 0,0188 | -0,0137 | |||
| TALO / Talos Energy Inc. | 0,02 | 0,00 | 0,10 | -81,00 | 0,0187 | -0,0311 | |||
| OIS / Oil States International, Inc. | 0,05 | 0,00 | 0,10 | -87,64 | 0,0177 | -0,0544 | |||
| CEIX / CONSOL Energy Inc. | 0,02 | 0,00 | 0,09 | -74,71 | 0,0157 | -0,0156 | |||
| OAS / Oasis Petroleum Inc. - New | 0,24 | 0,00 | 0,09 | -89,29 | 0,0155 | -0,0575 | |||
| NC / NACCO Industries, Inc. | 0,00 | 86,74 | 0,08 | 12,00 | 0,0153 | 0,0084 | |||
| GTE / Gran Tierra Energy Inc. | 0,32 | 0,00 | 0,08 | -80,62 | 0,0147 | -0,0237 | |||
| TELL / Tellurian Inc. | 0,08 | 0,00 | 0,07 | -87,63 | 0,0135 | -0,0415 | |||
| 920355104 / Valspar Corp. | 0,16 | 0,00 | 0,07 | -90,75 | 0,0134 | -0,0613 | |||
| / Denbury Resources, Inc. | 0,38 | 0,00 | 0,07 | -86,94 | 0,0127 | -0,0365 | |||
| NR / NPK International Inc. | 0,08 | 0,00 | 0,07 | -85,77 | 0,0126 | -0,0320 | |||
| US74733V1008 / QEP Resources, Inc. | 0,20 | 0,00 | 0,07 | -92,67 | 0,0119 | -0,0695 | |||
| / Gulfport Energy Corp. | 0,13 | 0,00 | 0,06 | -85,50 | 0,0108 | -0,0266 | |||
| 00B65Z9D7 / Noble Corporation plc | 0,21 | 0,00 | 0,05 | -79,70 | 0,0099 | -0,0153 | |||
| WLL / Whiting Petroleum Corp (New) | 0,08 | 0,00 | 0,05 | -90,96 | 0,0092 | -0,0417 | |||
| LPI / Laredo Petroleum Inc. | 0,12 | 0,00 | 0,05 | -86,86 | 0,0084 | -0,0238 | |||
| CDEV / Centennial Resource Development Inc. - Class A | 0,15 | 0,00 | 0,04 | -94,39 | 0,0074 | -0,0582 | |||
| CRC / California Resources Corporation | 0,04 | 0,00 | 0,04 | -88,99 | 0,0069 | -0,0248 | |||
| AMR / Alpha Metallurgical Resources, Inc. | 0,02 | 0,00 | 0,04 | -74,13 | 0,0067 | -0,0064 | |||
| XOG / Extraction Oil & Gas Inc - New | 0,07 | -21,66 | 0,03 | -84,62 | 0,0055 | -0,0124 | |||
| PVAC / Penn Virginia Corp. | 0,01 | 0,00 | 0,03 | -89,96 | 0,0048 | -0,0190 | |||
| FUTURE - CASH SETTLED / DE (N/A) | 0,01 | -96,08 | 0,0019 | 0,0019 | |||||
| / McDermott International, Inc. | 0,00 | -100,00 | 0,00 | -100,00 | -0,0094 |