Grundlæggende statistik
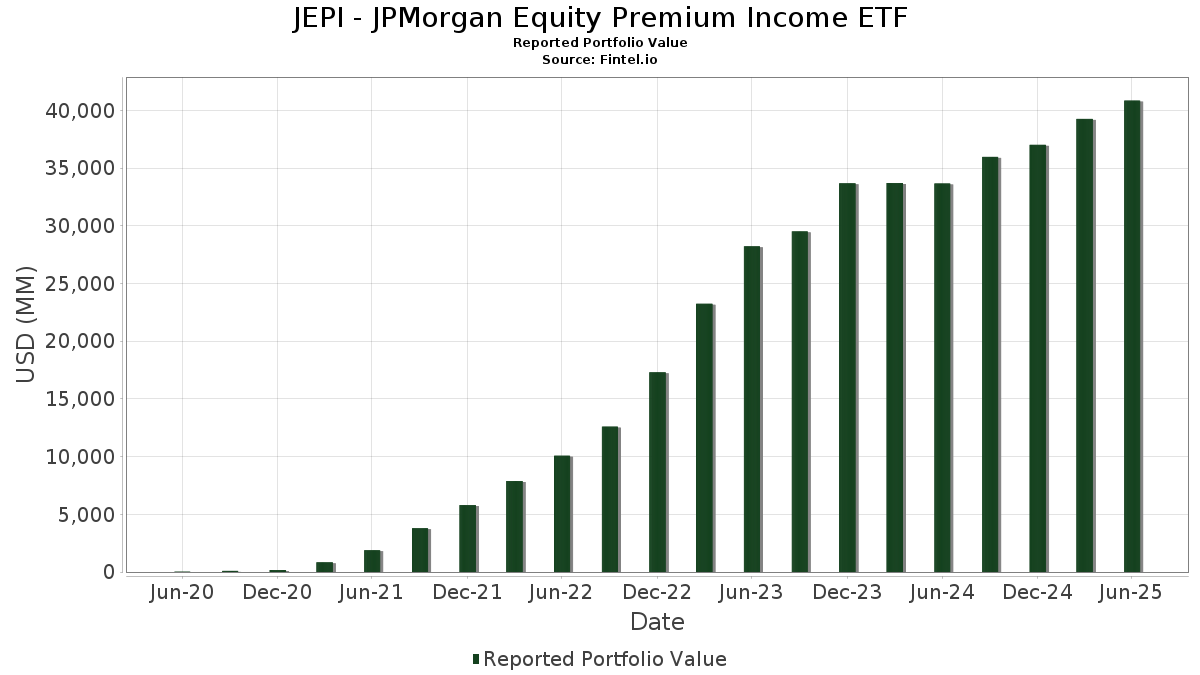
| Porteføljeværdi | $ 40.842.914.886 |
| Nuværende stillinger | 122 |
Seneste beholdninger, ydeevne, AUM (fra 13F, 13D)
JEPI - JPMorgan Equity Premium Income ETF har afsløret 122 samlede besiddelser i deres seneste SEC-arkivering. Den seneste porteføljeværdi er beregnet til at være $ 40.842.914.886 USD. Faktiske aktiver under forvaltning (AUM) er denne værdi plus kontanter (som ikke er oplyst). JEPI - JPMorgan Equity Premium Income ETFs største beholdninger er Meta Platforms, Inc. (US:META) , Oracle Corporation (US:ORCL) , Microsoft Corporation (US:MSFT) , Visa Inc. (US:V) , and NVIDIA Corporation (US:NVDA) . JEPI - JPMorgan Equity Premium Income ETFs nye stillinger omfatter Vistra Corp. (US:VST) , Vulcan Materials Company (US:VMC) , Baker Hughes Company (US:BKR) , .
Top øger dette kvartal
Vi bruger ændringen i porteføljeallokeringen, fordi dette er den mest meningsfulde metrik. Ændringer kan skyldes handler eller ændringer i aktiekurser.
| Sikkerhed | Aktier (MM) |
Værdi (MM$) |
Portefølje % | ΔPortefølje % |
|---|---|---|---|---|
| 3,23 | 705,29 | 1,7230 | 1,0686 | |
| 375,81 | 0,9181 | 0,9181 | ||
| 4,05 | 501,85 | 1,2260 | 0,9168 | |
| 369,75 | 0,9033 | 0,9033 | ||
| 364,73 | 0,8910 | 0,8910 | ||
| 355,91 | 0,8695 | 0,8695 | ||
| 350,55 | 0,8564 | 0,8564 | ||
| 348,42 | 0,8512 | 0,8512 | ||
| 348,28 | 0,8508 | 0,8508 | ||
| 347,07 | 0,8479 | 0,8479 |
Top falder i dette kvartal
Vi bruger ændringen i porteføljeallokeringen, fordi dette er den mest meningsfulde metrik. Ændringer kan skyldes handler eller ændringer i aktiekurser.
| Sikkerhed | Aktier (MM) |
Værdi (MM$) |
Portefølje % | ΔPortefølje % |
|---|---|---|---|---|
| 0,92 | 287,88 | 0,7033 | -0,5924 | |
| 0,99 | 271,58 | 0,6634 | -0,5810 | |
| 1,60 | 100,35 | 0,2451 | -0,4387 | |
| 3,67 | 119,81 | 0,2927 | -0,4036 | |
| 0,77 | 360,93 | 0,8817 | -0,3094 | |
| 2,95 | 264,52 | 0,6462 | -0,2865 | |
| 1,65 | 480,77 | 1,1745 | -0,2768 | |
| 1,49 | 324,59 | 0,7929 | -0,2668 | |
| 0,03 | 108,30 | 0,2646 | -0,2548 | |
| 2,99 | 295,79 | 0,7226 | -0,2513 |
13F og Fondsarkivering
Denne formular blev indsendt den 2025-08-26 for rapporteringsperioden 2025-06-30. Klik på linkikonet for at se den fulde transaktionshistorik.
Opgrader for at låse op for premium-data og eksportere til Excel ![]() .
.
| Sikkerhed | Type | Gennemsnitlig aktiekurs | Aktier (MM) |
Δ Aktier (%) |
Δ Aktier (%) |
Værdi ($MM) |
Portefølje (%) |
ΔPortefølje (%) |
|
|---|---|---|---|---|---|---|---|---|---|
| META / Meta Platforms, Inc. | 0,96 | 0,41 | 706,65 | 28,59 | 1,7263 | 0,3322 | |||
| ORCL / Oracle Corporation | 3,23 | 74,85 | 705,29 | 173,42 | 1,7230 | 1,0686 | |||
| MSFT / Microsoft Corporation | 1,38 | 0,40 | 687,53 | 33,04 | 1,6796 | 0,3685 | |||
| V / Visa Inc. | 1,86 | -1,55 | 661,42 | -0,26 | 1,6158 | -0,0665 | |||
| NVDA / NVIDIA Corporation | 4,18 | -9,05 | 661,12 | 32,58 | 1,6150 | 0,3500 | |||
| MA / Mastercard Incorporated | 1,18 | -1,80 | 660,45 | 0,68 | 1,6134 | -0,0508 | |||
| TT / Trane Technologies plc | 1,50 | -9,49 | 657,63 | 17,51 | 1,6065 | 0,1867 | |||
| AMZN / Amazon.com, Inc. | 2,93 | 0,40 | 642,05 | 15,77 | 1,5685 | 0,1615 | |||
| PGR / The Progressive Corporation | 2,29 | -2,52 | 610,76 | -8,08 | 1,4920 | -0,1936 | |||
| ADI / Analog Devices, Inc. | 2,55 | 0,40 | 606,77 | 18,50 | 1,4823 | 0,1833 | |||
| SO / The Southern Company | 6,58 | 0,41 | 603,87 | 0,28 | 1,4752 | -0,0525 | |||
| NOW / ServiceNow, Inc. | 0,57 | -4,89 | 588,14 | 22,81 | 1,4368 | 0,2219 | |||
| ABBV / AbbVie Inc. | 3,11 | 0,41 | 577,14 | -11,04 | 1,4099 | -0,2360 | |||
| GOOGL / Alphabet Inc. | 3,15 | 4,32 | 555,21 | 18,88 | 1,3563 | 0,1715 | |||
| HWM / Howmet Aerospace Inc. | 2,97 | 69,55 | 552,55 | 143,25 | 1,3498 | 0,7736 | |||
| EMR / Emerson Electric Co. | 4,13 | 77,03 | 550,00 | 115,28 | 1,3436 | 0,6955 | |||
| ETN / Eaton Corporation plc | 1,54 | -9,29 | 549,47 | 19,12 | 1,3423 | 0,1721 | |||
| YUM / Yum! Brands, Inc. | 3,68 | 5,26 | 545,61 | -0,88 | 1,3329 | -0,0636 | |||
| SYK / Stryker Corporation | 1,37 | 1,02 | 543,13 | 7,36 | 1,3268 | 0,0434 | |||
| LOW / Lowe's Companies, Inc. | 2,45 | 10,43 | 542,99 | 5,05 | 1,3265 | 0,0152 | |||
| WMT / Walmart Inc. | 5,47 | 76,19 | 534,72 | 96,24 | 1,3063 | 0,6150 | |||
| CMCSA / Comcast Corporation | 14,92 | 19,69 | 532,55 | 15,76 | 1,3010 | 0,1339 | |||
| JNJ / Johnson & Johnson | 3,48 | 13,21 | 531,02 | 4,27 | 1,2972 | 0,0053 | |||
| PEP / PepsiCo, Inc. | 4,01 | 12,36 | 529,50 | -1,05 | 1,2935 | -0,0640 | |||
| NEE / NextEra Energy, Inc. | 7,56 | 0,41 | 524,57 | -1,68 | 1,2815 | -0,0720 | |||
| ROST / Ross Stores, Inc. | 4,10 | 19,73 | 522,47 | 19,54 | 1,2763 | 0,1675 | |||
| BMY / Bristol-Myers Squibb Company | 11,17 | 19,31 | 517,09 | -9,44 | 1,2632 | -0,1854 | |||
| AVGO / Broadcom Inc. | 1,86 | 49,26 | 511,36 | 145,74 | 1,2492 | 0,7213 | |||
| DIS / The Walt Disney Company | 4,05 | 227,75 | 501,85 | 311,79 | 1,2260 | 0,9168 | |||
| MDLZ / Mondelez International, Inc. | 7,18 | -5,49 | 484,35 | -6,06 | 1,1832 | -0,1248 | |||
| MCD / McDonald's Corporation | 1,65 | -10,15 | 480,77 | -15,96 | 1,1745 | -0,2768 | |||
| AMP / Ameriprise Financial, Inc. | 0,89 | 9,79 | 476,24 | 21,04 | 1,1634 | 0,1653 | |||
| TXN / Texas Instruments Incorporated | 2,25 | -6,77 | 467,51 | 7,72 | 1,1421 | 0,0410 | |||
| EOG / EOG Resources, Inc. | 3,91 | 30,06 | 467,51 | 21,30 | 1,1421 | 0,1643 | |||
| TMO / Thermo Fisher Scientific Inc. | 1,14 | 14,17 | 463,28 | -6,97 | 1,1318 | -0,1316 | |||
| AJG / Arthur J. Gallagher & Co. | 1,32 | 25,36 | 421,43 | 16,24 | 1,0295 | 0,1097 | |||
| CARR / Carrier Global Corporation | 5,57 | 27,08 | 407,69 | 46,70 | 0,9959 | 0,2909 | |||
| AXP / American Express Company | 1,27 | -2,52 | 403,89 | 15,57 | 0,9867 | 0,1001 | |||
| CTSH / Cognizant Technology Solutions Corporation | 5,09 | 17,52 | 397,54 | 19,87 | 0,9712 | 0,1298 | |||
| CMG / Chipotle Mexican Grill, Inc. | 7,07 | 11,07 | 397,16 | 24,21 | 0,9702 | 0,1590 | |||
| Societe Generale SA, ELN, 50.30%, 8/5/2025, (linked to S&P 500 Index) / SN (US83371E6014) | 375,81 | 0,9181 | 0,9181 | ||||||
| KO / The Coca-Cola Company | 5,30 | -12,71 | 374,90 | -13,77 | 0,9159 | -0,1872 | |||
| BNP Paribas, ELN, 49.90%, 8/4/2025, (linked to S&P 500 Index) / SN (US0969324625) | 369,75 | 0,9033 | 0,9033 | ||||||
| CRM / Salesforce, Inc. | 1,35 | 17,54 | 367,57 | 19,44 | 0,8979 | 0,1172 | |||
| US83370G5999 / Societe Generale SA, ELN, (linked to Nasdaq 100 Index) | 364,73 | 0,8910 | 0,8910 | ||||||
| LIN / Linde plc | 0,77 | -23,70 | 360,93 | -23,12 | 0,8817 | -0,3094 | |||
| Morgan Stanley Finance LLC, ELN, 51.41%, 7/25/2025, (linked to S&P 500 Index) / SN (US61777X5308) | 355,91 | 0,8695 | 0,8695 | ||||||
| EQIX / Equinix, Inc. | 0,44 | 10,91 | 352,27 | 8,20 | 0,8606 | 0,0346 | |||
| US83370G5999 / Societe Generale SA, ELN, (linked to Nasdaq 100 Index) | 350,55 | 0,8564 | 0,8564 | ||||||
| US06747W8495 / Barclays Bank plc into Metlife, Inc. | 348,42 | 0,8512 | 0,8512 | ||||||
| US17329T1613 / Citigroup Global Markets Holdings, Inc. into Bristol Myers Squibb Co. | 348,28 | 0,8508 | 0,8508 | ||||||
| BNP Paribas, ELN, 54.30%, 7/29/2025, (linked to S&P 500 Index) / SN (US0969324708) | 347,07 | 0,8479 | 0,8479 | ||||||
| US06747W8495 / Barclays Bank plc into Metlife, Inc. | 345,74 | 0,8446 | 0,8446 | ||||||
| MDT / Medtronic plc | 3,93 | 5,79 | 342,89 | 2,62 | 0,8376 | -0,0100 | |||
| US17329T1613 / Citigroup Global Markets Holdings, Inc. into Bristol Myers Squibb Co. | 330,38 | 0,8071 | 0,8071 | ||||||
| PG / The Procter & Gamble Company | 2,05 | -4,22 | 326,38 | -10,46 | 0,7973 | -0,1274 | |||
| BNP Paribas, ELN, 49.30%, 7/11/2025, (linked to S&P 500 Index) / SN (US0969325796) | 325,74 | 0,7958 | 0,7958 | ||||||
| NXPI / NXP Semiconductors N.V. | 1,49 | -32,41 | 324,59 | -22,29 | 0,7929 | -0,2668 | |||
| BNP Paribas, ELN, 52.56%, 7/14/2025, (linked to S&P 500 Index) / SN (US0969324880) | 324,41 | 0,7925 | 0,7925 | ||||||
| Morgan Stanley Finance LLC, ELN, 52.75%, 7/7/2025, (linked to S&P 500 Index) / SN (US61777X3402) | 319,81 | 0,7813 | 0,7813 | ||||||
| Morgan Stanley Finance LLC, ELN, 55.72%, 7/9/2025, (linked to S&P 500 Index) / SN (US61777X3576) | 316,76 | 0,7738 | 0,7738 | ||||||
| Societe Generale SA, ELN, 53.00%, 7/8/2025, (linked to S&P 500 Index) / SN (US83371E4944) | 311,94 | 0,7620 | 0,7620 | ||||||
| LLY / Eli Lilly and Company | 0,39 | 0,45 | 305,83 | -5,19 | 0,7471 | -0,0713 | |||
| OTIS / Otis Worldwide Corporation | 2,99 | -19,69 | 295,79 | -22,95 | 0,7226 | -0,2513 | |||
| SBAC / SBA Communications Corporation | 1,25 | -8,03 | 293,67 | -1,83 | 0,7174 | -0,0415 | |||
| UNH / UnitedHealth Group Incorporated | 0,92 | -5,37 | 287,88 | -43,63 | 0,7033 | -0,5924 | |||
| KDP / Keurig Dr Pepper Inc. | 8,59 | 136,68 | 283,89 | 128,66 | 0,6935 | 0,3785 | |||
| BRK.B / Berkshire Hathaway Inc. | 0,58 | -2,67 | 283,76 | -11,23 | 0,6932 | -0,1177 | |||
| XOM / Exxon Mobil Corporation | 2,63 | 0,40 | 283,16 | -8,99 | 0,6917 | -0,0976 | |||
| AAPL / Apple Inc. | 1,38 | 3,18 | 282,91 | -4,70 | 0,6911 | -0,0620 | |||
| RTX / RTX Corporation | 1,93 | 0,41 | 282,49 | 10,68 | 0,6901 | 0,0426 | |||
| MGMXX / JPMorgan Trust II - JPMorgan U.S. Government Money Market Fund IM | 279,45 | -6,03 | 279,45 | -6,03 | 0,6827 | -0,0718 | |||
| CME / CME Group Inc. | 0,99 | -46,71 | 271,58 | -44,64 | 0,6634 | -0,5810 | |||
| MMM / 3M Company | 1,77 | 53,18 | 269,71 | 58,79 | 0,6589 | 0,2280 | |||
| COP / ConocoPhillips | 2,95 | -15,80 | 264,52 | -28,05 | 0,6462 | -0,2865 | |||
| CPAY / Corpay, Inc. | 0,79 | -1,90 | 263,71 | -6,65 | 0,6442 | -0,0725 | |||
| LRCX / Lam Research Corporation | 2,68 | 174,56 | 261,17 | 267,62 | 0,6380 | 0,4578 | |||
| REGN / Regeneron Pharmaceuticals, Inc. | 0,50 | 0,38 | 260,37 | -16,90 | 0,6361 | -0,1588 | |||
| UPS / United Parcel Service, Inc. | 2,57 | 0,40 | 259,79 | -7,86 | 0,6346 | -0,0806 | |||
| TRV / The Travelers Companies, Inc. | 0,96 | 45,92 | 257,94 | 47,62 | 0,6301 | 0,1869 | |||
| URI / United Rentals, Inc. | 0,32 | 13,53 | 242,80 | 36,49 | 0,5931 | 0,1418 | |||
| ASML / ASML Holding N.V. - Depositary Receipt (Common Stock) | 0,30 | 0,34 | 240,24 | 21,36 | 0,5869 | 0,0847 | |||
| TDG / TransDigm Group Incorporated | 0,16 | -10,80 | 239,14 | -1,94 | 0,5842 | -0,0345 | |||
| VRTX / Vertex Pharmaceuticals Incorporated | 0,53 | -5,39 | 236,50 | -13,13 | 0,5777 | -0,1129 | |||
| NFLX / Netflix, Inc. | 0,18 | 139,40 | 234,76 | 749,04 | 0,5735 | 0,4789 | |||
| FI / Fiserv, Inc. | 1,32 | 32,51 | 227,67 | 3,45 | 0,5562 | -0,0021 | |||
| CB / Chubb Limited | 0,77 | 17,23 | 224,48 | 12,47 | 0,5484 | 0,0420 | |||
| BURL / Burlington Stores, Inc. | 0,95 | 80,48 | 221,31 | 76,17 | 0,5407 | 0,2219 | |||
| BSX / Boston Scientific Corporation | 2,04 | 0,41 | 219,46 | 6,91 | 0,5361 | 0,0153 | |||
| PM / Philip Morris International Inc. | 1,19 | 0,40 | 216,89 | 15,20 | 0,5298 | 0,0522 | |||
| ADP / Automatic Data Processing, Inc. | 0,68 | 606,64 | 210,35 | 891,54 | 0,5139 | 0,4377 | |||
| CHD / Church & Dwight Co., Inc. | 2,16 | -11,66 | 207,78 | -22,87 | 0,5076 | -0,1759 | |||
| DE / Deere & Company | 0,41 | -12,97 | 207,35 | -5,71 | 0,5065 | -0,0513 | |||
| CDNS / Cadence Design Systems, Inc. | 0,66 | 27,41 | 202,60 | 54,38 | 0,4949 | 0,1620 | |||
| VST / Vistra Corp. | 1,00 | 193,77 | 0,4734 | 0,4734 | |||||
| MRK / Merck & Co., Inc. | 2,39 | 357,91 | 188,88 | 303,84 | 0,4614 | 0,3428 | |||
| CMS / CMS Energy Corporation | 2,56 | 1,08 | 177,61 | -6,77 | 0,4339 | -0,0494 | |||
| WELL / Welltower Inc. | 1,10 | 123,03 | 169,85 | 123,79 | 0,4149 | 0,2224 | |||
| VMC / Vulcan Materials Company | 0,55 | 143,54 | 0,3506 | 0,3506 | |||||
| DHR / Danaher Corporation | 0,72 | 33,24 | 141,91 | 28,39 | 0,3467 | 0,0663 | |||
| BAC / Bank of America Corporation | 2,96 | 0,41 | 140,07 | 13,86 | 0,3422 | 0,0301 | |||
| PEG / Public Service Enterprise Group Incorporated | 1,63 | -35,88 | 137,47 | -34,42 | 0,3358 | -0,1959 | |||
| MSI / Motorola Solutions, Inc. | 0,32 | 0,37 | 135,22 | -3,61 | 0,3303 | -0,0256 | |||
| CMI / Cummins Inc. | 0,41 | 152,94 | 133,27 | 164,29 | 0,3256 | 0,1976 | |||
| AMT / American Tower Corporation | 0,60 | 0,40 | 132,15 | 1,98 | 0,3228 | -0,0059 | |||
| AON / Aon plc | 0,36 | 0,45 | 130,04 | -10,21 | 0,3177 | -0,0497 | |||
| VTR / Ventas, Inc. | 2,04 | 143,64 | 128,53 | 123,77 | 0,3140 | 0,1683 | |||
| LDOS / Leidos Holdings, Inc. | 0,77 | 0,41 | 121,09 | 17,39 | 0,2958 | 0,0341 | |||
| CSX / CSX Corporation | 3,67 | -60,63 | 119,81 | -56,34 | 0,2927 | -0,4036 | |||
| RJF / Raymond James Financial, Inc. | 0,77 | 233,46 | 117,62 | 409,23 | 0,2873 | 0,2083 | |||
| ETR / Entergy Corporation | 1,41 | -1,36 | 117,22 | -4,10 | 0,2864 | -0,0237 | |||
| FDX / FedEx Corporation | 0,51 | 36,98 | 115,71 | 27,72 | 0,2827 | 0,0528 | |||
| AZO / AutoZone, Inc. | 0,03 | -45,66 | 108,30 | -47,10 | 0,2646 | -0,2548 | |||
| IR / Ingersoll Rand Inc. | 1,30 | -11,14 | 107,75 | -7,64 | 0,2632 | -0,0327 | |||
| PLD / Prologis, Inc. | 1,02 | -30,62 | 106,70 | -34,76 | 0,2607 | -0,1543 | |||
| MNST / Monster Beverage Corporation | 1,60 | -65,22 | 100,35 | -62,77 | 0,2451 | -0,4387 | |||
| D / Dominion Energy, Inc. | 1,57 | -13,60 | 88,67 | -12,91 | 0,2166 | -0,0417 | |||
| MO / Altria Group, Inc. | 1,48 | 0,41 | 86,77 | -1,92 | 0,2120 | -0,0125 | |||
| USB / U.S. Bancorp | 1,68 | -19,61 | 76,23 | -13,84 | 0,1862 | -0,0382 | |||
| AEE / Ameren Corporation | 0,54 | -52,60 | 51,68 | -37,07 | 0,1262 | -0,1428 | |||
| BKR / Baker Hughes Company | 1,32 | 50,44 | 0,1232 | 0,1232 | |||||
| KVUE / Kenvue Inc. | 1,82 | -12,45 | 38,19 | -23,59 | 0,0933 | -0,0335 |