Grundlæggende statistik
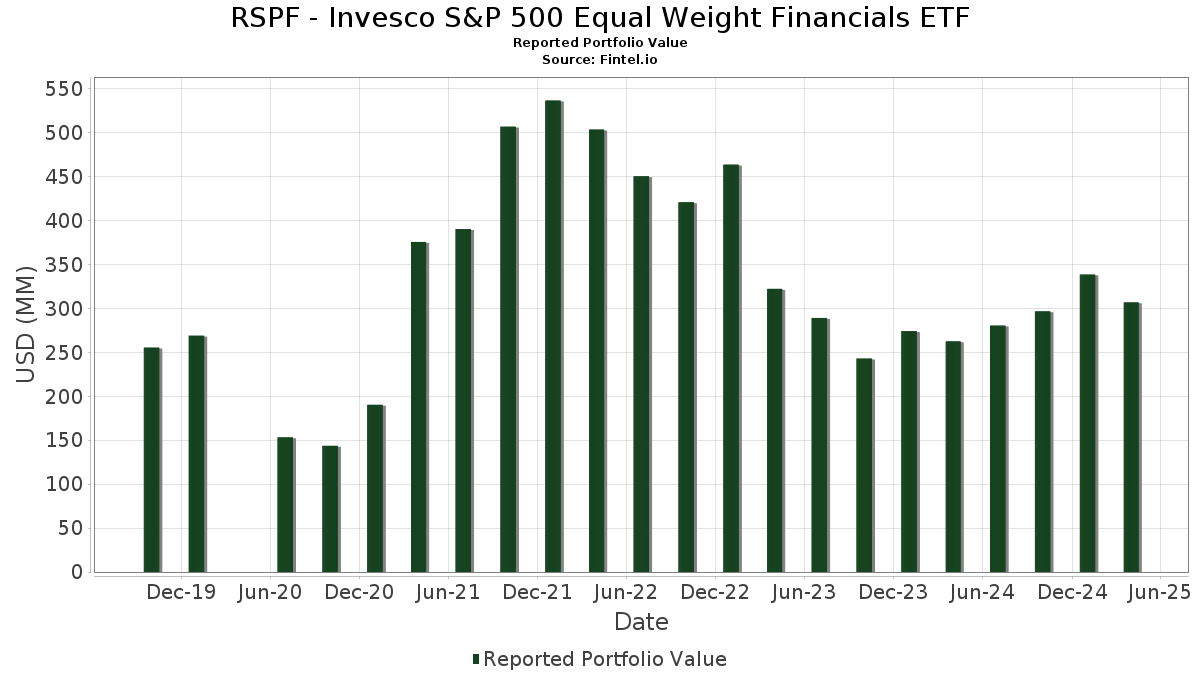
| Porteføljeværdi | $ 306.817.270 |
| Nuværende stillinger | 76 |
Seneste beholdninger, ydeevne, AUM (fra 13F, 13D)
RSPF - Invesco S&P 500 Equal Weight Financials ETF har afsløret 76 samlede besiddelser i deres seneste SEC-arkivering. Den seneste porteføljeværdi er beregnet til at være $ 306.817.270 USD. Faktiske aktiver under forvaltning (AUM) er denne værdi plus kontanter (som ikke er oplyst). RSPF - Invesco S&P 500 Equal Weight Financials ETFs største beholdninger er W. R. Berkley Corporation (US:WRB) , Fidelity National Information Services, Inc. (US:FIS) , Discover Financial Services (US:DFS) , The Charles Schwab Corporation (US:SCHW) , and CME Group Inc. (US:CME) .
Top øger dette kvartal
Vi bruger ændringen i porteføljeallokeringen, fordi dette er den mest meningsfulde metrik. Ændringer kan skyldes handler eller ændringer i aktiekurser.
| Sikkerhed | Aktier (MM) |
Værdi (MM$) |
Portefølje % | ΔPortefølje % |
|---|---|---|---|---|
| 7,36 | 7,36 | 2,4815 | 2,4815 | |
| 2,81 | 2,81 | 0,9485 | 0,9485 | |
| 0,06 | 4,71 | 1,5879 | 0,2994 | |
| 0,07 | 4,74 | 1,5972 | 0,2936 | |
| 0,02 | 4,36 | 1,4683 | 0,2012 | |
| 0,05 | 4,46 | 1,5039 | 0,1500 | |
| 0,03 | 4,05 | 1,3639 | 0,1452 | |
| 0,04 | 4,31 | 1,4529 | 0,1217 | |
| 0,01 | 4,20 | 1,4151 | 0,1215 | |
| 0,02 | 4,39 | 1,4801 | 0,1185 |
Top falder i dette kvartal
Vi bruger ændringen i porteføljeallokeringen, fordi dette er den mest meningsfulde metrik. Ændringer kan skyldes handler eller ændringer i aktiekurser.
| Sikkerhed | Aktier (MM) |
Værdi (MM$) |
Portefølje % | ΔPortefølje % |
|---|---|---|---|---|
| 0,02 | 3,55 | 1,1977 | -0,2310 | |
| 0,03 | 4,10 | 1,3824 | -0,1849 | |
| 0,04 | 3,34 | 1,1264 | -0,1738 | |
| 0,01 | 3,48 | 1,1737 | -0,1605 | |
| 0,01 | 3,62 | 1,2215 | -0,1577 | |
| 0,27 | 3,72 | 1,2526 | -0,1563 | |
| 0,05 | 3,68 | 1,2396 | -0,1533 | |
| 0,05 | 3,87 | 1,3053 | -0,1473 | |
| 0,06 | 4,10 | 1,3799 | -0,1464 | |
| 0,10 | 3,71 | 1,2500 | -0,1380 |
13F og Fondsarkivering
Denne formular blev indsendt den 2025-06-27 for rapporteringsperioden 2025-04-30. Klik på linkikonet for at se den fulde transaktionshistorik.
Opgrader for at låse op for premium-data og eksportere til Excel ![]() .
.
| Sikkerhed | Type | Gennemsnitlig aktiekurs | Aktier (MM) |
Δ Aktier (%) |
Δ Aktier (%) |
Værdi ($MM) |
Portefølje (%) |
ΔPortefølje (%) |
|
|---|---|---|---|---|---|---|---|---|---|
| Invesco Private Prime Fund / STIV (N/A) | 7,36 | 7,36 | 2,4815 | 2,4815 | |||||
| WRB / W. R. Berkley Corporation | 0,07 | -8,04 | 4,74 | 12,06 | 1,5972 | 0,2936 | |||
| FIS / Fidelity National Information Services, Inc. | 0,06 | 16,42 | 4,71 | 12,73 | 1,5879 | 0,2994 | |||
| DFS / Discover Financial Services | 0,02 | 1,27 | 4,54 | -8,00 | 1,5306 | 0,0088 | |||
| SCHW / The Charles Schwab Corporation | 0,05 | 3,25 | 4,46 | 1,59 | 1,5039 | 0,1500 | |||
| CME / CME Group Inc. | 0,02 | -15,13 | 4,39 | -0,57 | 1,4801 | 0,1185 | |||
| BRK.B / Berkshire Hathaway Inc. | 0,01 | -13,48 | 4,38 | -1,55 | 1,4746 | 0,1046 | |||
| JPM / JPMorgan Chase & Co. | 0,02 | -0,63 | 4,37 | -9,08 | 1,4719 | -0,0085 | |||
| MKTX / MarketAxess Holdings Inc. | 0,02 | 5,53 | 4,36 | 6,01 | 1,4683 | 0,2012 | |||
| CBOE / Cboe Global Markets, Inc. | 0,02 | -9,65 | 4,33 | -1,93 | 1,4588 | 0,0983 | |||
| HIG / The Hartford Insurance Group, Inc. | 0,04 | -9,22 | 4,31 | -0,16 | 1,4529 | 0,1217 | |||
| COF / Capital One Financial Corporation | 0,02 | 1,50 | 4,30 | -10,19 | 1,4502 | -0,0266 | |||
| TRV / The Travelers Companies, Inc. | 0,02 | -9,53 | 4,27 | -2,54 | 1,4374 | 0,0884 | |||
| SPGI / S&P Global Inc. | 0,01 | 0,38 | 4,25 | -3,73 | 1,4338 | 0,0715 | |||
| MA / Mastercard Incorporated | 0,01 | -5,26 | 4,25 | -6,51 | 1,4326 | 0,0308 | |||
| NDAQ / Nasdaq, Inc. | 0,06 | 3,60 | 4,25 | -4,11 | 1,4320 | 0,0661 | |||
| AFL / Aflac Incorporated | 0,04 | -7,43 | 4,22 | -6,32 | 1,4236 | 0,0338 | |||
| V / Visa Inc. | 0,01 | -12,35 | 4,22 | -11,41 | 1,4233 | -0,0460 | |||
| L / Loews Corporation | 0,05 | -6,17 | 4,21 | -4,67 | 1,4176 | 0,0577 | |||
| EG / Everest Group, Ltd. | 0,01 | -3,10 | 4,20 | 0,07 | 1,4151 | 0,1215 | |||
| WFC / Wells Fargo & Company | 0,06 | -3,41 | 4,19 | -12,96 | 1,4127 | -0,0718 | |||
| STT / State Street Corporation | 0,05 | 7,64 | 4,18 | -6,68 | 1,4087 | 0,0280 | |||
| MCO / Moody's Corporation | 0,01 | 4,63 | 4,17 | -5,08 | 1,4052 | 0,0512 | |||
| GS / The Goldman Sachs Group, Inc. | 0,01 | 2,86 | 4,16 | -12,05 | 1,4016 | -0,0561 | |||
| AXP / American Express Company | 0,02 | 7,81 | 4,16 | -9,53 | 1,4009 | -0,0154 | |||
| ACGL / Arch Capital Group Ltd. | 0,05 | -1,89 | 4,14 | -4,41 | 1,3947 | 0,0602 | |||
| PGR / The Progressive Corporation | 0,01 | -18,34 | 4,13 | -6,65 | 1,3920 | 0,0282 | |||
| AIG / American International Group, Inc. | 0,05 | -14,81 | 4,13 | -5,71 | 1,3907 | 0,0415 | |||
| MS / Morgan Stanley | 0,04 | 4,08 | 4,12 | -13,23 | 1,3883 | -0,0750 | |||
| APO / Apollo Global Management, Inc. | 0,03 | 23,11 | 4,12 | -1,74 | 1,3871 | 0,0960 | |||
| GL / Globe Life Inc. | 0,03 | -20,14 | 4,10 | -19,32 | 1,3824 | -0,1849 | |||
| CB / Chubb Limited | 0,01 | -9,55 | 4,10 | -4,83 | 1,3814 | 0,0538 | |||
| C / Citigroup Inc. | 0,06 | -1,52 | 4,10 | -17,29 | 1,3799 | -0,1464 | |||
| FDS / FactSet Research Systems Inc. | 0,01 | 6,01 | 4,09 | -3,42 | 1,3789 | 0,0731 | |||
| BLK / BlackRock, Inc. | 0,00 | 8,86 | 4,09 | -7,47 | 1,3778 | 0,0160 | |||
| JKHY / Jack Henry & Associates, Inc. | 0,02 | -3,94 | 4,08 | -4,30 | 1,3736 | 0,0606 | |||
| ALL / The Allstate Corporation | 0,02 | -9,33 | 4,07 | -6,46 | 1,3723 | 0,0303 | |||
| MSCI / MSCI Inc. | 0,01 | 7,41 | 4,07 | -1,88 | 1,3713 | 0,0929 | |||
| BAC / Bank of America Corporation | 0,10 | 7,37 | 4,07 | -7,51 | 1,3703 | 0,0150 | |||
| KKR / KKR & Co. Inc. | 0,04 | 27,97 | 4,07 | -12,49 | 1,3700 | -0,0617 | |||
| HBAN / Huntington Bancshares Incorporated | 0,28 | 11,14 | 4,06 | -6,12 | 1,3694 | 0,0353 | |||
| BK / The Bank of New York Mellon Corporation | 0,05 | -8,27 | 4,05 | -14,16 | 1,3654 | -0,0895 | |||
| CINF / Cincinnati Financial Corporation | 0,03 | 0,78 | 4,05 | 2,35 | 1,3639 | 0,1452 | |||
| ICE / Intercontinental Exchange, Inc. | 0,02 | -12,98 | 4,04 | -8,55 | 1,3627 | -0,0002 | |||
| AJG / Arthur J. Gallagher & Co. | 0,01 | -18,87 | 4,01 | -13,81 | 1,3529 | -0,0826 | |||
| MTB / M&T Bank Corporation | 0,02 | 9,14 | 4,01 | -7,94 | 1,3528 | 0,0089 | |||
| MMC / Marsh & McLennan Companies, Inc. | 0,02 | -13,27 | 3,99 | -9,83 | 1,3453 | -0,0195 | |||
| AMP / Ameriprise Financial, Inc. | 0,01 | 6,58 | 3,99 | -7,60 | 1,3442 | 0,0135 | |||
| BEN / Franklin Resources, Inc. | 0,21 | 8,38 | 3,97 | -8,56 | 1,3392 | -0,0006 | |||
| FLT / Corpay, Inc. | 0,01 | 1,64 | 3,96 | -13,09 | 1,3361 | -0,0699 | |||
| RJF / Raymond James Financial, Inc. | 0,03 | 6,34 | 3,95 | -13,50 | 1,3306 | -0,0764 | |||
| RF / Regions Financial Corporation | 0,19 | 12,15 | 3,94 | -7,11 | 1,3290 | 0,0205 | |||
| SYF / Synchrony Financial | 0,08 | 18,87 | 3,94 | -10,47 | 1,3288 | -0,0289 | |||
| PRU / Prudential Financial, Inc. | 0,04 | 5,24 | 3,94 | -10,50 | 1,3276 | -0,0290 | |||
| USB / U.S. Bancorp | 0,10 | 14,50 | 3,94 | -3,34 | 1,3272 | 0,0714 | |||
| TFC / Truist Financial Corporation | 0,10 | 6,57 | 3,92 | -14,18 | 1,3197 | -0,0871 | |||
| PYPL / PayPal Holdings, Inc. | 0,06 | 22,98 | 3,90 | -8,59 | 1,3158 | -0,0008 | |||
| KEY / KeyCorp | 0,26 | 9,99 | 3,90 | -9,22 | 1,3146 | -0,0099 | |||
| WTW / Willis Towers Watson Public Limited Company | 0,01 | -10,27 | 3,90 | -16,20 | 1,3145 | -0,1202 | |||
| NTRS / Northern Trust Corporation | 0,04 | -0,46 | 3,89 | -16,69 | 1,3120 | -0,1284 | |||
| AIZ / Assurant, Inc. | 0,02 | 0,07 | 3,89 | -10,37 | 1,3112 | -0,0268 | |||
| MET / MetLife, Inc. | 0,05 | -5,66 | 3,87 | -17,81 | 1,3053 | -0,1473 | |||
| TROW / T. Rowe Price Group, Inc. | 0,04 | 21,34 | 3,86 | -8,09 | 1,3018 | 0,0060 | |||
| BRO / Brown & Brown, Inc. | 0,03 | -17,45 | 3,84 | -12,78 | 1,2932 | -0,0627 | |||
| PNC / The PNC Financial Services Group, Inc. | 0,02 | 10,59 | 3,82 | -11,57 | 1,2885 | -0,0442 | |||
| BX / Blackstone Inc. | 0,03 | 27,31 | 3,81 | -5,34 | 1,2851 | 0,0436 | |||
| FITB / Fifth Third Bancorp | 0,11 | 10,58 | 3,80 | -10,30 | 1,2791 | -0,0253 | |||
| IVZ / Invesco Ltd. | 0,27 | 12,26 | 3,72 | -18,67 | 1,2526 | -0,1563 | |||
| CFG / Citizens Financial Group, Inc. | 0,10 | 6,22 | 3,71 | -17,61 | 1,2500 | -0,1380 | |||
| PFG / Principal Financial Group, Inc. | 0,05 | -9,49 | 3,68 | -18,61 | 1,2396 | -0,1533 | |||
| AON / Aon plc | 0,01 | -15,33 | 3,62 | -19,00 | 1,2215 | -0,1577 | |||
| FI / Fiserv, Inc. | 0,02 | -10,25 | 3,55 | -23,32 | 1,1977 | -0,2310 | |||
| ERIE / Erie Indemnity Company | 0,01 | -9,59 | 3,48 | -19,55 | 1,1737 | -0,1605 | |||
| GPN / Global Payments Inc. | 0,04 | 17,18 | 3,34 | -20,77 | 1,1264 | -0,1738 | |||
| Invesco Private Government Fund / STIV (N/A) | 2,81 | 2,81 | 0,9485 | 0,9485 | |||||
| US8252528851 / Invesco Government & Agency Portfolio, Institutional Class | 0,16 | 185,08 | 0,16 | 185,45 | 0,0530 | 0,0360 |