Grundlæggende statistik
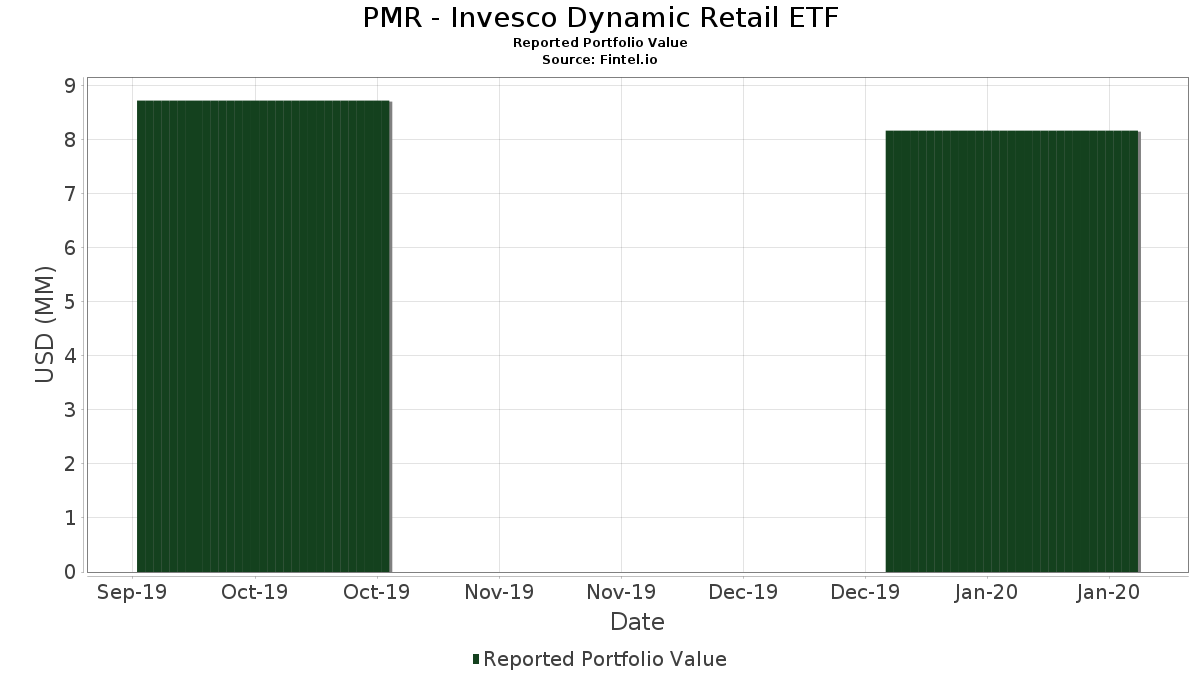
| Porteføljeværdi | $ 8.171.533 |
| Nuværende stillinger | 31 |
Seneste beholdninger, ydeevne, AUM (fra 13F, 13D)
PMR - Invesco Dynamic Retail ETF har afsløret 31 samlede besiddelser i deres seneste SEC-arkivering. Den seneste porteføljeværdi er beregnet til at være $ 8.171.533 USD. Faktiske aktiver under forvaltning (AUM) er denne værdi plus kontanter (som ikke er oplyst). PMR - Invesco Dynamic Retail ETFs største beholdninger er lululemon athletica inc. (US:LULU) , The Home Depot, Inc. (US:HD) , Costco Wholesale Corporation (US:COST) , The Kroger Co. (US:KR) , and Dollar General Corporation (US:DG) . PMR - Invesco Dynamic Retail ETFs nye stillinger omfatter The Kroger Co. (US:KR) , O'Reilly Automotive, Inc. (US:ORLY) , Williams-Sonoma, Inc. (US:WSM) , Burlington Stores, Inc. (US:BURL) , and The Buckle, Inc. (US:BKE) .
Top øger dette kvartal
Vi bruger ændringen i porteføljeallokeringen, fordi dette er den mest meningsfulde metrik. Ændringer kan skyldes handler eller ændringer i aktiekurser.
| Sikkerhed | Aktier (MM) |
Værdi (MM$) |
Portefølje % | ΔPortefølje % |
|---|---|---|---|---|
| 0,02 | 0,42 | 5,1593 | 5,1593 | |
| 0,00 | 0,39 | 4,7666 | 4,7666 | |
| 0,00 | 0,23 | 2,8274 | 2,8274 | |
| 0,00 | 0,22 | 2,7409 | 2,7409 | |
| 0,01 | 0,20 | 2,4775 | 2,4775 | |
| 0,01 | 0,20 | 2,4578 | 2,4578 | |
| 0,00 | 0,19 | 2,3814 | 2,3814 | |
| 0,00 | 0,19 | 2,3541 | 2,3541 | |
| 0,01 | 0,19 | 2,2927 | 2,2927 | |
| 0,01 | 0,23 | 2,8496 | 0,9190 |
Top falder i dette kvartal
Vi bruger ændringen i porteføljeallokeringen, fordi dette er den mest meningsfulde metrik. Ændringer kan skyldes handler eller ændringer i aktiekurser.
| Sikkerhed | Aktier (MM) |
Værdi (MM$) |
Portefølje % | ΔPortefølje % |
|---|---|---|---|---|
| 0,00 | 0,00 | -4,7706 | ||
| 0,00 | 0,00 | -4,0358 | ||
| 0,00 | 0,00 | -3,6577 | ||
| 0,00 | 0,00 | -2,8429 | ||
| 0,00 | 0,00 | -2,8257 | ||
| 0,00 | 0,19 | 2,3638 | -0,6642 | |
| 0,00 | 0,22 | 2,7021 | -0,6203 | |
| 0,00 | 0,19 | 2,3296 | -0,3998 | |
| 0,00 | 0,20 | 2,4455 | -0,3515 | |
| 0,00 | 0,23 | 2,9046 | -0,3157 |
13F og Fondsarkivering
Denne formular blev indsendt den 2020-03-31 for rapporteringsperioden 2020-01-31. Klik på linkikonet for at se den fulde transaktionshistorik.
Opgrader for at låse op for premium-data og eksportere til Excel ![]() .
.
| Sikkerhed | Type | Gennemsnitlig aktiekurs | Aktier (MM) |
Δ Aktier (%) |
Δ Aktier (%) |
Værdi ($MM) |
Portefølje (%) |
ΔPortefølje (%) |
|
|---|---|---|---|---|---|---|---|---|---|
| LULU / lululemon athletica inc. | 0,00 | -8,61 | 0,44 | 7,02 | 5,4717 | 0,3775 | |||
| HD / The Home Depot, Inc. | 0,00 | 14,56 | 0,43 | 11,34 | 5,3490 | 0,5608 | |||
| COST / Costco Wholesale Corporation | 0,00 | 10,80 | 0,43 | 13,79 | 5,3130 | 0,6628 | |||
| KR / The Kroger Co. | 0,02 | 0,42 | 5,1593 | 5,1593 | |||||
| DG / Dollar General Corporation | 0,00 | 10,75 | 0,41 | 5,96 | 5,0642 | 0,2983 | |||
| WMT / Walmart Inc. | 0,00 | 7,97 | 0,41 | 5,44 | 5,0426 | 0,2729 | |||
| ORLY / O'Reilly Automotive, Inc. | 0,00 | 0,39 | 4,7666 | 4,7666 | |||||
| TGT / Target Corporation | 0,00 | -3,64 | 0,37 | -0,27 | 4,6007 | 0,0042 | |||
| CPRT / Copart, Inc. | 0,00 | -5,65 | 0,26 | 16,14 | 3,2075 | 0,4464 | |||
| RCII / Upbound Group Inc | 0,01 | 15,92 | 0,26 | 30,96 | 3,1947 | 0,7541 | |||
| BBY / Best Buy Co., Inc. | 0,00 | -11,60 | 0,24 | 3,88 | 2,9926 | 0,1294 | |||
| BOOT / Boot Barn Holdings, Inc. | 0,01 | -2,06 | 0,24 | 17,73 | 2,9573 | 0,4427 | |||
| RH / RH | 0,00 | -21,71 | 0,23 | -10,34 | 2,9046 | -0,3157 | |||
| GO / Grocery Outlet Holding Corp. | 0,01 | 43,41 | 0,23 | 47,44 | 2,8496 | 0,9190 | |||
| AAN / The Aaron's Company, Inc. | 0,00 | 22,23 | 0,23 | -3,38 | 2,8420 | -0,0848 | |||
| WSM / Williams-Sonoma, Inc. | 0,00 | 0,23 | 2,8274 | 2,8274 | |||||
| KMX / CarMax, Inc. | 0,00 | -5,37 | 0,23 | -1,30 | 2,8157 | -0,0329 | |||
| BURL / Burlington Stores, Inc. | 0,00 | 0,22 | 2,7409 | 2,7409 | |||||
| IMKTA / Ingles Markets, Incorporated | 0,01 | -0,43 | 0,22 | 5,26 | 2,7257 | 0,1438 | |||
| GPI / Group 1 Automotive, Inc. | 0,00 | -19,97 | 0,22 | -18,96 | 2,7021 | -0,6203 | |||
| WMK / Weis Markets, Inc. | 0,01 | 12,40 | 0,22 | 6,90 | 2,6942 | 0,1867 | |||
| SAH / Sonic Automotive, Inc. | 0,01 | -8,08 | 0,22 | -9,96 | 2,6931 | -0,2839 | |||
| BKE / The Buckle, Inc. | 0,01 | 0,20 | 2,4775 | 2,4775 | |||||
| BJ / BJ's Wholesale Club Holdings, Inc. | 0,01 | 0,20 | 2,4578 | 2,4578 | |||||
| ABG / Asbury Automotive Group, Inc. | 0,00 | -6,78 | 0,20 | -12,83 | 2,4455 | -0,3515 | |||
| DDS / Dillard's, Inc. | 0,00 | 0,19 | 2,3814 | 2,3814 | |||||
| LAD / Lithia Motors, Inc. | 0,00 | -9,62 | 0,19 | -22,04 | 2,3638 | -0,6642 | |||
| PSMT / PriceSmart, Inc. | 0,00 | 0,19 | 2,3541 | 2,3541 | |||||
| AN / AutoNation, Inc. | 0,00 | 1,98 | 0,19 | -14,93 | 2,3296 | -0,3998 | |||
| SFM / Sprouts Farmers Market, Inc. | 0,01 | 0,19 | 2,2927 | 2,2927 | |||||
| US00142W8432 / Invesco Premier U.S. Government Money Portfolio, Institutional Class | 0,09 | -7,73 | 0,09 | -7,61 | 1,0517 | -0,0849 | |||
| DKS / DICK'S Sporting Goods, Inc. | 0,00 | -100,00 | 0,00 | -100,00 | -2,8429 | ||||
| GRPN / Groupon, Inc. | 0,00 | -100,00 | 0,00 | -100,00 | -2,8257 | ||||
| EBAY / eBay Inc. | 0,00 | -100,00 | 0,00 | -100,00 | -4,0358 | ||||
| BBBY / Bed Bath & Beyond, Inc. | 0,00 | -100,00 | 0,00 | -100,00 | -3,6577 | ||||
| AZO / AutoZone, Inc. | 0,00 | -100,00 | 0,00 | -100,00 | -4,7706 |