Grundlæggende statistik
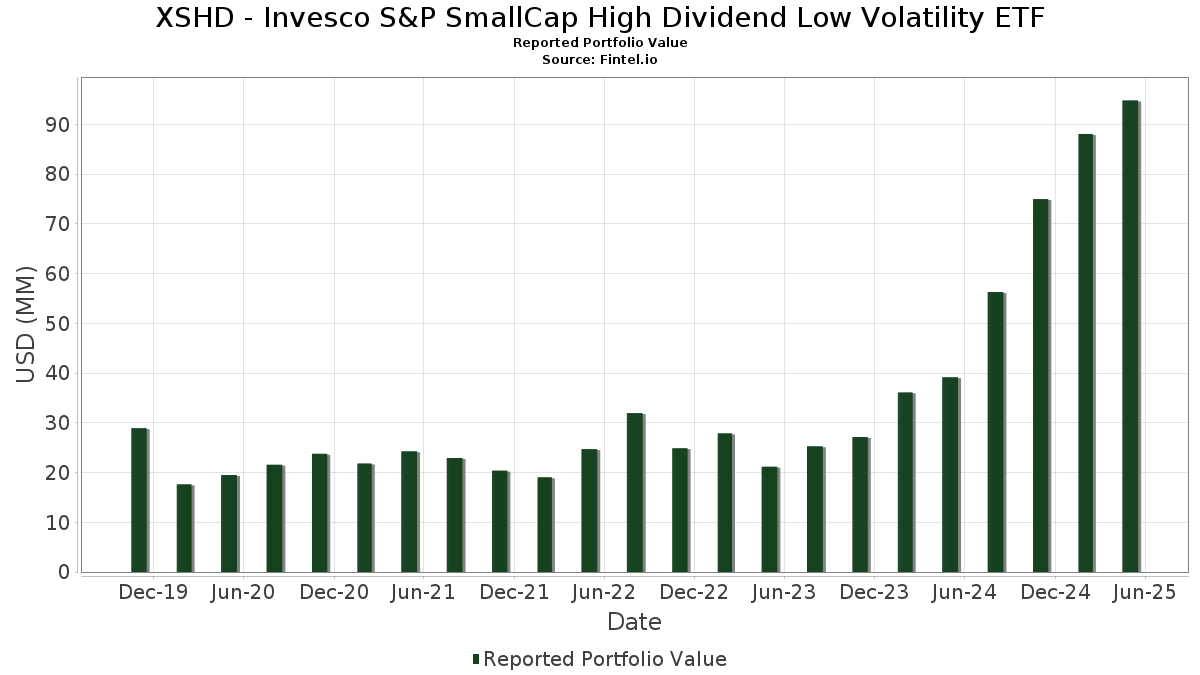
| Porteføljeværdi | $ 94.793.863 |
| Nuværende stillinger | 63 |
Seneste beholdninger, ydeevne, AUM (fra 13F, 13D)
XSHD - Invesco S&P SmallCap High Dividend Low Volatility ETF har afsløret 63 samlede besiddelser i deres seneste SEC-arkivering. Den seneste porteføljeværdi er beregnet til at være $ 94.793.863 USD. Faktiske aktiver under forvaltning (AUM) er denne værdi plus kontanter (som ikke er oplyst). XSHD - Invesco S&P SmallCap High Dividend Low Volatility ETFs største beholdninger er Global Net Lease, Inc. (US:GNL) , Universal Health Realty Income Trust (US:UHT) , Apollo Commercial Real Estate Finance, Inc. (US:ARI) , Clearway Energy, Inc. (US:CWEN) , and Universal Corporation (US:UVV) . XSHD - Invesco S&P SmallCap High Dividend Low Volatility ETFs nye stillinger omfatter Easterly Government Properties, Inc. (US:DEA) , .
Top øger dette kvartal
Vi bruger ændringen i porteføljeallokeringen, fordi dette er den mest meningsfulde metrik. Ændringer kan skyldes handler eller ændringer i aktiekurser.
| Sikkerhed | Aktier (MM) |
Værdi (MM$) |
Portefølje % | ΔPortefølje % |
|---|---|---|---|---|
| 17,07 | 17,07 | 23,9344 | 23,9344 | |
| 6,56 | 6,56 | 9,1991 | 9,1991 | |
| 0,08 | 1,76 | 2,4633 | 2,4633 | |
| 0,03 | 2,12 | 2,9747 | 0,7507 | |
| 0,07 | 2,12 | 2,9761 | 0,5046 | |
| 0,05 | 1,14 | 1,5979 | 0,4452 | |
| 0,01 | 0,80 | 1,1269 | 0,3743 | |
| 0,03 | 0,95 | 1,3342 | 0,2846 | |
| 0,06 | 1,85 | 2,5960 | 0,2752 | |
| 0,05 | 1,90 | 2,6700 | 0,2708 |
Top falder i dette kvartal
Vi bruger ændringen i porteføljeallokeringen, fordi dette er den mest meningsfulde metrik. Ændringer kan skyldes handler eller ændringer i aktiekurser.
| Sikkerhed | Aktier (MM) |
Værdi (MM$) |
Portefølje % | ΔPortefølje % |
|---|---|---|---|---|
| 0,34 | 1,51 | 2,1173 | -0,8764 | |
| 0,18 | 1,95 | 2,7273 | -0,6021 | |
| 0,02 | 0,86 | 1,2077 | -0,5515 | |
| 0,03 | 1,89 | 2,6501 | -0,4972 | |
| 0,23 | 1,59 | 2,2263 | -0,4502 | |
| 0,03 | 0,38 | 0,5396 | -0,3148 | |
| 0,13 | 1,27 | 1,7771 | -0,3105 | |
| 0,03 | 0,96 | 1,3441 | -0,2691 | |
| 0,13 | 1,43 | 2,0082 | -0,2416 | |
| 0,43 | 1,84 | 2,5788 | -0,2279 |
13F og Fondsarkivering
Denne formular blev indsendt den 2025-07-28 for rapporteringsperioden 2025-05-31. Klik på linkikonet for at se den fulde transaktionshistorik.
Opgrader for at låse op for premium-data og eksportere til Excel ![]() .
.
| Sikkerhed | Type | Gennemsnitlig aktiekurs | Aktier (MM) |
Δ Aktier (%) |
Δ Aktier (%) |
Værdi ($MM) |
Portefølje (%) |
ΔPortefølje (%) |
|
|---|---|---|---|---|---|---|---|---|---|
| Invesco Private Prime Fund / STIV (N/A) | 17,07 | 17,07 | 23,9344 | 23,9344 | |||||
| Invesco Private Government Fund / STIV (N/A) | 6,56 | 6,56 | 9,1991 | 9,1991 | |||||
| GNL / Global Net Lease, Inc. | 0,32 | 16,63 | 2,51 | 13,13 | 3,5155 | 0,2117 | |||
| UHT / Universal Health Realty Income Trust | 0,06 | 16,67 | 2,29 | 16,09 | 3,2068 | 0,2689 | |||
| ARI / Apollo Commercial Real Estate Finance, Inc. | 0,22 | 16,63 | 2,18 | 13,16 | 3,0519 | 0,1848 | |||
| CWEN / Clearway Energy, Inc. | 0,07 | 16,59 | 2,12 | 27,99 | 2,9761 | 0,5046 | |||
| UVV / Universal Corporation | 0,03 | 16,59 | 2,12 | 42,25 | 2,9747 | 0,7507 | |||
| NYMT / New York Mortgage Trust, Inc. | 0,32 | 16,64 | 2,08 | 8,68 | 2,9137 | 0,0625 | |||
| TWO / Two Harbors Investment Corp. | 0,18 | 16,62 | 1,95 | -12,90 | 2,7273 | -0,6021 | |||
| ARR / ARMOUR Residential REIT, Inc. | 0,12 | 16,61 | 1,91 | -0,78 | 2,6753 | -0,1914 | |||
| LTC / LTC Properties, Inc. | 0,05 | 16,65 | 1,90 | 18,33 | 2,6700 | 0,2708 | |||
| BXMT / Blackstone Mortgage Trust, Inc. | 0,10 | 16,59 | 1,90 | 5,98 | 2,6608 | -0,0085 | |||
| EFC / Ellington Financial Inc. | 0,15 | 16,63 | 1,89 | 2,16 | 2,6518 | -0,1080 | |||
| IIPR / Innovative Industrial Properties, Inc. | 0,03 | 16,65 | 1,89 | -10,47 | 2,6501 | -0,4972 | |||
| HIW / Highwoods Properties, Inc. | 0,06 | 16,65 | 1,85 | 18,96 | 2,5960 | 0,2752 | |||
| BDN / Brandywine Realty Trust | 0,43 | 16,63 | 1,84 | -2,28 | 2,5788 | -0,2279 | |||
| PMT / PennyMac Mortgage Investment Trust | 0,14 | 16,58 | 1,77 | -2,27 | 2,4753 | -0,2178 | |||
| DEA / Easterly Government Properties, Inc. | 0,08 | 1,76 | 2,4633 | 2,4633 | |||||
| AHH / Armada Hoffler Properties, Inc. | 0,23 | 16,65 | 1,59 | -11,59 | 2,2263 | -0,4502 | |||
| AVA / Avista Corporation | 0,04 | 16,60 | 1,56 | 12,35 | 2,1816 | 0,1170 | |||
| RC / Ready Capital Corporation | 0,34 | 16,58 | 1,51 | -24,80 | 2,1173 | -0,8764 | |||
| PZZA / Papa John's International, Inc. | 0,03 | 16,56 | 1,46 | 16,28 | 2,0435 | 0,1754 | |||
| SPTN / SpartanNash Company | 0,07 | 16,60 | 1,45 | 12,45 | 2,0262 | 0,1093 | |||
| FBRT / Franklin BSP Realty Trust, Inc. | 0,13 | 16,59 | 1,43 | -5,10 | 2,0082 | -0,2416 | |||
| NWN / Northwest Natural Holding Company | 0,03 | 16,87 | 1,42 | 17,20 | 1,9967 | 0,1842 | |||
| ETD / Ethan Allen Interiors Inc. | 0,05 | 16,86 | 1,39 | 7,18 | 1,9467 | 0,0149 | |||
| ABR / Arbor Realty Trust, Inc. | 0,13 | 16,58 | 1,27 | -9,50 | 1,7771 | -0,3105 | |||
| PINC / Premier, Inc. | 0,05 | 16,60 | 1,14 | 47,35 | 1,5979 | 0,4452 | |||
| UPBD / Upbound Group, Inc. | 0,05 | 16,60 | 1,12 | 3,52 | 1,5674 | -0,0413 | |||
| HTO / H2O America | 0,02 | 16,63 | 1,04 | 16,24 | 1,4556 | 0,1238 | |||
| DLX / Deluxe Corporation | 0,07 | 16,62 | 0,96 | 1,16 | 1,3480 | -0,0696 | |||
| CRI / Carter's, Inc. | 0,03 | 16,55 | 0,96 | -11,46 | 1,3441 | -0,2691 | |||
| FDP / Fresh Del Monte Produce Inc. | 0,03 | 16,67 | 0,95 | 35,09 | 1,3342 | 0,2846 | |||
| UTL / Unitil Corporation | 0,02 | 16,57 | 0,92 | 13,99 | 1,2919 | 0,0863 | |||
| NOG / Northern Oil and Gas, Inc. | 0,03 | 16,55 | 0,87 | -1,59 | 1,2143 | -0,0984 | |||
| CCOI / Cogent Communications Holdings, Inc. | 0,02 | 16,68 | 0,86 | -27,03 | 1,2077 | -0,5515 | |||
| JW.A / John Wiley & Sons Inc. - Class A | 0,02 | 16,68 | 0,84 | 14,40 | 1,1811 | 0,0840 | |||
| KMT / Kennametal Inc. | 0,04 | 16,59 | 0,84 | 13,38 | 1,1772 | 0,0738 | |||
| MSEX / Middlesex Water Company | 0,01 | 16,82 | 0,84 | 35,11 | 1,1711 | 0,2491 | |||
| SXT / Sensient Technologies Corporation | 0,01 | 16,88 | 0,80 | 59,33 | 1,1269 | 0,3743 | |||
| CSGS / CSG Systems International, Inc. | 0,01 | 16,44 | 0,80 | 19,73 | 1,1150 | 0,1240 | |||
| CWT / California Water Service Group | 0,02 | 16,68 | 0,76 | 21,30 | 1,0698 | 0,1321 | |||
| MDU / MDU Resources Group, Inc. | 0,04 | 16,61 | 0,75 | 16,20 | 1,0562 | 0,0898 | |||
| AWR / American States Water Company | 0,01 | 16,85 | 0,71 | 20,40 | 1,0012 | 0,1171 | |||
| CALM / Cal-Maine Foods, Inc. | 0,01 | 16,92 | 0,71 | 24,04 | 0,9991 | 0,1430 | |||
| OTTR / Otter Tail Corporation | 0,01 | 16,67 | 0,71 | 12,96 | 0,9906 | 0,0580 | |||
| TGNA / TEGNA Inc. | 0,04 | 16,62 | 0,69 | 7,02 | 0,9631 | 0,0073 | |||
| NHC / National HealthCare Corporation | 0,01 | 16,44 | 0,68 | 30,34 | 0,9576 | 0,1753 | |||
| HNI / HNI Corporation | 0,01 | 16,82 | 0,67 | 16,52 | 0,9407 | 0,0834 | |||
| INT / World Fuel Services Corp. | 0,02 | 16,68 | 0,66 | 6,81 | 0,9248 | 0,0036 | |||
| ENR / Energizer Holdings, Inc. | 0,03 | 16,67 | 0,65 | -11,65 | 0,9152 | -0,1853 | |||
| CRC / California Resources Corporation | 0,01 | 16,65 | 0,63 | 15,48 | 0,8892 | 0,0705 | |||
| AROC / Archrock, Inc. | 0,03 | 16,62 | 0,63 | 7,12 | 0,8869 | 0,0062 | |||
| IPAR / Interparfums, Inc. | 0,00 | 16,00 | 0,61 | 13,70 | 0,8613 | 0,0562 | |||
| SEE / Sealed Air Corporation | 0,02 | 16,63 | 0,60 | 9,85 | 0,8445 | 0,0273 | |||
| TRN / Trinity Industries, Inc. | 0,02 | 16,64 | 0,58 | -3,48 | 0,8183 | -0,0827 | |||
| SEM / Select Medical Holdings Corporation | 0,04 | 16,64 | 0,58 | -1,87 | 0,8104 | -0,0685 | |||
| SCL / Stepan Company | 0,01 | 16,44 | 0,56 | 2,36 | 0,7915 | -0,0307 | |||
| VSH / Vishay Intertechnology, Inc. | 0,04 | 16,62 | 0,55 | -4,33 | 0,7744 | -0,0857 | |||
| RHI / Robert Half Inc. | 0,01 | 16,43 | 0,55 | -9,82 | 0,7734 | -0,1380 | |||
| ASIX / AdvanSix Inc. | 0,02 | 16,68 | 0,47 | -1,68 | 0,6566 | -0,0539 | |||
| HP / Helmerich & Payne, Inc. | 0,03 | 16,72 | 0,38 | -32,98 | 0,5396 | -0,3148 | |||
| US8252528851 / Invesco Government & Agency Portfolio, Institutional Class | 0,04 | 2.425,02 | 0,04 | 3.900,00 | 0,0563 | 0,0484 |