Grundlæggende statistik
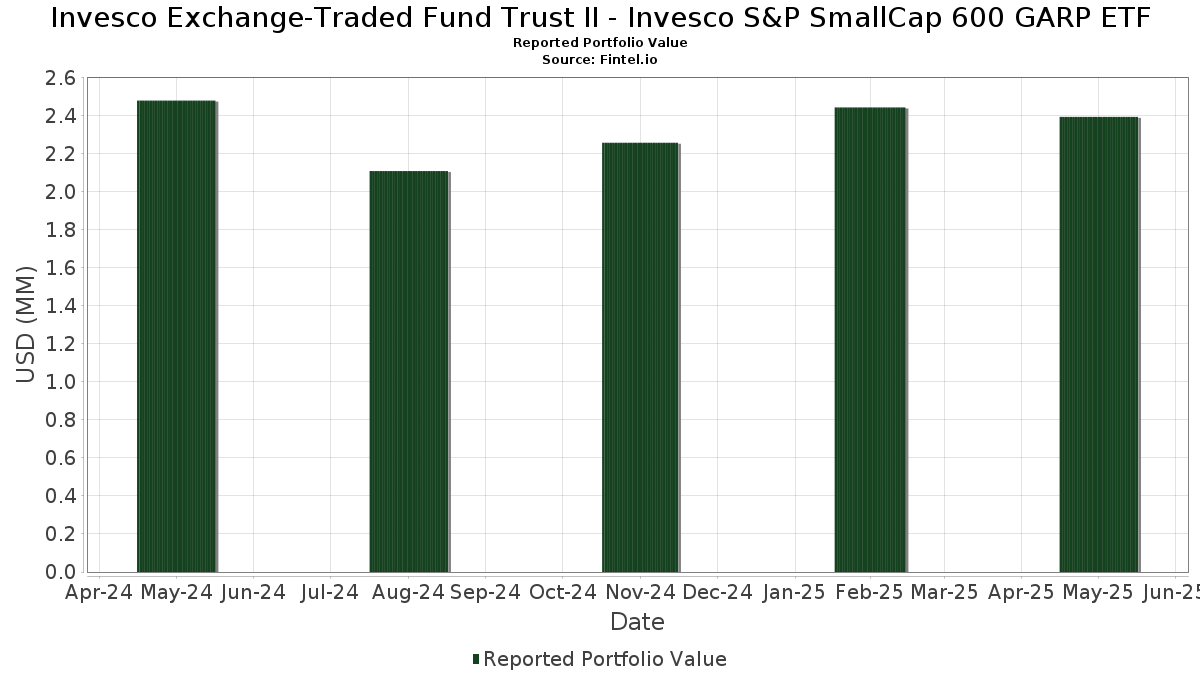
| Porteføljeværdi | $ 2.393.715 |
| Nuværende stillinger | 90 |
Seneste beholdninger, ydeevne, AUM (fra 13F, 13D)
Invesco Exchange-Traded Fund Trust II - Invesco S&P SmallCap 600 GARP ETF har afsløret 90 samlede besiddelser i deres seneste SEC-arkivering. Den seneste porteføljeværdi er beregnet til at være $ 2.393.715 USD. Faktiske aktiver under forvaltning (AUM) er denne værdi plus kontanter (som ikke er oplyst). Invesco Exchange-Traded Fund Trust II - Invesco S&P SmallCap 600 GARP ETFs største beholdninger er Palomar Holdings, Inc. (US:PLMR) , Progyny, Inc. (US:PGNY) , Urban Outfitters, Inc. (US:URBN) , Par Pacific Holdings, Inc. (US:PARR) , and REX American Resources Corporation (US:REX) .
Top øger dette kvartal
Vi bruger ændringen i porteføljeallokeringen, fordi dette er den mest meningsfulde metrik. Ændringer kan skyldes handler eller ændringer i aktiekurser.
| Sikkerhed | Aktier (MM) |
Værdi (MM$) |
Portefølje % | ΔPortefølje % |
|---|---|---|---|---|
| 0,00 | 0,07 | 2,9567 | 0,7829 | |
| 0,00 | 0,05 | 2,0426 | 0,7105 | |
| 0,00 | 0,04 | 1,5071 | 0,4480 | |
| 0,00 | 0,04 | 1,7334 | 0,4084 | |
| 0,00 | 0,05 | 2,0837 | 0,3841 | |
| 0,00 | 0,03 | 1,3118 | 0,3302 | |
| 0,00 | 0,03 | 1,3086 | 0,3046 | |
| 0,00 | 0,03 | 1,2090 | 0,2780 | |
| 0,00 | 0,02 | 0,9728 | 0,2439 | |
| 0,00 | 0,02 | 0,9809 | 0,2293 |
Top falder i dette kvartal
Vi bruger ændringen i porteføljeallokeringen, fordi dette er den mest meningsfulde metrik. Ændringer kan skyldes handler eller ændringer i aktiekurser.
| Sikkerhed | Aktier (MM) |
Værdi (MM$) |
Portefølje % | ΔPortefølje % |
|---|---|---|---|---|
| 0,00 | 0,02 | 0,7163 | -0,5038 | |
| 0,00 | 0,03 | 1,2470 | -0,5034 | |
| 0,00 | 0,02 | 1,0147 | -0,4668 | |
| 0,00 | 0,02 | 0,7793 | -0,2872 | |
| 0,01 | 0,03 | 1,2079 | -0,2795 | |
| 0,00 | 0,02 | 0,8789 | -0,2667 | |
| 0,00 | 0,02 | 0,9894 | -0,2529 | |
| 0,00 | 0,02 | 0,8010 | -0,2069 | |
| 0,00 | 0,02 | 0,9776 | -0,1981 | |
| 0,00 | 0,01 | 0,6060 | -0,1910 |
13F og Fondsarkivering
Denne formular blev indsendt den 2025-07-28 for rapporteringsperioden 2025-05-31. Klik på linkikonet for at se den fulde transaktionshistorik.
Opgrader for at låse op for premium-data og eksportere til Excel ![]() .
.
| Sikkerhed | Type | Gennemsnitlig aktiekurs | Aktier (MM) |
Δ Aktier (%) |
Δ Aktier (%) |
Værdi ($MM) |
Portefølje (%) |
ΔPortefølje (%) |
|
|---|---|---|---|---|---|---|---|---|---|
| PLMR / Palomar Holdings, Inc. | 0,00 | 0,00 | 0,07 | 32,08 | 2,9567 | 0,7829 | |||
| PGNY / Progyny, Inc. | 0,00 | -0,35 | 0,06 | -3,51 | 2,2980 | -0,0698 | |||
| URBN / Urban Outfitters, Inc. | 0,00 | 0,00 | 0,05 | 19,51 | 2,0837 | 0,3841 | |||
| PARR / Par Pacific Holdings, Inc. | 0,00 | 0,00 | 0,05 | 50,00 | 2,0426 | 0,7105 | |||
| REX / REX American Resources Corporation | 0,00 | -0,43 | 0,05 | 9,09 | 2,0303 | 0,1992 | |||
| CPRX / Catalyst Pharmaceuticals, Inc. | 0,00 | -0,52 | 0,05 | 9,09 | 2,0071 | 0,1942 | |||
| HCI / HCI Group, Inc. | 0,00 | 0,00 | 0,04 | 28,13 | 1,7334 | 0,4084 | |||
| MCRI / Monarch Casino & Resort, Inc. | 0,00 | 0,00 | 0,04 | -9,52 | 1,6222 | -0,1161 | |||
| IPAR / Interparfums, Inc. | 0,00 | 0,35 | 0,04 | -2,56 | 1,6209 | 0,0069 | |||
| DY / Dycom Industries, Inc. | 0,00 | -0,63 | 0,04 | 44,00 | 1,5071 | 0,4480 | |||
| IDCC / InterDigital, Inc. | 0,00 | -0,60 | 0,04 | 0,00 | 1,4967 | 0,0459 | |||
| CALM / Cal-Maine Foods, Inc. | 0,00 | 0,00 | 0,04 | 6,06 | 1,4779 | 0,1134 | |||
| GPI / Group 1 Automotive, Inc. | 0,00 | 0,00 | 0,03 | -8,11 | 1,4513 | -0,0904 | |||
| FBP / First BanCorp. | 0,00 | 0,00 | 0,03 | 3,13 | 1,3847 | 0,0626 | |||
| LPG / Dorian LPG Ltd. | 0,00 | 0,00 | 0,03 | 6,67 | 1,3453 | 0,0918 | |||
| HCC / Warrior Met Coal, Inc. | 0,00 | 0,00 | 0,03 | -6,06 | 1,3188 | -0,0499 | |||
| BOOT / Boot Barn Holdings, Inc. | 0,00 | 0,00 | 0,03 | 34,78 | 1,3118 | 0,3302 | |||
| SPNT / SiriusPoint Ltd. | 0,00 | 0,00 | 0,03 | 29,17 | 1,3086 | 0,3046 | |||
| XPEL / XPEL, Inc. | 0,00 | 0,00 | 0,03 | 7,14 | 1,2840 | 0,1147 | |||
| STBA / S&T Bancorp, Inc. | 0,00 | 0,00 | 0,03 | -9,09 | 1,2734 | -0,0955 | |||
| ACLS / Axcelis Technologies, Inc. | 0,00 | 0,00 | 0,03 | 3,45 | 1,2632 | 0,0595 | |||
| LQDT / Liquidity Services, Inc. | 0,00 | 0,00 | 0,03 | -30,95 | 1,2470 | -0,5034 | |||
| YELP / Yelp Inc. | 0,00 | 0,00 | 0,03 | 11,54 | 1,2430 | 0,1482 | |||
| TR / Tootsie Roll Industries, Inc. | 0,00 | 2,98 | 0,03 | 20,83 | 1,2339 | 0,2133 | |||
| SIG / Signet Jewelers Limited | 0,00 | 0,00 | 0,03 | 27,27 | 1,2090 | 0,2780 | |||
| RES / RPC, Inc. | 0,01 | 0,00 | 0,03 | -22,22 | 1,2079 | -0,2795 | |||
| GRBK / Green Brick Partners, Inc. | 0,00 | 0,00 | 0,03 | -3,45 | 1,1909 | -0,0015 | |||
| UFPT / UFP Technologies, Inc. | 0,00 | 0,00 | 0,03 | 3,70 | 1,1831 | 0,0566 | |||
| HRMY / Harmony Biosciences Holdings, Inc. | 0,00 | 0,00 | 0,03 | 3,70 | 1,1696 | 0,0452 | |||
| ALKS / Alkermes plc | 0,00 | 0,00 | 0,03 | -9,68 | 1,1694 | -0,1157 | |||
| POWL / Powell Industries, Inc. | 0,00 | 0,00 | 0,03 | -3,57 | 1,1683 | 0,0228 | |||
| PFBC / Preferred Bank | 0,00 | -0,61 | 0,03 | -6,90 | 1,1415 | -0,0530 | |||
| CNR / Core Natural Resources, Inc. | 0,00 | 0,00 | 0,03 | -6,90 | 1,1342 | -0,0565 | |||
| COLL / Collegium Pharmaceutical, Inc. | 0,00 | 0,00 | 0,03 | 0,00 | 1,1315 | 0,0262 | |||
| ABG / Asbury Automotive Group, Inc. | 0,00 | 0,00 | 0,03 | -16,13 | 1,1133 | -0,1713 | |||
| AWI / Armstrong World Industries, Inc. | 0,00 | 0,00 | 0,03 | 0,00 | 1,1111 | 0,0362 | |||
| BMI / Badger Meter, Inc. | 0,00 | 0,00 | 0,03 | 18,18 | 1,1089 | 0,1882 | |||
| NOG / Northern Oil and Gas, Inc. | 0,00 | 0,00 | 0,03 | -16,13 | 1,1064 | -0,1784 | |||
| GIII / G-III Apparel Group, Ltd. | 0,00 | 0,00 | 0,03 | 8,33 | 1,0988 | 0,0955 | |||
| HSII / Heidrick & Struggles International, Inc. | 0,00 | 0,00 | 0,03 | 4,17 | 1,0809 | 0,0866 | |||
| MGY / Magnolia Oil & Gas Corporation | 0,00 | 0,00 | 0,03 | -10,71 | 1,0790 | -0,0722 | |||
| TBBK / The Bancorp, Inc. | 0,00 | 0,00 | 0,03 | -7,41 | 1,0689 | -0,0752 | |||
| CASH / Pathward Financial, Inc. | 0,00 | 0,00 | 0,03 | 0,00 | 1,0656 | 0,0287 | |||
| TDW / Tidewater Inc. | 0,00 | 0,00 | 0,03 | -13,79 | 1,0561 | -0,1327 | |||
| CUBI / Customers Bancorp, Inc. | 0,00 | -0,81 | 0,02 | -7,69 | 1,0361 | -0,0485 | |||
| OTTR / Otter Tail Corporation | 0,00 | -0,31 | 0,02 | -4,00 | 1,0215 | -0,0157 | |||
| OFG / OFG Bancorp | 0,00 | 0,00 | 0,02 | -4,00 | 1,0203 | -0,0122 | |||
| DORM / Dorman Products, Inc. | 0,00 | 0,00 | 0,02 | 0,00 | 1,0150 | 0,0039 | |||
| LBRT / Liberty Energy Inc. | 0,00 | 0,00 | 0,02 | -33,33 | 1,0147 | -0,4668 | |||
| CVCO / Cavco Industries, Inc. | 0,00 | 0,00 | 0,02 | -17,24 | 1,0138 | -0,1879 | |||
| AX / Axos Financial, Inc. | 0,00 | -0,86 | 0,02 | 4,35 | 1,0046 | 0,0508 | |||
| SXC / SunCoke Energy, Inc. | 0,00 | 0,00 | 0,02 | -11,54 | 0,9985 | -0,0916 | |||
| BANF / BancFirst Corporation | 0,00 | 0,00 | 0,02 | 4,55 | 0,9916 | 0,0541 | |||
| AMPH / Amphastar Pharmaceuticals, Inc. | 0,00 | 0,00 | 0,02 | -11,54 | 0,9897 | -0,0826 | |||
| WHD / Cactus, Inc. | 0,00 | 0,00 | 0,02 | -23,33 | 0,9894 | -0,2529 | |||
| HWKN / Hawkins, Inc. | 0,00 | 0,57 | 0,02 | 27,78 | 0,9809 | 0,2293 | |||
| AMR / Alpha Metallurgical Resources, Inc. | 0,00 | 0,00 | 0,02 | -17,86 | 0,9776 | -0,1981 | |||
| AGYS / Agilysys, Inc. | 0,00 | 0,00 | 0,02 | 35,29 | 0,9728 | 0,2439 | |||
| GMS / GMS Inc. | 0,00 | -0,32 | 0,02 | -4,17 | 0,9707 | -0,0324 | |||
| ALG / Alamo Group Inc. | 0,00 | 0,00 | 0,02 | 15,00 | 0,9674 | 0,1299 | |||
| DNOW / DNOW Inc. | 0,00 | 0,00 | 0,02 | -12,00 | 0,9591 | -0,0823 | |||
| RUSHA / Rush Enterprises, Inc. | 0,00 | 0,00 | 0,02 | -15,38 | 0,9577 | -0,1445 | |||
| FSS / Federal Signal Corporation | 0,00 | 0,00 | 0,02 | 15,79 | 0,9190 | 0,1410 | |||
| IBP / Installed Building Products, Inc. | 0,00 | 0,00 | 0,02 | -4,35 | 0,9189 | -0,0488 | |||
| SITC / SITE Centers Corp. | 0,00 | 0,00 | 0,02 | -16,00 | 0,9157 | -0,1389 | |||
| CRVL / CorVel Corporation | 0,00 | 0,52 | 0,02 | 0,00 | 0,8966 | 0,0305 | |||
| IOSP / Innospec Inc. | 0,00 | 0,00 | 0,02 | -19,23 | 0,8951 | -0,1709 | |||
| AGO / Assured Guaranty Ltd. | 0,00 | -0,79 | 0,02 | -4,55 | 0,8860 | -0,0178 | |||
| WABC / Westamerica Bancorporation | 0,00 | 0,00 | 0,02 | -4,55 | 0,8827 | -0,0555 | |||
| GES / Guess?, Inc. | 0,00 | 0,00 | 0,02 | 5,00 | 0,8803 | 0,0441 | |||
| SHOO / Steven Madden, Ltd. | 0,00 | 0,00 | 0,02 | -25,00 | 0,8789 | -0,2667 | |||
| WSFS / WSFS Financial Corporation | 0,00 | 0,00 | 0,02 | -4,76 | 0,8634 | -0,0050 | |||
| FELE / Franklin Electric Co., Inc. | 0,00 | -0,83 | 0,02 | -16,67 | 0,8620 | -0,1451 | |||
| CATY / Cathay General Bancorp | 0,00 | 0,00 | 0,02 | -9,09 | 0,8481 | -0,0623 | |||
| FCF / First Commonwealth Financial Corporation | 0,00 | 0,00 | 0,02 | -5,00 | 0,8067 | -0,0252 | |||
| MATX / Matson, Inc. | 0,00 | -0,58 | 0,02 | -20,83 | 0,8010 | -0,2069 | |||
| ADS / Bread Financial Holdings Inc | 0,00 | 0,00 | 0,02 | -5,26 | 0,7915 | -0,0258 | |||
| SM / SM Energy Company | 0,00 | 0,00 | 0,02 | -30,77 | 0,7793 | -0,2872 | |||
| HLIT / Harmonic Inc. | 0,00 | 0,00 | 0,02 | -10,53 | 0,7185 | -0,0862 | |||
| HP / Helmerich & Payne, Inc. | 0,00 | 0,00 | 0,02 | -41,38 | 0,7163 | -0,5038 | |||
| MGPI / MGP Ingredients, Inc. | 0,00 | 0,00 | 0,02 | -11,11 | 0,6903 | -0,0624 | |||
| PLAB / Photronics, Inc. | 0,00 | 0,00 | 0,02 | -20,00 | 0,6795 | -0,1509 | |||
| PRG / PROG Holdings, Inc. | 0,00 | 0,00 | 0,02 | 6,67 | 0,6680 | 0,0239 | |||
| VRTS / Virtus Investment Partners, Inc. | 0,00 | 0,00 | 0,02 | -11,76 | 0,6557 | -0,0510 | |||
| ARCB / ArcBest Corporation | 0,00 | -0,42 | 0,01 | -22,22 | 0,6229 | -0,1472 | |||
| SLVM / Sylvamo Corporation | 0,00 | 0,00 | 0,01 | -26,32 | 0,6060 | -0,1910 | |||
| APOG / Apogee Enterprises, Inc. | 0,00 | 0,00 | 0,01 | -18,75 | 0,5664 | -0,1220 | |||
| SCVL / Shoe Carnival, Inc. | 0,00 | 0,00 | 0,01 | -14,29 | 0,5192 | -0,0668 | |||
| CAL / Caleres, Inc. | 0,00 | 0,00 | 0,01 | -14,29 | 0,5026 | -0,0891 | |||
| US8252528851 / Invesco Government & Agency Portfolio, Institutional Class | 0,00 | 235,66 | 0,00 | 200,00 | 0,1529 | 0,1012 |