Grundlæggende statistik
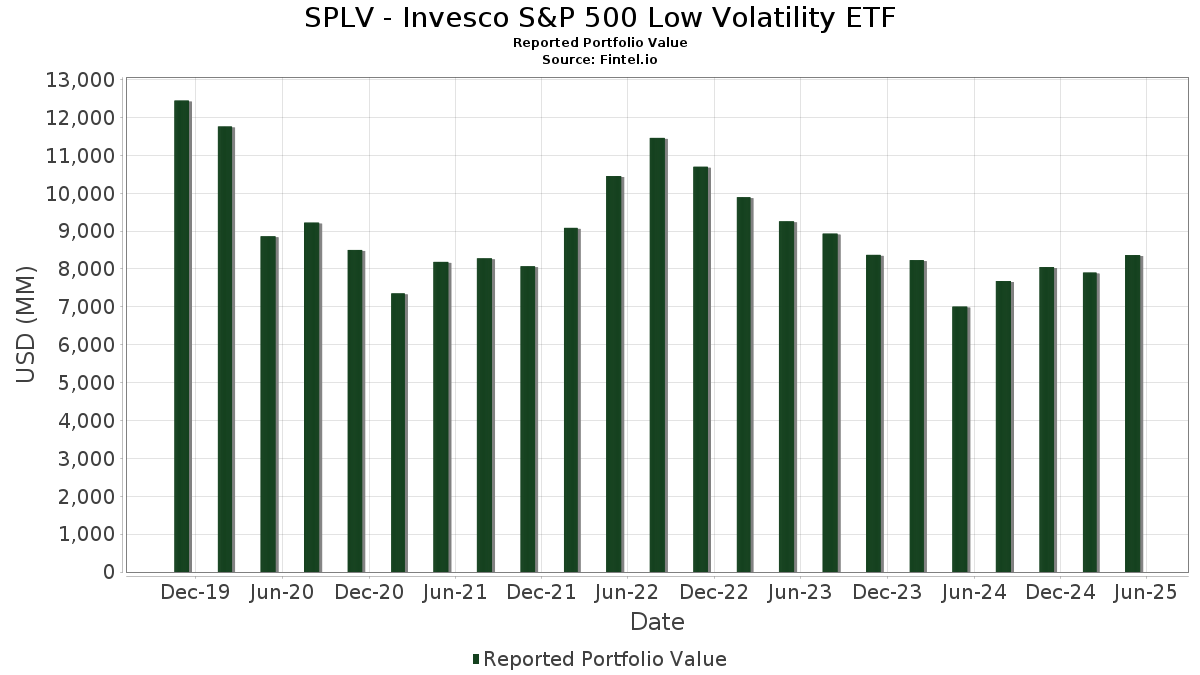
| Porteføljeværdi | $ 8.367.806.887 |
| Nuværende stillinger | 102 |
Seneste beholdninger, ydeevne, AUM (fra 13F, 13D)
SPLV - Invesco S&P 500 Low Volatility ETF har afsløret 102 samlede besiddelser i deres seneste SEC-arkivering. Den seneste porteføljeværdi er beregnet til at være $ 8.367.806.887 USD. Faktiske aktiver under forvaltning (AUM) er denne værdi plus kontanter (som ikke er oplyst). SPLV - Invesco S&P 500 Low Volatility ETFs største beholdninger er The Coca-Cola Company (US:KO) , Evergy, Inc. (US:EVRG) , Marsh & McLennan Companies, Inc. (US:MMC) , CME Group Inc. (US:CME) , and Republic Services, Inc. (US:RSG) . SPLV - Invesco S&P 500 Low Volatility ETFs nye stillinger omfatter Ventas, Inc. (US:VTR) , Invitation Homes Inc. (US:INVH) , .
Top øger dette kvartal
Vi bruger ændringen i porteføljeallokeringen, fordi dette er den mest meningsfulde metrik. Ændringer kan skyldes handler eller ændringer i aktiekurser.
| Sikkerhed | Aktier (MM) |
Værdi (MM$) |
Portefølje % | ΔPortefølje % |
|---|---|---|---|---|
| 236,46 | 236,46 | 2,9402 | 2,9402 | |
| 90,85 | 90,85 | 1,1296 | 1,1296 | |
| 0,33 | 80,19 | 0,9971 | 0,9971 | |
| 1,29 | 73,85 | 0,9183 | 0,9183 | |
| 0,99 | 72,32 | 0,8992 | 0,8992 | |
| 0,55 | 72,20 | 0,8977 | 0,8977 | |
| 1,12 | 71,67 | 0,8912 | 0,8912 | |
| 2,10 | 70,77 | 0,8800 | 0,8800 | |
| 1,15 | 80,90 | 1,0060 | 0,1789 | |
| 0,34 | 84,07 | 1,0453 | 0,1444 |
Top falder i dette kvartal
Vi bruger ændringen i porteføljeallokeringen, fordi dette er den mest meningsfulde metrik. Ændringer kan skyldes handler eller ændringer i aktiekurser.
| Sikkerhed | Aktier (MM) |
Værdi (MM$) |
Portefølje % | ΔPortefølje % |
|---|---|---|---|---|
| 0,00 | 0,00 | -0,9109 | ||
| 0,00 | 0,00 | -0,8425 | ||
| 0,00 | 0,00 | -0,8138 | ||
| 0,49 | 69,95 | 0,8698 | -0,2350 | |
| 0,17 | 84,14 | 1,0462 | -0,2218 | |
| 0,31 | 76,54 | 0,9518 | -0,1682 | |
| 0,91 | 74,13 | 0,9218 | -0,1409 | |
| 1,35 | 75,68 | 0,9411 | -0,1257 | |
| 0,15 | 75,52 | 0,9390 | -0,1129 | |
| 0,69 | 77,92 | 0,9688 | -0,1102 |
13F og Fondsarkivering
Denne formular blev indsendt den 2025-07-28 for rapporteringsperioden 2025-05-31. Klik på linkikonet for at se den fulde transaktionshistorik.
Opgrader for at låse op for premium-data og eksportere til Excel ![]() .
.
| Sikkerhed | Type | Gennemsnitlig aktiekurs | Aktier (MM) |
Δ Aktier (%) |
Δ Aktier (%) |
Værdi ($MM) |
Portefølje (%) |
ΔPortefølje (%) |
|
|---|---|---|---|---|---|---|---|---|---|
| Invesco Private Prime Fund / STIV (N/A) | 236,46 | 236,46 | 2,9402 | 2,9402 | |||||
| KO / The Coca-Cola Company | 1,38 | -2,98 | 99,17 | -1,77 | 1,2331 | -0,0762 | |||
| EVRG / Evergy, Inc. | 1,48 | 15,55 | 98,02 | 11,36 | 1,2188 | 0,0772 | |||
| MMC / Marsh & McLennan Companies, Inc. | 0,41 | -1,68 | 96,47 | -3,41 | 1,1996 | -0,0958 | |||
| CME / CME Group Inc. | 0,32 | 1,40 | 93,89 | 15,48 | 1,1674 | 0,1129 | |||
| RSG / Republic Services, Inc. | 0,36 | -7,86 | 93,36 | 0,02 | 1,1608 | -0,0497 | |||
| WEC / WEC Energy Group, Inc. | 0,86 | 14,70 | 92,49 | 15,51 | 1,1500 | 0,1116 | |||
| ATO / Atmos Energy Corporation | 0,60 | 2,38 | 92,44 | 4,10 | 1,1494 | -0,0023 | |||
| KMB / Kimberly-Clark Corporation | 0,64 | 13,81 | 92,27 | 15,21 | 1,1473 | 0,1086 | |||
| PG / The Procter & Gamble Company | 0,54 | 5,36 | 92,22 | 2,97 | 1,1466 | -0,0149 | |||
| Invesco Private Government Fund / STIV (N/A) | 90,85 | 90,85 | 1,1296 | 1,1296 | |||||
| CMS / CMS Energy Corporation | 1,29 | 11,43 | 90,82 | 7,12 | 1,1292 | 0,0297 | |||
| ADP / Automatic Data Processing, Inc. | 0,28 | -0,23 | 90,60 | 3,04 | 1,1266 | -0,0138 | |||
| CHD / Church & Dwight Co., Inc. | 0,92 | 24,55 | 90,50 | 10,11 | 1,1254 | 0,0593 | |||
| LIN / Linde plc | 0,19 | -1,11 | 89,73 | -1,00 | 1,1158 | -0,0598 | |||
| PNW / Pinnacle West Capital Corporation | 0,98 | 19,09 | 89,63 | 17,40 | 1,1145 | 0,1243 | |||
| DUK / Duke Energy Corporation | 0,76 | 10,70 | 89,48 | 10,91 | 1,1126 | 0,0663 | |||
| PPL / PPL Corporation | 2,55 | 9,36 | 88,73 | 7,93 | 1,1033 | 0,0371 | |||
| ICE / Intercontinental Exchange, Inc. | 0,49 | 3,43 | 88,16 | 7,35 | 1,0963 | 0,0311 | |||
| O / Realty Income Corporation | 1,55 | 11,35 | 87,55 | 10,55 | 1,0886 | 0,0615 | |||
| LNT / Alliant Energy Corporation | 1,40 | 15,99 | 86,92 | 11,86 | 1,0808 | 0,0730 | |||
| SO / The Southern Company | 0,97 | 12,81 | 86,88 | 13,08 | 1,0803 | 0,0838 | |||
| NI / NiSource Inc. | 2,17 | 4,10 | 85,98 | 0,86 | 1,0691 | -0,0366 | |||
| DTE / DTE Energy Company | 0,63 | 8,66 | 85,66 | 11,06 | 1,0651 | 0,0648 | |||
| KDP / Keurig Dr Pepper Inc. | 2,54 | 7,29 | 85,65 | 7,77 | 1,0650 | 0,0343 | |||
| MO / Altria Group, Inc. | 1,41 | 7,27 | 85,16 | 16,41 | 1,0590 | 0,1101 | |||
| TJX / The TJX Companies, Inc. | 0,67 | 6,95 | 85,11 | 8,78 | 1,0583 | 0,0436 | |||
| BRK.B / Berkshire Hathaway Inc. | 0,17 | -12,26 | 84,14 | -13,94 | 1,0462 | -0,2218 | |||
| LHX / L3Harris Technologies, Inc. | 0,34 | 2,08 | 84,07 | 21,02 | 1,0453 | 0,1444 | |||
| JNJ / Johnson & Johnson | 0,54 | 3,31 | 84,03 | -2,83 | 1,0449 | -0,0768 | |||
| AEE / Ameren Corporation | 0,87 | 13,08 | 83,92 | 7,87 | 1,0435 | 0,0345 | |||
| WTW / Willis Towers Watson Public Limited Company | 0,26 | 13,47 | 83,84 | 5,75 | 1,0426 | 0,0143 | |||
| HOLX / Hologic, Inc. | 1,34 | 14,54 | 83,44 | 12,34 | 1,0375 | 0,0742 | |||
| WM / Waste Management, Inc. | 0,34 | 13,60 | 83,05 | 17,59 | 1,0327 | 0,1167 | |||
| PEP / PepsiCo, Inc. | 0,63 | 18,40 | 83,04 | 1,41 | 1,0326 | -0,0294 | |||
| CL / Colgate-Palmolive Company | 0,89 | -5,32 | 82,75 | -3,48 | 1,0290 | -0,0830 | |||
| AEP / American Electric Power Company, Inc. | 0,80 | 15,34 | 82,32 | 12,56 | 1,0236 | 0,0751 | |||
| REG / Regency Centers Corporation | 1,14 | 12,22 | 82,19 | 5,57 | 1,0220 | 0,0122 | |||
| ECL / Ecolab Inc. | 0,31 | 18,35 | 82,12 | 16,85 | 1,0211 | 0,1097 | |||
| JKHY / Jack Henry & Associates, Inc. | 0,45 | 1,29 | 81,35 | 5,72 | 1,0115 | 0,0135 | |||
| VICI / VICI Properties Inc. | 2,56 | 11,81 | 81,29 | 9,13 | 1,0108 | 0,0447 | |||
| COR / Cencora, Inc. | 0,28 | -6,20 | 80,99 | 7,75 | 1,0071 | 0,0322 | |||
| XEL / Xcel Energy Inc. | 1,15 | -8,72 | 80,90 | 21,44 | 1,0060 | 0,1789 | |||
| ED / Consolidated Edison, Inc. | 0,77 | -3,50 | 80,87 | -0,67 | 1,0056 | -0,0504 | |||
| MA / Mastercard Incorporated | 0,14 | -2,23 | 80,33 | -0,65 | 0,9989 | -0,0498 | |||
| STE / STERIS plc | 0,33 | 80,19 | 0,9971 | 0,9971 | |||||
| EXC / Exelon Corporation | 1,83 | 9,24 | 80,10 | 8,30 | 0,9959 | 0,0367 | |||
| BDX / Becton, Dickinson and Company | 0,46 | 40,36 | 79,84 | 7,41 | 0,9928 | 0,0287 | |||
| MCD / McDonald's Corporation | 0,25 | 5,19 | 79,76 | 7,07 | 0,9918 | 0,0256 | |||
| WELL / Welltower Inc. | 0,51 | 8,11 | 79,22 | 8,65 | 0,9850 | 0,0394 | |||
| CB / Chubb Limited | 0,27 | -3,65 | 78,98 | 0,30 | 0,9820 | -0,0392 | |||
| FE / FirstEnergy Corp. | 1,88 | -10,00 | 78,96 | -2,64 | 0,9818 | -0,0701 | |||
| ABT / Abbott Laboratories | 0,59 | 10,94 | 78,82 | 7,38 | 0,9801 | 0,0281 | |||
| VLTO / Veralto Corporation | 0,78 | 11,48 | 78,81 | 12,90 | 0,9799 | 0,0746 | |||
| ORLY / O'Reilly Automotive, Inc. | 0,06 | 9,09 | 78,72 | 8,61 | 0,9788 | 0,0388 | |||
| BR / Broadridge Financial Solutions, Inc. | 0,32 | 8,55 | 78,45 | 9,27 | 0,9755 | 0,0444 | |||
| AVY / Avery Dennison Corporation | 0,44 | 13,24 | 78,30 | 7,07 | 0,9736 | 0,0251 | |||
| MDLZ / Mondelez International, Inc. | 1,16 | -5,05 | 78,17 | -0,23 | 0,9720 | -0,0442 | |||
| AON / Aon plc | 0,21 | 19,71 | 78,03 | 8,87 | 0,9702 | 0,0407 | |||
| BRO / Brown & Brown, Inc. | 0,69 | -1,67 | 77,92 | -6,34 | 0,9688 | -0,1102 | |||
| V / Visa Inc. | 0,21 | -3,81 | 77,78 | -3,15 | 0,9671 | -0,0744 | |||
| L / Loews Corporation | 0,87 | -5,17 | 77,72 | -2,31 | 0,9664 | -0,0654 | |||
| AJG / Arthur J. Gallagher & Co. | 0,22 | -3,86 | 77,60 | -1,10 | 0,9648 | -0,0527 | |||
| FDS / FactSet Research Systems Inc. | 0,17 | 12,51 | 76,89 | 11,46 | 0,9561 | 0,0996 | |||
| GD / General Dynamics Corporation | 0,28 | -6,10 | 76,76 | 3,52 | 0,9544 | -0,0072 | |||
| SYY / Sysco Corporation | 1,05 | 5,92 | 76,55 | 2,36 | 0,9518 | -0,0181 | |||
| ITW / Illinois Tool Works Inc. | 0,31 | -4,53 | 76,54 | -11,36 | 0,9518 | -0,1682 | |||
| COST / Costco Wholesale Corporation | 0,07 | 11,86 | 76,36 | 10,96 | 0,9495 | 0,0570 | |||
| MDT / Medtronic plc | 0,92 | 17,87 | 76,26 | 6,29 | 0,9483 | 0,0177 | |||
| AZO / AutoZone, Inc. | 0,02 | -24,11 | 76,25 | 8,54 | 0,9481 | 0,0963 | |||
| CNP / CenterPoint Energy, Inc. | 2,05 | -6,14 | 76,20 | 14,56 | 0,9475 | -0,0149 | |||
| AVB / AvalonBay Communities, Inc. | 0,37 | 11,81 | 75,94 | 2,21 | 0,9443 | -0,0193 | |||
| TSN / Tyson Foods, Inc. | 1,35 | -30,00 | 75,68 | -22,37 | 0,9411 | -0,1257 | |||
| VRSK / Verisk Analytics, Inc. | 0,24 | 4,14 | 75,64 | 10,19 | 0,9405 | 0,0502 | |||
| SPGI / S&P Global Inc. | 0,15 | -3,10 | 75,52 | -6,89 | 0,9390 | -0,1129 | |||
| ROP / Roper Technologies, Inc. | 0,13 | 5,64 | 75,38 | 3,06 | 0,9373 | -0,0113 | |||
| GWW / W.W. Grainger, Inc. | 0,07 | -55,71 | 75,25 | 4,22 | 0,9357 | 0,0477 | |||
| PAYX / Paychex, Inc. | 0,48 | -0,43 | 75,23 | 3,66 | 0,9354 | -0,0058 | |||
| MSI / Motorola Solutions, Inc. | 0,18 | 11,92 | 75,15 | 5,60 | 0,9344 | 0,0115 | |||
| CAH / Cardinal Health, Inc. | 0,49 | -32,18 | 75,00 | -2,19 | 0,9326 | 0,0028 | |||
| UNP / Union Pacific Corporation | 0,34 | 25,14 | 74,54 | 12,45 | 0,9268 | 0,0671 | |||
| GIS / General Mills, Inc. | 1,37 | 16,07 | 74,39 | 3,90 | 0,9250 | -0,0036 | |||
| PEG / Public Service Enterprise Group Incorporated | 0,91 | 4,01 | 74,13 | -10,63 | 0,9218 | -0,1409 | |||
| ROL / Rollins, Inc. | 1,29 | 73,85 | 0,9183 | 0,9183 | |||||
| BSX / Boston Scientific Corporation | 0,70 | -3,42 | 73,61 | -2,05 | 0,9153 | -0,0594 | |||
| CPT / Camden Property Trust | 0,62 | -26,56 | 73,42 | -28,29 | 0,9129 | -0,0451 | |||
| MAA / Mid-America Apartment Communities, Inc. | 0,47 | -22,61 | 73,24 | -26,47 | 0,9106 | -0,0213 | |||
| SYK / Stryker Corporation | 0,19 | 7,56 | 73,17 | 6,57 | 0,9098 | 0,0194 | |||
| VZ / Verizon Communications Inc. | 1,65 | 0,07 | 72,48 | 2,07 | 0,9013 | -0,0197 | |||
| AFL / Aflac Incorporated | 0,70 | 6,10 | 72,33 | -0,45 | 0,8993 | -0,0675 | |||
| MKC / McCormick & Company, Incorporated | 0,99 | 72,32 | 0,8992 | 0,8992 | |||||
| FRT / Federal Realty Investment Trust | 0,76 | 16,01 | 72,22 | 5,07 | 0,8980 | 0,0065 | |||
| CLX / The Clorox Company | 0,55 | 72,20 | 0,8977 | 0,8977 | |||||
| DGX / Quest Diagnostics Incorporated | 0,41 | -5,73 | 71,80 | 4,10 | 0,8927 | -0,0250 | |||
| OTIS / Otis Worldwide Corporation | 0,75 | 0,87 | 71,67 | -3,61 | 0,8912 | -0,0732 | |||
| VTR / Ventas, Inc. | 1,12 | 71,67 | 0,8912 | 0,8912 | |||||
| EQR / Equity Residential | 1,02 | -31,95 | 71,56 | -26,41 | 0,8898 | -0,0200 | |||
| UDR / UDR, Inc. | 1,72 | 6,67 | 71,12 | -2,18 | 0,8843 | -0,0586 | |||
| INVH / Invitation Homes Inc. | 2,10 | 70,77 | 0,8800 | 0,8800 | |||||
| CBOE / Cboe Global Markets, Inc. | 0,31 | -3,20 | 70,40 | 7,97 | 0,8753 | 0,0078 | |||
| VRSN / VeriSign, Inc. | 0,26 | -15,61 | 70,18 | -3,34 | 0,8726 | -0,0691 | |||
| YUM / Yum! Brands, Inc. | 0,49 | -10,79 | 69,95 | -17,89 | 0,8698 | -0,2350 | |||
| CTSH / Cognizant Technology Solutions Corporation | 0,00 | -100,00 | 0,00 | -100,00 | -0,8138 | ||||
| BLK / BlackRock, Inc. | 0,00 | -100,00 | 0,00 | -100,00 | -0,9109 | ||||
| FIS / Fidelity National Information Services, Inc. | 0,00 | -100,00 | 0,00 | -100,00 | -0,8425 |