Grundlæggende statistik
| Porteføljeværdi | $ 108.962.817 |
| Nuværende stillinger | 100 |
Seneste beholdninger, ydeevne, AUM (fra 13F, 13D)
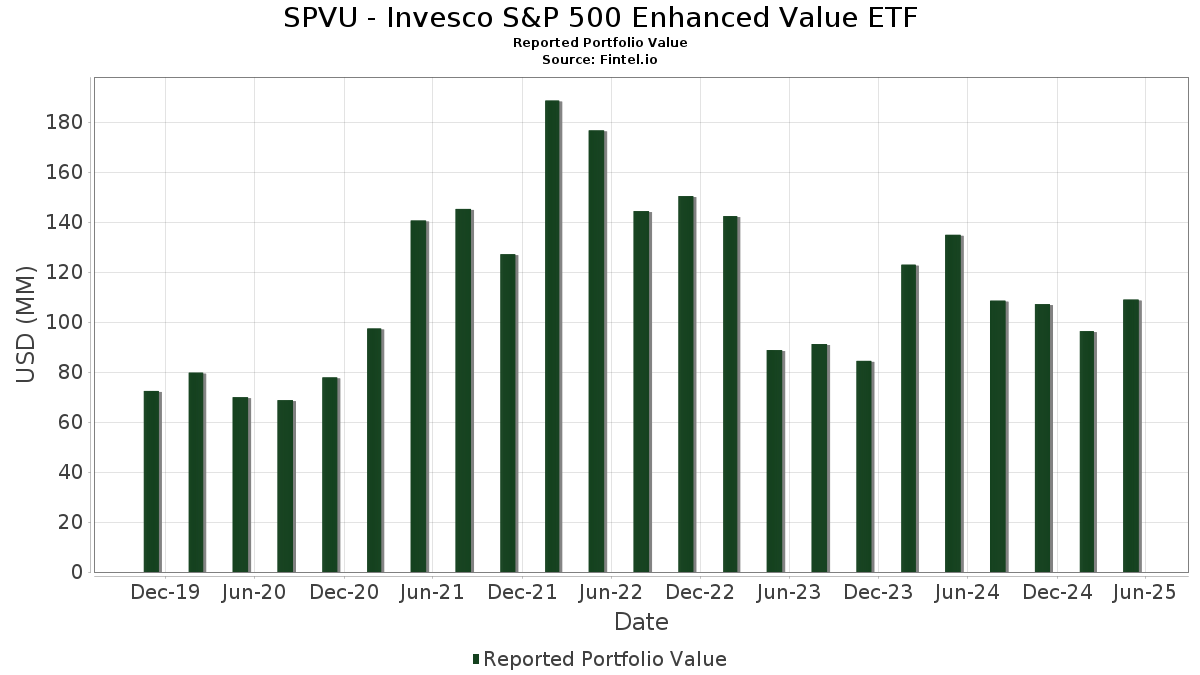
SPVU - Invesco S&P 500 Enhanced Value ETF har afsløret 100 samlede besiddelser i deres seneste SEC-arkivering. Den seneste porteføljeværdi er beregnet til at være $ 108.962.817 USD. Faktiske aktiver under forvaltning (AUM) er denne værdi plus kontanter (som ikke er oplyst). SPVU - Invesco S&P 500 Enhanced Value ETFs største beholdninger er Berkshire Hathaway Inc. (US:BRK.B) , Bank of America Corporation (US:BAC) , Exxon Mobil Corporation (US:XOM) , Wells Fargo & Company (US:WFC) , and Chevron Corporation (US:CVX) .
Top øger dette kvartal
Vi bruger ændringen i porteføljeallokeringen, fordi dette er den mest meningsfulde metrik. Ændringer kan skyldes handler eller ændringer i aktiekurser.
| Sikkerhed | Aktier (MM) |
Værdi (MM$) |
Portefølje % | ΔPortefølje % |
|---|---|---|---|---|
| 4,32 | 4,32 | 4,1875 | 4,1875 | |
| 1,66 | 1,66 | 1,6116 | 1,6116 | |
| 0,00 | 1,97 | 1,9071 | 0,2822 | |
| 0,17 | 1,73 | 1,6771 | 0,1969 | |
| 0,13 | 3,65 | 3,5396 | 0,1928 | |
| 0,08 | 3,32 | 3,2134 | 0,1861 | |
| 0,00 | 1,15 | 1,1149 | 0,1838 | |
| 0,01 | 2,35 | 2,2740 | 0,1745 | |
| 0,01 | 1,67 | 1,6152 | 0,1668 | |
| 0,01 | 0,61 | 0,5930 | 0,1605 |
Top falder i dette kvartal
Vi bruger ændringen i porteføljeallokeringen, fordi dette er den mest meningsfulde metrik. Ændringer kan skyldes handler eller ændringer i aktiekurser.
| Sikkerhed | Aktier (MM) |
Værdi (MM$) |
Portefølje % | ΔPortefølje % |
|---|---|---|---|---|
| 0,03 | 4,17 | 4,0370 | -0,4627 | |
| 0,01 | 0,93 | 0,9049 | -0,2380 | |
| 0,05 | 4,84 | 4,6877 | -0,2115 | |
| 0,02 | 0,82 | 0,7944 | -0,1501 | |
| 0,00 | 0,95 | 0,9171 | -0,1413 | |
| 0,01 | 1,49 | 1,4472 | -0,1383 | |
| 0,01 | 0,41 | 0,3997 | -0,1245 | |
| 0,01 | 0,59 | 0,5700 | -0,1202 | |
| 0,01 | 0,40 | 0,3877 | -0,1156 | |
| 0,00 | 0,00 | -0,1098 |
13F og Fondsarkivering
Denne formular blev indsendt den 2025-07-28 for rapporteringsperioden 2025-05-31. Klik på linkikonet for at se den fulde transaktionshistorik.
Opgrader for at låse op for premium-data og eksportere til Excel ![]() .
.
| Sikkerhed | Type | Gennemsnitlig aktiekurs | Aktier (MM) |
Δ Aktier (%) |
Δ Aktier (%) |
Værdi ($MM) |
Portefølje (%) |
ΔPortefølje (%) |
|
|---|---|---|---|---|---|---|---|---|---|
| BRK.B / Berkshire Hathaway Inc. | 0,01 | 13,45 | 5,78 | 11,27 | 5,6018 | 0,1160 | |||
| BAC / Bank of America Corporation | 0,11 | 13,46 | 5,07 | 8,61 | 4,9114 | -0,0159 | |||
| XOM / Exxon Mobil Corporation | 0,05 | 13,47 | 4,84 | 4,27 | 4,6877 | -0,2115 | |||
| WFC / Wells Fargo & Company | 0,06 | 13,43 | 4,74 | 8,30 | 4,5873 | -0,0282 | |||
| Invesco Private Prime Fund / STIV (N/A) | 4,32 | 4,32 | 4,1875 | 4,1875 | |||||
| CVX / Chevron Corporation | 0,03 | 13,44 | 4,17 | -2,25 | 4,0370 | -0,4627 | |||
| T / AT&T Inc. | 0,13 | 13,63 | 3,65 | 15,23 | 3,5396 | 0,1928 | |||
| CVS / CVS Health Corporation | 0,06 | 13,38 | 3,57 | 10,48 | 3,4620 | 0,0475 | |||
| VZ / Verizon Communications Inc. | 0,08 | 13,41 | 3,32 | 15,69 | 3,2134 | 0,1861 | |||
| C / Citigroup Inc. | 0,04 | 13,67 | 3,13 | 7,08 | 3,0334 | -0,0534 | |||
| CMCSA / Comcast Corporation | 0,09 | 13,65 | 3,08 | 9,50 | 2,9805 | 0,0146 | |||
| GM / General Motors Company | 0,05 | 13,66 | 2,61 | 14,73 | 2,5275 | 0,1277 | |||
| CI / The Cigna Group | 0,01 | 13,38 | 2,42 | 16,27 | 2,3467 | 0,1468 | |||
| ELV / Elevance Health, Inc. | 0,01 | 13,59 | 2,35 | 9,85 | 2,2805 | 0,0185 | |||
| CB / Chubb Limited | 0,01 | 13,37 | 2,35 | 18,05 | 2,2740 | 0,1745 | |||
| MCK / McKesson Corporation | 0,00 | 13,80 | 1,97 | 27,94 | 1,9071 | 0,2822 | |||
| F / Ford Motor Company | 0,17 | 13,59 | 1,73 | 23,47 | 1,6771 | 0,1969 | |||
| MPC / Marathon Petroleum Corporation | 0,01 | 13,54 | 1,67 | 21,50 | 1,6152 | 0,1668 | |||
| Invesco Private Government Fund / STIV (N/A) | 1,66 | 1,66 | 1,6116 | 1,6116 | |||||
| PSX / Phillips 66 | 0,01 | 13,67 | 1,49 | -0,53 | 1,4472 | -0,1383 | |||
| VLO / Valero Energy Corporation | 0,01 | 13,61 | 1,48 | 12,08 | 1,4286 | 0,0396 | |||
| COF / Capital One Financial Corporation | 0,01 | 13,20 | 1,42 | 6,77 | 1,3758 | -0,0284 | |||
| TRV / The Travelers Companies, Inc. | 0,00 | 14,00 | 1,29 | 21,64 | 1,2522 | 0,1300 | |||
| CNC / Centene Corporation | 0,02 | 13,94 | 1,27 | 10,62 | 1,2309 | 0,0178 | |||
| KR / The Kroger Co. | 0,02 | 13,85 | 1,26 | 19,85 | 1,2172 | 0,1104 | |||
| USB / U.S. Bancorp | 0,03 | 13,96 | 1,20 | 5,89 | 1,1667 | -0,0336 | |||
| ALL / The Allstate Corporation | 0,01 | 13,78 | 1,19 | 19,94 | 1,1481 | 0,1047 | |||
| COR / Cencora, Inc. | 0,00 | 13,59 | 1,15 | 30,50 | 1,1149 | 0,1838 | |||
| PRU / Prudential Financial, Inc. | 0,01 | 13,82 | 1,14 | 2,69 | 1,1084 | -0,0672 | |||
| BK / The Bank of New York Mellon Corporation | 0,01 | 14,11 | 1,09 | 13,67 | 1,0552 | 0,0437 | |||
| MET / MetLife, Inc. | 0,01 | 13,83 | 1,01 | 3,82 | 0,9744 | -0,0486 | |||
| FDX / FedEx Corporation | 0,00 | 13,81 | 0,95 | -5,59 | 0,9171 | -0,1413 | |||
| TGT / Target Corporation | 0,01 | 14,02 | 0,93 | -13,76 | 0,9049 | -0,2380 | |||
| EXC / Exelon Corporation | 0,02 | 13,64 | 0,92 | 12,67 | 0,8879 | 0,0291 | |||
| ACGL / Arch Capital Group Ltd. | 0,01 | 13,71 | 0,89 | 16,29 | 0,8580 | 0,0542 | |||
| ADM / Archer-Daniels-Midland Company | 0,02 | 13,03 | 0,86 | 15,61 | 0,8325 | 0,0477 | |||
| HUM / Humana Inc. | 0,00 | 13,62 | 0,83 | -2,01 | 0,8040 | -0,0904 | |||
| HIG / The Hartford Insurance Group, Inc. | 0,01 | 13,67 | 0,82 | 24,81 | 0,7947 | 0,1007 | |||
| DAL / Delta Air Lines, Inc. | 0,02 | 13,87 | 0,82 | -8,38 | 0,7944 | -0,1501 | |||
| CAH / Cardinal Health, Inc. | 0,01 | 14,12 | 0,81 | 36,30 | 0,7855 | 0,1567 | |||
| DHI / D.R. Horton, Inc. | 0,01 | 13,39 | 0,77 | 5,50 | 0,7434 | -0,0239 | |||
| CHTR / Charter Communications, Inc. | 0,00 | 13,18 | 0,74 | 23,53 | 0,7119 | 0,0830 | |||
| VICI / VICI Properties Inc. | 0,02 | 13,21 | 0,71 | 10,42 | 0,6885 | 0,0095 | |||
| ED / Consolidated Edison, Inc. | 0,01 | 12,63 | 0,66 | 15,79 | 0,6399 | 0,0384 | |||
| UAL / United Airlines Holdings, Inc. | 0,01 | 13,90 | 0,65 | -3,58 | 0,6272 | -0,0813 | |||
| LEN / Lennar Corporation | 0,01 | 12,85 | 0,63 | 0,16 | 0,6133 | -0,0545 | |||
| FANG / Diamondback Energy, Inc. | 0,00 | 14,37 | 0,62 | -3,12 | 0,6016 | -0,0756 | |||
| DG / Dollar General Corporation | 0,01 | 13,97 | 0,61 | 49,63 | 0,5930 | 0,1605 | |||
| MTB / M&T Bank Corporation | 0,00 | 13,18 | 0,60 | 7,89 | 0,5831 | -0,0062 | |||
| NUE / Nucor Corporation | 0,01 | 13,11 | 0,59 | -10,09 | 0,5700 | -0,1202 | |||
| STT / State Street Corporation | 0,01 | 14,09 | 0,59 | 10,80 | 0,5670 | 0,0089 | |||
| CINF / Cincinnati Financial Corporation | 0,00 | 14,26 | 0,58 | 16,57 | 0,5595 | 0,0365 | |||
| OXY / Occidental Petroleum Corporation | 0,01 | 12,65 | 0,56 | -6,00 | 0,5469 | -0,0867 | |||
| HPE / Hewlett Packard Enterprise Company | 0,03 | 13,25 | 0,54 | -1,28 | 0,5253 | -0,0542 | |||
| KHC / The Kraft Heinz Company | 0,02 | 14,11 | 0,51 | -0,77 | 0,4977 | -0,0484 | |||
| EG / Everest Group, Ltd. | 0,00 | 14,23 | 0,51 | 12,42 | 0,4912 | 0,0145 | |||
| APTV / Aptiv PLC | 0,01 | 14,18 | 0,51 | 17,17 | 0,4896 | 0,0342 | |||
| SYF / Synchrony Financial | 0,01 | 13,95 | 0,50 | 8,44 | 0,4852 | -0,0032 | |||
| DVN / Devon Energy Corporation | 0,02 | 14,10 | 0,50 | -4,76 | 0,4850 | -0,0694 | |||
| TSN / Tyson Foods, Inc. | 0,01 | 14,17 | 0,48 | 4,56 | 0,4676 | -0,0199 | |||
| PHM / PulteGroup, Inc. | 0,00 | 14,33 | 0,47 | 8,55 | 0,4552 | -0,0019 | |||
| L / Loews Corporation | 0,01 | 14,33 | 0,47 | 17,68 | 0,4518 | 0,0338 | |||
| BG / Bunge Global SA | 0,01 | 14,08 | 0,45 | 20,32 | 0,4360 | 0,0406 | |||
| HPQ / HP Inc. | 0,02 | 14,07 | 0,44 | -7,98 | 0,4246 | -0,0783 | |||
| FITB / Fifth Third Bancorp | 0,01 | 14,08 | 0,44 | 0,23 | 0,4228 | -0,0369 | |||
| MOH / Molina Healthcare, Inc. | 0,00 | 14,42 | 0,43 | 16,09 | 0,4195 | 0,0251 | |||
| DOW / Dow Inc. | 0,01 | 14,15 | 0,41 | -16,94 | 0,3997 | -0,1245 | |||
| JBL / Jabil Inc. | 0,00 | 14,21 | 0,41 | 23,80 | 0,3988 | 0,0480 | |||
| HBAN / Huntington Bancshares Incorporated | 0,03 | 14,14 | 0,41 | 8,29 | 0,3928 | -0,0023 | |||
| CFG / Citizens Financial Group, Inc. | 0,01 | 14,14 | 0,40 | 0,75 | 0,3894 | -0,0323 | |||
| LYB / LyondellBasell Industries N.V. | 0,01 | 14,16 | 0,40 | -15,97 | 0,3877 | -0,1156 | |||
| BALL / Ball Corporation | 0,01 | 14,14 | 0,38 | 16,01 | 0,3724 | 0,0228 | |||
| RF / Regions Financial Corporation | 0,02 | 14,14 | 0,38 | 3,26 | 0,3686 | -0,0206 | |||
| BIIB / Biogen Inc. | 0,00 | 13,80 | 0,38 | 5,00 | 0,3670 | -0,0134 | |||
| HAL / Halliburton Company | 0,02 | 14,07 | 0,38 | -15,44 | 0,3670 | -0,1049 | |||
| STLD / Steel Dynamics, Inc. | 0,00 | 14,35 | 0,36 | 4,03 | 0,3504 | -0,0161 | |||
| WBD / Warner Bros. Discovery, Inc. | 0,04 | 14,01 | 0,35 | -0,85 | 0,3392 | -0,0334 | |||
| BBY / Best Buy Co., Inc. | 0,00 | 13,90 | 0,30 | -16,11 | 0,2929 | -0,0872 | |||
| MOS / The Mosaic Company | 0,01 | 13,41 | 0,30 | 71,43 | 0,2913 | 0,1060 | |||
| EVRG / Evergy, Inc. | 0,00 | 14,54 | 0,28 | 10,20 | 0,2731 | 0,0035 | |||
| LKQ / LKQ Corporation | 0,01 | 14,82 | 0,27 | 9,96 | 0,2571 | 0,0027 | |||
| FOXA / Fox Corporation | 0,00 | 14,60 | 0,26 | 9,13 | 0,2556 | 0,0008 | |||
| UHS / Universal Health Services, Inc. | 0,00 | 13,88 | 0,26 | 23,58 | 0,2540 | 0,0302 | |||
| GL / Globe Life Inc. | 0,00 | 14,60 | 0,26 | 9,70 | 0,2520 | 0,0015 | |||
| TAP / Molson Coors Beverage Company | 0,00 | 14,70 | 0,26 | 0,39 | 0,2518 | -0,0218 | |||
| HII / Huntington Ingalls Industries, Inc. | 0,00 | 14,36 | 0,24 | 45,51 | 0,2357 | 0,0589 | |||
| SJM / The J. M. Smucker Company | 0,00 | 14,67 | 0,24 | 16,99 | 0,2336 | 0,0157 | |||
| KMX / CarMax, Inc. | 0,00 | 14,58 | 0,22 | -11,02 | 0,2114 | -0,0474 | |||
| AIZ / Assurant, Inc. | 0,00 | 13,41 | 0,21 | 10,75 | 0,1995 | 0,0032 | |||
| CAG / Conagra Brands, Inc. | 0,01 | 14,80 | 0,20 | 2,56 | 0,1943 | -0,0115 | |||
| PNW / Pinnacle West Capital Corporation | 0,00 | 13,06 | 0,19 | 11,18 | 0,1836 | 0,0041 | |||
| EMN / Eastman Chemical Company | 0,00 | 12,94 | 0,18 | -9,55 | 0,1749 | -0,0358 | |||
| APA / APA Corporation | 0,01 | 13,20 | 0,18 | -6,81 | 0,1729 | -0,0296 | |||
| AES / The AES Corporation | 0,02 | 13,24 | 0,18 | -1,12 | 0,1705 | -0,0180 | |||
| WBA / Walgreens Boots Alliance, Inc. | 0,02 | 13,20 | 0,18 | 19,05 | 0,1704 | 0,0147 | |||
| PARA / Paramount Global | 0,01 | 13,26 | 0,17 | 21,17 | 0,1609 | 0,0156 | |||
| MGM / MGM Resorts International | 0,00 | 13,31 | 0,16 | 3,33 | 0,1502 | -0,0084 | |||
| MHK / Mohawk Industries, Inc. | 0,00 | 12,80 | 0,15 | -3,90 | 0,1442 | -0,0186 | |||
| BEN / Franklin Resources, Inc. | 0,01 | 13,10 | 0,15 | 20,49 | 0,1433 | 0,0141 | |||
| US8252528851 / Invesco Government & Agency Portfolio, Institutional Class | 0,04 | 230,78 | 0,04 | 233,33 | 0,0389 | 0,0274 | |||
| FMC / FMC Corporation | 0,00 | -100,00 | 0,00 | -100,00 | -0,1098 |