Grundlæggende statistik
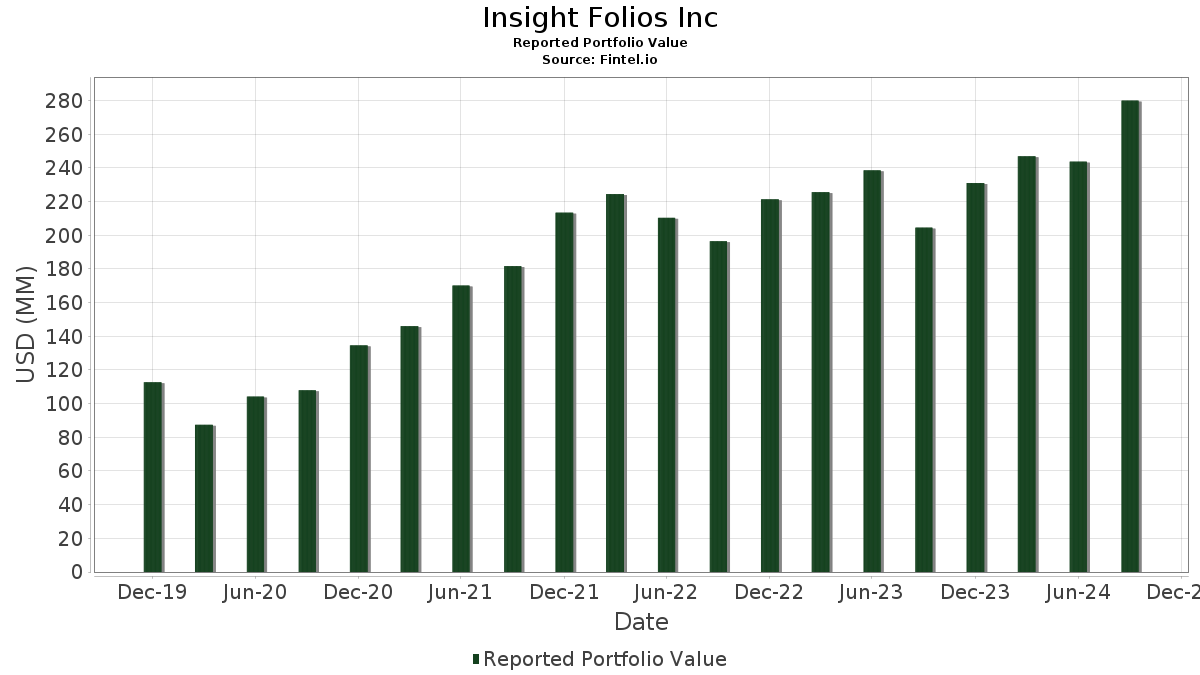
| Porteføljeværdi | $ 280.010.640 |
| Nuværende stillinger | 119 |
Seneste beholdninger, ydeevne, AUM (fra 13F, 13D)
Insight Folios Inc har afsløret 119 samlede besiddelser i deres seneste SEC-arkivering. Den seneste porteføljeværdi er beregnet til at være $ 280.010.640 USD. Faktiske aktiver under forvaltning (AUM) er denne værdi plus kontanter (som ikke er oplyst). Insight Folios Incs største beholdninger er ONEOK, Inc. (US:OKE) , Omega Healthcare Investors, Inc. (US:OHI) , AT&T Inc. (US:T) , The Southern Company (US:SO) , and Energy Transfer LP - Limited Partnership (US:ET) . Insight Folios Incs nye stillinger omfatter Shift4 Payments, Inc. (US:FOUR) , Applied Industrial Technologies, Inc. (US:AIT) , Paylocity Holding Corporation (US:PCTY) , .
Top øger dette kvartal
Vi bruger ændringen i porteføljeallokeringen, fordi dette er den mest meningsfulde metrik. Ændringer kan skyldes handler eller ændringer i aktiekurser.
| Sikkerhed | Aktier (MM) |
Værdi (MM$) |
Portefølje % | ΔPortefølje % |
|---|---|---|---|---|
| 0,12 | 11,19 | 3,9973 | 0,5323 | |
| 0,04 | 8,48 | 3,0294 | 0,4257 | |
| 0,13 | 8,45 | 3,0185 | 0,2785 | |
| 0,11 | 6,22 | 2,2204 | 0,2400 | |
| 0,18 | 6,61 | 2,3616 | 0,2198 | |
| 0,22 | 9,11 | 3,2517 | 0,2196 | |
| 0,42 | 7,42 | 2,6509 | 0,2070 | |
| 0,10 | 7,13 | 2,5466 | 0,1893 | |
| 0,08 | 7,83 | 2,7966 | 0,1677 | |
| 0,40 | 8,86 | 3,1642 | 0,1612 |
Top falder i dette kvartal
Vi bruger ændringen i porteføljeallokeringen, fordi dette er den mest meningsfulde metrik. Ændringer kan skyldes handler eller ændringer i aktiekurser.
| Sikkerhed | Aktier (MM) |
Værdi (MM$) |
Portefølje % | ΔPortefølje % |
|---|---|---|---|---|
| 0,25 | 3,79 | 1,3539 | -1,2984 | |
| 0,54 | 8,70 | 3,1088 | -0,3503 | |
| 0,05 | 6,96 | 2,4870 | -0,3405 | |
| 0,04 | 6,57 | 2,3457 | -0,2707 | |
| 0,28 | 8,09 | 2,8887 | -0,2510 | |
| 0,12 | 6,95 | 2,4829 | -0,2366 | |
| 0,07 | 8,48 | 3,0279 | -0,2355 | |
| 0,47 | 5,57 | 1,9875 | -0,1201 | |
| 0,00 | 1,41 | 0,5045 | -0,1105 | |
| 0,07 | 2,95 | 1,0537 | -0,0895 |
13F og Fondsarkivering
Denne formular blev indsendt den 2024-10-24 for rapporteringsperioden 2024-09-30. Klik på linkikonet for at se den fulde transaktionshistorik.
Opgrader for at låse op for premium-data og eksportere til Excel ![]() .
.
| Sikkerhed | Type | Gennemsnitlig aktiekurs | Aktier (MM) |
Δ Aktier (%) |
Δ Aktier (%) |
Værdi ($MM) |
Portefølje (%) |
ΔPortefølje (%) |
|
|---|---|---|---|---|---|---|---|---|---|
| OKE / ONEOK, Inc. | 0,12 | 18,59 | 11,19 | 32,53 | 3,9973 | 0,5323 | |||
| OHI / Omega Healthcare Investors, Inc. | 0,22 | 3,67 | 9,11 | 23,21 | 3,2517 | 0,2196 | |||
| T / AT&T Inc. | 0,40 | 5,14 | 8,86 | 21,05 | 3,1642 | 0,1612 | |||
| SO / The Southern Company | 0,10 | 2,98 | 8,72 | 19,73 | 3,1142 | 0,1261 | |||
| ET / Energy Transfer LP - Limited Partnership | 0,54 | 4,34 | 8,70 | 3,24 | 3,1088 | -0,3503 | |||
| IBM / International Business Machines Corporation | 0,04 | 4,56 | 8,48 | 33,66 | 3,0294 | 0,4257 | |||
| XOM / Exxon Mobil Corporation | 0,07 | 4,68 | 8,48 | 6,59 | 3,0279 | -0,2355 | |||
| O / Realty Income Corporation | 0,13 | 5,40 | 8,45 | 26,56 | 3,0185 | 0,2785 | |||
| ABBV / AbbVie Inc. | 0,04 | 4,81 | 8,36 | 20,67 | 2,9842 | 0,1433 | |||
| MO / Altria Group, Inc. | 0,16 | 4,41 | 8,33 | 16,98 | 2,9766 | 0,0538 | |||
| VZ / Verizon Communications Inc. | 0,18 | 6,34 | 8,31 | 15,80 | 2,9665 | 0,0237 | |||
| DUK / Duke Energy Corporation | 0,07 | 4,57 | 8,30 | 20,29 | 2,9644 | 0,1335 | |||
| EPD / Enterprise Products Partners L.P. - Limited Partnership | 0,28 | 5,22 | 8,09 | 5,70 | 2,8887 | -0,2510 | |||
| ED / Consolidated Edison, Inc. | 0,08 | 4,94 | 7,83 | 22,21 | 2,7966 | 0,1677 | |||
| STWD / Starwood Property Trust, Inc. | 0,37 | 6,93 | 7,45 | 15,05 | 2,6623 | 0,0042 | |||
| IVZ / Invesco Ltd. | 0,42 | 6,16 | 7,42 | 24,61 | 2,6509 | 0,2070 | |||
| EBGEF / Enbridge Inc. - Preferred Stock | 0,18 | 5,49 | 7,22 | 20,36 | 2,5801 | 0,1177 | |||
| GIS / General Mills, Inc. | 0,10 | 6,31 | 7,13 | 24,11 | 2,5466 | 0,1893 | |||
| JNJ / Johnson & Johnson | 0,04 | 6,17 | 7,04 | 17,72 | 2,5131 | 0,0606 | |||
| CVX / Chevron Corporation | 0,05 | 7,32 | 6,96 | 1,03 | 2,4870 | -0,3405 | |||
| ADM / Archer-Daniels-Midland Company | 0,12 | 6,13 | 6,95 | 4,89 | 2,4829 | -0,2366 | |||
| BKH / Black Hills Corporation | 0,11 | 6,54 | 6,91 | 19,75 | 2,4662 | 0,1003 | |||
| TD / The Toronto-Dominion Bank | 0,11 | 6,62 | 6,72 | 22,73 | 2,4008 | 0,1535 | |||
| BTI / British American Tobacco p.l.c. - Depositary Receipt (Common Stock) | 0,18 | 7,10 | 6,61 | 26,67 | 2,3616 | 0,2198 | |||
| UVV / Universal Corporation | 0,12 | 7,11 | 6,58 | 18,06 | 2,3489 | 0,0631 | |||
| NUE / Nucor Corporation | 0,04 | 8,29 | 6,57 | 3,00 | 2,3457 | -0,2707 | |||
| BNS / The Bank of Nova Scotia | 0,11 | 8,07 | 6,22 | 28,80 | 2,2204 | 0,2400 | |||
| DOW / Dow Inc. | 0,11 | 8,23 | 6,08 | 11,45 | 2,1729 | -0,0668 | |||
| HSBC / HSBC Holdings plc - Depositary Receipt (Common Stock) | 0,13 | 7,65 | 5,91 | 11,84 | 2,1115 | -0,0575 | |||
| WU / The Western Union Company | 0,47 | 10,96 | 5,57 | 8,33 | 1,9875 | -0,1201 | |||
| VGR / Vector Group Ltd. | 0,25 | -58,46 | 3,79 | -41,35 | 1,3539 | -1,2984 | |||
| SQM / Sociedad Química y Minera de Chile S.A. - Depositary Receipt (Common Stock) | 0,07 | 3,52 | 2,95 | 5,89 | 1,0537 | -0,0895 | |||
| GJR / Strats Trust For Procter & Gambel Security - Preferred Security | 0,01 | 0,43 | 1,90 | 5,49 | 0,6798 | -0,0606 | |||
| MSFT / Microsoft Corporation | 0,00 | -2,12 | 1,41 | -5,80 | 0,5045 | -0,1105 | |||
| AAPL / Apple Inc. | 0,01 | -3,68 | 1,23 | 6,57 | 0,4401 | -0,0344 | |||
| EMR / Emerson Electric Co. | 0,01 | -1,19 | 1,20 | -1,88 | 0,4294 | -0,0734 | |||
| BSV / Vanguard Bond Index Funds - Vanguard Short-Term Bond ETF | 0,02 | -1,20 | 1,19 | 1,37 | 0,4243 | -0,0566 | |||
| TSM / Taiwan Semiconductor Manufacturing Company Limited - Depositary Receipt (Common Stock) | 0,01 | -1,77 | 1,17 | -1,85 | 0,4161 | -0,0709 | |||
| WAL / Western Alliance Bancorporation | 0,01 | -2,59 | 1,08 | 34,12 | 0,3864 | 0,0554 | |||
| BRK.B / Berkshire Hathaway Inc. | 0,00 | 16,03 | 0,98 | 31,28 | 0,3509 | 0,0438 | |||
| TMUS / T-Mobile US, Inc. | 0,00 | -1,05 | 0,86 | 15,97 | 0,3061 | 0,0027 | |||
| GS / The Goldman Sachs Group, Inc. | 0,00 | -0,66 | 0,82 | 8,75 | 0,2929 | -0,0165 | |||
| WD / Walker & Dunlop, Inc. | 0,01 | -0,26 | 0,78 | 15,34 | 0,2795 | 0,0012 | |||
| HASI / HA Sustainable Infrastructure Capital, Inc. | 0,02 | -0,29 | 0,77 | 16,07 | 0,2763 | 0,0029 | |||
| BEN / Franklin Resources, Inc. | 0,04 | 0,70 | 0,77 | -9,20 | 0,2750 | -0,0730 | |||
| TSCO / Tractor Supply Company | 0,00 | -0,23 | 0,75 | 7,57 | 0,2691 | -0,0184 | |||
| PPL / PPL Corporation | 0,02 | -6,45 | 0,73 | 11,85 | 0,2599 | -0,0069 | |||
| NEE.PRN / NextEra Energy Capital Holdings, Inc. - Corporate Bond/Note | 0,01 | 1,52 | 0,71 | 21,26 | 0,2548 | 0,0133 | |||
| AMT / American Tower Corporation | 0,00 | 0,73 | 0,70 | 20,62 | 0,2508 | 0,0118 | |||
| RWT / Redwood Trust, Inc. | 0,09 | 0,05 | 0,68 | 19,19 | 0,2420 | 0,0087 | |||
| TGT / Target Corporation | 0,00 | 0,28 | 0,67 | 5,67 | 0,2398 | -0,0211 | |||
| OGS / ONE Gas, Inc. | 0,01 | 100,00 | 0,65 | 133,09 | 0,2318 | 0,1175 | |||
| COST / Costco Wholesale Corporation | 0,00 | -1,22 | 0,65 | 3,02 | 0,2315 | -0,0266 | |||
| DE / Deere & Company | 0,00 | 0,00 | 0,64 | 11,65 | 0,2294 | -0,0065 | |||
| AVGO / Broadcom Inc. | 0,00 | 864,83 | 0,63 | 3,59 | 0,2265 | -0,0246 | |||
| VICI / VICI Properties Inc. | 0,02 | 2,46 | 0,60 | 19,05 | 0,2145 | 0,0077 | |||
| BIP / Brookfield Infrastructure Partners L.P. - Limited Partnership | 0,02 | 3,24 | 0,59 | 31,98 | 0,2095 | 0,0269 | |||
| HD / The Home Depot, Inc. | 0,00 | -0,28 | 0,58 | 17,37 | 0,2078 | 0,0045 | |||
| DFS / Discover Financial Services | 0,00 | -2,77 | 0,56 | 4,28 | 0,2006 | -0,0204 | |||
| AY / Atlantica Sustainable Infrastructure plc | 0,02 | 2,39 | 0,54 | 2,46 | 0,1935 | -0,0233 | |||
| EQL / ALPS ETF Trust - ALPS Equal Sector Weight ETF | 0,00 | -0,62 | 0,53 | 7,49 | 0,1898 | -0,0130 | |||
| CVS / CVS Health Corporation | 0,01 | 3,54 | 0,52 | 10,21 | 0,1853 | -0,0078 | |||
| IXUS / iShares Trust - iShares Core MSCI Total International Stock ETF | 0,01 | -0,99 | 0,52 | 6,58 | 0,1850 | -0,0147 | |||
| QCOM / QUALCOMM Incorporated | 0,00 | -1,94 | 0,52 | -16,37 | 0,1845 | -0,0687 | |||
| MMM / 3M Company | 0,00 | -0,14 | 0,49 | 33,51 | 0,1765 | 0,0247 | |||
| TXN / Texas Instruments Incorporated | 0,00 | -0,04 | 0,47 | 6,31 | 0,1686 | -0,0139 | |||
| GRMN / Garmin Ltd. | 0,00 | -1,07 | 0,47 | 6,80 | 0,1685 | -0,0126 | |||
| KSS / Kohl's Corporation | 0,02 | 3,38 | 0,45 | -5,04 | 0,1616 | -0,0341 | |||
| KO / The Coca-Cola Company | 0,01 | 1,43 | 0,45 | 14,72 | 0,1615 | -0,0005 | |||
| NVDA / NVIDIA Corporation | 0,00 | -5,59 | 0,44 | -7,19 | 0,1568 | -0,0373 | |||
| UNH / UnitedHealth Group Incorporated | 0,00 | -19,09 | 0,44 | -7,04 | 0,1557 | -0,0369 | |||
| WMT / Walmart Inc. | 0,01 | 0,38 | 0,43 | 20,00 | 0,1543 | 0,0062 | |||
| AFL / Aflac Incorporated | 0,00 | 1,11 | 0,43 | 26,49 | 0,1521 | 0,0141 | |||
| VFC / V.F. Corporation | 0,02 | 0,86 | 0,41 | 48,91 | 0,1470 | 0,0337 | |||
| CEG / Constellation Energy Corporation | 0,00 | -2,24 | 0,40 | 26,84 | 0,1421 | 0,0135 | |||
| APD / Air Products and Chemicals, Inc. | 0,00 | -0,97 | 0,40 | 14,16 | 0,1412 | -0,0007 | |||
| TFLO / iShares Trust - iShares Treasury Floating Rate Bond ETF | 0,01 | -0,98 | 0,39 | -1,02 | 0,1387 | -0,0224 | |||
| LOW / Lowe's Companies, Inc. | 0,00 | 1,44 | 0,38 | 24,92 | 0,1362 | 0,0106 | |||
| ELV / Elevance Health, Inc. | 0,00 | 6,57 | 0,38 | 2,16 | 0,1356 | -0,0167 | |||
| GWW / W.W. Grainger, Inc. | 0,00 | 2,26 | 0,38 | 17,87 | 0,1344 | 0,0033 | |||
| SWK / Stanley Black & Decker, Inc. | 0,00 | 2,27 | 0,37 | 41,06 | 0,1327 | 0,0246 | |||
| MCD / McDonald's Corporation | 0,00 | 2,48 | 0,37 | 22,48 | 0,1305 | 0,0080 | |||
| ENLC / EnLink Midstream, LLC | 0,03 | 16,27 | 0,36 | 22,64 | 0,1299 | 0,0082 | |||
| GM / General Motors Company | 0,01 | -0,12 | 0,36 | -3,49 | 0,1286 | -0,0247 | |||
| CINF / Cincinnati Financial Corporation | 0,00 | 2,12 | 0,36 | 18,03 | 0,1286 | 0,0031 | |||
| CL / Colgate-Palmolive Company | 0,00 | 1,05 | 0,36 | 8,16 | 0,1281 | -0,0080 | |||
| CLX / The Clorox Company | 0,00 | 2,95 | 0,36 | 23,10 | 0,1277 | 0,0084 | |||
| DOV / Dover Corporation | 0,00 | 1,42 | 0,36 | 7,90 | 0,1269 | -0,0083 | |||
| DPZ / Domino's Pizza, Inc. | 0,00 | -0,12 | 0,36 | -16,67 | 0,1269 | -0,0483 | |||
| CAH / Cardinal Health, Inc. | 0,00 | 2,08 | 0,35 | 14,66 | 0,1259 | -0,0001 | |||
| NSC / Norfolk Southern Corporation | 0,00 | 0,22 | 0,35 | 16,05 | 0,1240 | 0,0012 | |||
| AOS / A. O. Smith Corporation | 0,00 | 1,72 | 0,35 | 11,97 | 0,1237 | -0,0035 | |||
| CME / CME Group Inc. | 0,00 | -1,26 | 0,35 | 10,58 | 0,1235 | -0,0045 | |||
| GD / General Dynamics Corporation | 0,00 | 1,88 | 0,34 | 6,19 | 0,1227 | -0,0101 | |||
| ADP / Automatic Data Processing, Inc. | 0,00 | 2,51 | 0,34 | 18,60 | 0,1210 | 0,0040 | |||
| AMZN / Amazon.com, Inc. | 0,00 | -3,88 | 0,34 | -7,16 | 0,1204 | -0,0288 | |||
| STAG / STAG Industrial, Inc. | 0,01 | 0,26 | 0,33 | 8,44 | 0,1196 | -0,0068 | |||
| KMB / Kimberly-Clark Corporation | 0,00 | 2,19 | 0,33 | 5,18 | 0,1164 | -0,0107 | |||
| PEP / PepsiCo, Inc. | 0,00 | 4,15 | 0,32 | 7,64 | 0,1157 | -0,0081 | |||
| ITW / Illinois Tool Works Inc. | 0,00 | 2,43 | 0,32 | 13,48 | 0,1143 | -0,0016 | |||
| ABT / Abbott Laboratories | 0,00 | 3,34 | 0,31 | 13,33 | 0,1096 | -0,0015 | |||
| PSX / Phillips 66 | 0,00 | 2,88 | 0,31 | -4,39 | 0,1091 | -0,0218 | |||
| SYY / Sysco Corporation | 0,00 | 2,99 | 0,30 | 12,59 | 0,1086 | -0,0022 | |||
| MDT / Medtronic plc | 0,00 | -0,27 | 0,30 | 14,45 | 0,1075 | -0,0008 | |||
| EVRI / Everi Holdings Inc. | 0,02 | -2,28 | 0,30 | 53,06 | 0,1073 | 0,0267 | |||
| PPG / PPG Industries, Inc. | 0,00 | 3,79 | 0,29 | 9,33 | 0,1049 | -0,0055 | |||
| MAA / Mid-America Apartment Communities, Inc. | 0,00 | 2,88 | 0,29 | 14,68 | 0,1034 | -0,0002 | |||
| SPY / SPDR S&P 500 ETF | 0,00 | -4,38 | 0,29 | 1,05 | 0,1029 | -0,0144 | |||
| GPC / Genuine Parts Company | 0,00 | 3,17 | 0,29 | 4,00 | 0,1024 | -0,0105 | |||
| HRL / Hormel Foods Corporation | 0,01 | 3,65 | 0,29 | 7,95 | 0,1020 | -0,0067 | |||
| TROW / T. Rowe Price Group, Inc. | 0,00 | 3,57 | 0,28 | -2,07 | 0,1016 | -0,0177 | |||
| MELI / MercadoLibre, Inc. | 0,00 | -0,78 | 0,26 | 23,81 | 0,0931 | 0,0068 | |||
| AXON / Axon Enterprise, Inc. | 0,00 | 0,24 | 0,0855 | 0,0855 | |||||
| IUSB / iShares Trust - iShares Core Total USD Bond Market ETF | 0,00 | 0,00 | 0,23 | 4,11 | 0,0815 | -0,0083 | |||
| TSLA / Tesla, Inc. | 0,00 | 0,22 | 0,0775 | 0,0775 | |||||
| FOUR / Shift4 Payments, Inc. | 0,00 | 0,21 | 0,0749 | 0,0749 | |||||
| AIT / Applied Industrial Technologies, Inc. | 0,00 | 0,20 | 0,0729 | 0,0729 | |||||
| PCTY / Paylocity Holding Corporation | 0,00 | 0,20 | 0,0724 | 0,0724 | |||||
| ASUR / Asure Software, Inc. | 0,02 | -0,89 | 0,17 | 6,75 | 0,0624 | -0,0047 |