Grundlæggende statistik
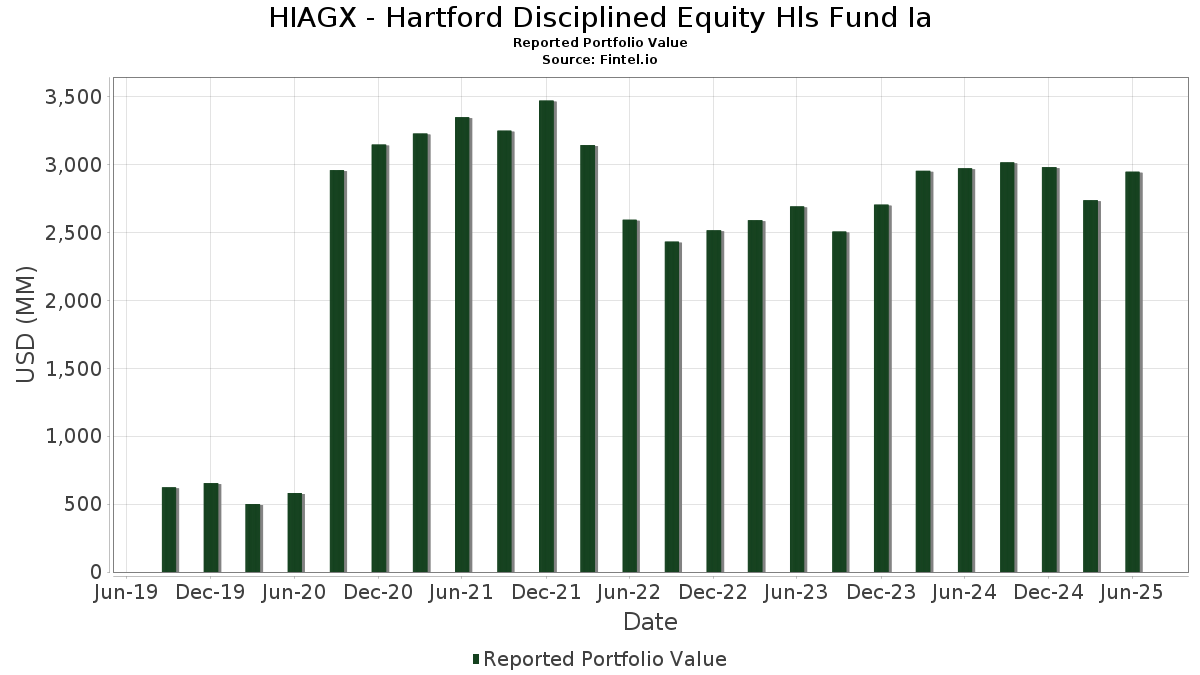
| Porteføljeværdi | $ 2.946.565.418 |
| Nuværende stillinger | 69 |
Seneste beholdninger, ydeevne, AUM (fra 13F, 13D)
HIAGX - Hartford Disciplined Equity Hls Fund Ia har afsløret 69 samlede besiddelser i deres seneste SEC-arkivering. Den seneste porteføljeværdi er beregnet til at være $ 2.946.565.418 USD. Faktiske aktiver under forvaltning (AUM) er denne værdi plus kontanter (som ikke er oplyst). HIAGX - Hartford Disciplined Equity Hls Fund Ias største beholdninger er Microsoft Corporation (US:MSFT) , NVIDIA Corporation (US:NVDA) , Apple Inc. (US:AAPL) , Amazon.com, Inc. (US:AMZN) , and Alphabet Inc. (US:GOOGL) . HIAGX - Hartford Disciplined Equity Hls Fund Ias nye stillinger omfatter Philip Morris International Inc. (US:PM) , General Electric Company (US:GE) , Gilead Sciences, Inc. (US:GILD) , Trane Technologies plc (US:TT) , and Pool Corporation (US:POOL) .
Top øger dette kvartal
Vi bruger ændringen i porteføljeallokeringen, fordi dette er den mest meningsfulde metrik. Ændringer kan skyldes handler eller ændringer i aktiekurser.
| Sikkerhed | Aktier (MM) |
Værdi (MM$) |
Portefølje % | ΔPortefølje % |
|---|---|---|---|---|
| 1,39 | 219,49 | 7,4496 | 2,2431 | |
| 0,47 | 233,21 | 7,9153 | 1,7652 | |
| 0,21 | 39,04 | 1,3249 | 1,3249 | |
| 0,14 | 36,52 | 1,2395 | 1,2395 | |
| 0,37 | 103,28 | 3,5054 | 1,2159 | |
| 0,29 | 32,06 | 1,0880 | 1,0880 | |
| 0,13 | 92,79 | 3,1494 | 0,9636 | |
| 0,06 | 25,63 | 0,8700 | 0,8700 | |
| 0,08 | 23,82 | 0,8085 | 0,8085 | |
| 0,31 | 23,37 | 0,7933 | 0,7933 |
Top falder i dette kvartal
Vi bruger ændringen i porteføljeallokeringen, fordi dette er den mest meningsfulde metrik. Ændringer kan skyldes handler eller ændringer i aktiekurser.
| Sikkerhed | Aktier (MM) |
Værdi (MM$) |
Portefølje % | ΔPortefølje % |
|---|---|---|---|---|
| 0,94 | 192,41 | 6,5306 | -1,1201 | |
| 0,69 | 9,56 | 0,3246 | -0,7025 | |
| 0,24 | 38,04 | 1,2912 | -0,6634 | |
| 0,09 | 27,49 | 0,9329 | -0,4229 | |
| 0,26 | 23,40 | 0,7943 | -0,3492 | |
| 0,10 | 26,31 | 0,8930 | -0,2846 | |
| 0,39 | 42,14 | 1,4304 | -0,2775 | |
| 0,10 | 25,34 | 0,8599 | -0,2644 | |
| 0,07 | 28,95 | 0,9824 | -0,2485 | |
| 0,08 | 61,30 | 2,0806 | -0,2287 |
13F og Fondsarkivering
Denne formular blev indsendt den 2025-08-25 for rapporteringsperioden 2025-06-30. Klik på linkikonet for at se den fulde transaktionshistorik.
Opgrader for at låse op for premium-data og eksportere til Excel ![]() .
.
| Sikkerhed | Type | Gennemsnitlig aktiekurs | Aktier (MM) |
Δ Aktier (%) |
Δ Aktier (%) |
Værdi ($MM) |
Portefølje (%) |
ΔPortefølje (%) |
|
|---|---|---|---|---|---|---|---|---|---|
| MSFT / Microsoft Corporation | 0,47 | 3,92 | 233,21 | 37,70 | 7,9153 | 1,7652 | |||
| NVDA / NVIDIA Corporation | 1,39 | 5,01 | 219,49 | 53,08 | 7,4496 | 2,2431 | |||
| AAPL / Apple Inc. | 0,94 | -1,12 | 192,41 | -8,67 | 6,5306 | -1,1201 | |||
| AMZN / Amazon.com, Inc. | 0,68 | 4,04 | 149,80 | 19,97 | 5,0843 | 0,5500 | |||
| GOOGL / Alphabet Inc. | 0,70 | 1,95 | 123,09 | 16,18 | 4,1778 | 0,3306 | |||
| AVGO / Broadcom Inc. | 0,37 | -0,50 | 103,28 | 63,81 | 3,5054 | 1,2159 | |||
| META / Meta Platforms, Inc. | 0,13 | 20,38 | 92,79 | 54,16 | 3,1494 | 0,9636 | |||
| JPM / JPMorgan Chase & Co. | 0,26 | -4,06 | 74,54 | 13,39 | 2,5299 | 0,1428 | |||
| MA / Mastercard Incorporated | 0,13 | 0,00 | 73,52 | 2,52 | 2,4955 | -0,1088 | |||
| LLY / Eli Lilly and Company | 0,08 | 2,13 | 61,30 | -3,61 | 2,0806 | -0,2287 | |||
| NFLX / Netflix, Inc. | 0,04 | 0,00 | 56,20 | 43,60 | 1,9076 | 0,4864 | |||
| WMT / Walmart Inc. | 0,55 | 7,27 | 53,61 | 19,48 | 1,8194 | 0,1902 | |||
| WFC / Wells Fargo & Company | 0,60 | -0,65 | 47,88 | 10,88 | 1,6252 | 0,0571 | |||
| ABT / Abbott Laboratories | 0,34 | -7,16 | 45,94 | -4,81 | 1,5593 | -0,1933 | |||
| XOM / Exxon Mobil Corporation | 0,39 | -1,14 | 42,14 | -10,39 | 1,4304 | -0,2775 | |||
| RTX / RTX Corporation | 0,28 | -2,67 | 40,34 | 7,29 | 1,3690 | 0,0039 | |||
| BAC / Bank of America Corporation | 0,83 | -8,16 | 39,27 | 4,14 | 1,3329 | -0,0365 | |||
| PM / Philip Morris International Inc. | 0,21 | 39,04 | 1,3249 | 1,3249 | |||||
| BSX / Boston Scientific Corporation | 0,36 | -1,77 | 38,81 | 4,59 | 1,3173 | -0,0302 | |||
| PG / The Procter & Gamble Company | 0,24 | -24,40 | 38,04 | -29,32 | 1,2912 | -0,6634 | |||
| KLAC / KLA Corporation | 0,04 | -1,96 | 37,51 | 29,18 | 1,2731 | 0,2187 | |||
| GE / General Electric Company | 0,14 | 36,52 | 1,2395 | 1,2395 | |||||
| AXP / American Express Company | 0,11 | 2,97 | 35,89 | 22,09 | 1,2181 | 0,1506 | |||
| LIN / Linde plc | 0,08 | -0,93 | 35,25 | -0,17 | 1,1964 | -0,0858 | |||
| ATO / Atmos Energy Corporation | 0,22 | -1,92 | 33,83 | -2,22 | 1,1483 | -0,1081 | |||
| MAR / Marriott International, Inc. | 0,12 | 13,13 | 33,44 | 29,76 | 1,1351 | 0,1992 | |||
| PGR / The Progressive Corporation | 0,12 | -1,93 | 33,33 | -7,53 | 1,1312 | -0,1776 | |||
| TMUS / T-Mobile US, Inc. | 0,14 | 14,03 | 33,30 | 1,86 | 1,1301 | -0,0569 | |||
| ROP / Roper Technologies, Inc. | 0,06 | -2,21 | 32,51 | -5,98 | 1,1035 | -0,1523 | |||
| GILD / Gilead Sciences, Inc. | 0,29 | 32,06 | 1,0880 | 1,0880 | |||||
| NDAQ / Nasdaq, Inc. | 0,36 | 7,88 | 31,93 | 27,17 | 1,0837 | 0,1719 | |||
| VRTX / Vertex Pharmaceuticals Incorporated | 0,07 | 3,61 | 31,72 | -4,86 | 1,0767 | -0,1341 | |||
| IR / Ingersoll Rand Inc. | 0,38 | 23,88 | 31,68 | 28,76 | 1,0752 | 0,1818 | |||
| WELL / Welltower Inc. | 0,21 | -6,84 | 31,64 | -6,52 | 1,0739 | -0,1552 | |||
| PH / Parker-Hannifin Corporation | 0,04 | 20,00 | 31,07 | 37,88 | 1,0546 | 0,2363 | |||
| WEC / WEC Energy Group, Inc. | 0,29 | -1,89 | 30,51 | -6,19 | 1,0355 | -0,1455 | |||
| AZO / AutoZone, Inc. | 0,01 | -1,56 | 30,06 | -4,15 | 1,0202 | -0,1186 | |||
| SHW / The Sherwin-Williams Company | 0,09 | 16,32 | 29,60 | 14,38 | 1,0048 | 0,0649 | |||
| AMT / American Tower Corporation | 0,13 | 3,51 | 29,54 | 5,14 | 1,0027 | -0,0176 | |||
| MSI / Motorola Solutions, Inc. | 0,07 | -11,09 | 28,95 | -14,61 | 0,9824 | -0,2485 | |||
| GEV / GE Vernova Inc. | 0,05 | -21,83 | 28,91 | 35,50 | 0,9813 | 0,2064 | |||
| COR / Cencora, Inc. | 0,09 | -31,73 | 27,49 | -26,38 | 0,9329 | -0,4229 | |||
| CRM / Salesforce, Inc. | 0,10 | -20,15 | 26,31 | -18,87 | 0,8930 | -0,2846 | |||
| TT / Trane Technologies plc | 0,06 | 25,63 | 0,8700 | 0,8700 | |||||
| AME / AMETEK, Inc. | 0,14 | -1,38 | 25,57 | 3,67 | 0,8678 | -0,0277 | |||
| RSG / Republic Services, Inc. | 0,10 | -19,65 | 25,34 | -18,17 | 0,8599 | -0,2644 | |||
| BJ / BJ's Wholesale Club Holdings, Inc. | 0,22 | 24,73 | 24,19 | 17,88 | 0,8211 | 0,0758 | |||
| CB / Chubb Limited | 0,08 | -1,95 | 23,84 | -5,94 | 0,8090 | -0,1111 | |||
| POOL / Pool Corporation | 0,08 | 23,82 | 0,8085 | 0,8085 | |||||
| MNST / Monster Beverage Corporation | 0,38 | 0,00 | 23,77 | 7,04 | 0,8067 | 0,0004 | |||
| TJX / The TJX Companies, Inc. | 0,19 | -1,78 | 23,51 | -0,42 | 0,7981 | -0,0594 | |||
| COP / ConocoPhillips | 0,26 | -13,03 | 23,40 | -25,68 | 0,7943 | -0,3492 | |||
| MKC / McCormick & Company, Incorporated | 0,31 | 23,37 | 0,7933 | 0,7933 | |||||
| EMR / Emerson Electric Co. | 0,17 | -2,34 | 23,06 | 18,76 | 0,7828 | 0,0776 | |||
| TXN / Texas Instruments Incorporated | 0,11 | -15,22 | 22,04 | -2,05 | 0,7481 | -0,0691 | |||
| RPM / RPM International Inc. | 0,18 | 23,44 | 20,21 | 17,21 | 0,6861 | 0,0598 | |||
| KKR / KKR & Co. Inc. | 0,15 | 19,51 | 0,6622 | 0,6622 | |||||
| ACGL / Arch Capital Group Ltd. | 0,17 | 0,00 | 15,76 | -5,33 | 0,5348 | -0,0696 | |||
| LEN / Lennar Corporation | 0,14 | 64,53 | 15,42 | 58,56 | 0,5233 | 0,1702 | |||
| BLDR / Builders FirstSource, Inc. | 0,13 | 20,41 | 15,26 | 12,46 | 0,5178 | 0,0252 | |||
| IRM / Iron Mountain Incorporated | 0,15 | 13,08 | 14,98 | 34,82 | 0,5084 | 0,1049 | |||
| WDAY / Workday, Inc. | 0,06 | -2,36 | 14,91 | 0,34 | 0,5059 | -0,0335 | |||
| TSLA / Tesla, Inc. | 0,05 | -29,42 | 14,80 | -13,48 | 0,5024 | -0,1189 | |||
| EXE / Expand Energy Corporation | 0,12 | -3,95 | 14,56 | 0,90 | 0,4942 | -0,0298 | |||
| PCG / PG&E Corporation | 0,69 | -58,33 | 9,56 | -66,19 | 0,3246 | -0,7025 | |||
| LUMERIS GROUP HOLDINGS CORP / EP (000000000) | 1,87 | 2,49 | 0,0845 | 0,0845 | |||||
| TORY BURCH PRIVATE PLACE / EC (000000000) | 0,04 | 2,10 | 0,0711 | 0,0711 | |||||
| LOOKOUT INC SER F CVT PFD PP / EP (000000000) | 0,29 | 1,60 | 0,0543 | 0,0543 | |||||
| FIXED INC CLEARING CORP.REPO / RA (000000000) | 0,09 | 0,0029 | 0,0029 |