Grundlæggende statistik
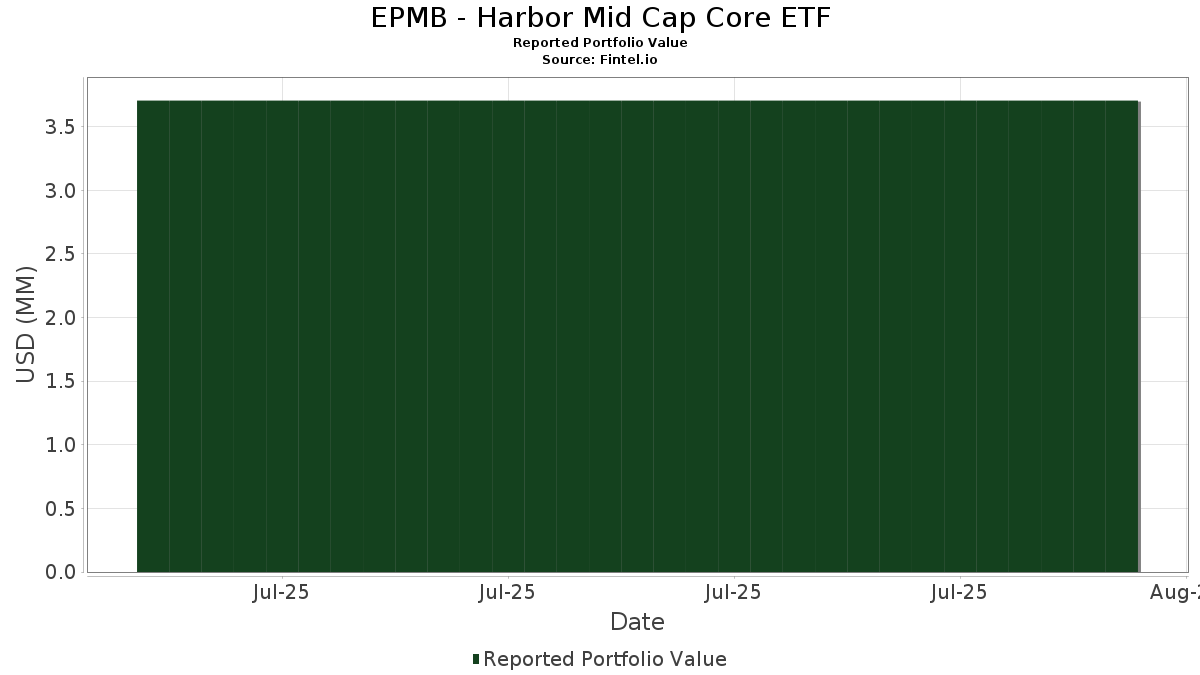
Porteføljeværdi $ 3.705.033
Nuværende stillinger 58
Seneste beholdninger, ydeevne, AUM (fra 13F, 13D)

EPMB - Harbor Mid Cap Core ETF har afsløret 58 samlede besiddelser i deres seneste SEC-arkivering. Den seneste porteføljeværdi er beregnet til at være $ 3.705.033 USD. Faktiske aktiver under forvaltning (AUM) er denne værdi plus kontanter (som ikke er oplyst). EPMB - Harbor Mid Cap Core ETFs største beholdninger er CBRE Group, Inc. (US:CBRE) , Synopsys, Inc. (US:SNPS) , Raymond James Financial, Inc. (US:RJF) , Intercontinental Exchange, Inc. (US:ICE) , and Woodward, Inc. (US:WWD) . EPMB - Harbor Mid Cap Core ETFs nye stillinger omfatter CBRE Group, Inc. (US:CBRE) , Synopsys, Inc. (US:SNPS) , Raymond James Financial, Inc. (US:RJF) , Intercontinental Exchange, Inc. (US:ICE) , and Woodward, Inc. (US:WWD) .

EPMB - Harbor Mid Cap Core ETF - Porteføljeværdi
Top øger dette kvartal

Vi bruger ændringen i porteføljeallokeringen, fordi dette er den mest meningsfulde metrik. Ændringer kan skyldes handler eller ændringer i aktiekurser.

Sikkerhed Aktier
(MM)
Værdi
(MM$)
Portefølje % ΔPortefølje %
0,00 0,12 3,2789 3,2789
0,00 0,11 2,9080 2,9080
0,00 0,11 2,7779 2,7779
0,00 0,10 2,7308 2,7308
0,00 0,10 2,7062 2,7062
0,00 0,10 2,5712 2,5712
0,00 0,10 2,5132 2,5132
0,00 0,09 2,3532 2,3532
0,00 0,09 2,2774 2,2774
0,00 0,08 2,2391 2,2391
Top falder i dette kvartal

Vi bruger ændringen i porteføljeallokeringen, fordi dette er den mest meningsfulde metrik. Ændringer kan skyldes handler eller ændringer i aktiekurser.

Sikkerhed Aktier
(MM)
Værdi
(MM$)
Portefølje % ΔPortefølje %
13F og Fondsarkivering

Denne formular blev indsendt den 2025-09-26 for rapporteringsperioden 2025-07-31. Klik på linkikonet for at se den fulde transaktionshistorik.

Opgrader for at låse op for premium-data og eksportere til Excel .

2022-07-28: Vigtig note - Vi har ændret behandlingen af kolonnen Δ Portefølje % i denne tabel. Tidligere rapporterede vi det som den procentvise ændring i porteføljeallokeringen. Vi rapporterer det nu som den rå ændring i porteføljeallokeringen (stadig rapporteret som en procent). I formeltermer rapporterede vi det tidligere som 100 * (aktuel allokering - forudgående tildeling) / forudgående tildeling. Vi indberetter det nu som (nuværende tildeling - forudgående tildeling).
Sikkerhed Type Gennemsnitlig aktiekurs Aktier
(MM)
Δ Aktier
(%)
Δ Aktier
(%)
Værdi
($MM)
Portefølje
(%)
ΔPortefølje
(%)
CBRE / CBRE Group, Inc. 0,00 0,12 3,2789 3,2789
SNPS / Synopsys, Inc. 0,00 0,11 2,9080 2,9080
RJF / Raymond James Financial, Inc. 0,00 0,11 2,7779 2,7779
ICE / Intercontinental Exchange, Inc. 0,00 0,10 2,7308 2,7308
WWD / Woodward, Inc. 0,00 0,10 2,7062 2,7062
SF / Stifel Financial Corp. 0,00 0,10 2,5712 2,5712
RSG / Republic Services, Inc. 0,00 0,10 2,5132 2,5132
AL / Air Lease Corporation 0,00 0,09 2,3532 2,3532
MAS / Masco Corporation 0,00 0,09 2,2774 2,2774
RGA / Reinsurance Group of America, Incorporated 0,00 0,08 2,2391 2,2391
IQV / IQVIA Holdings Inc. 0,00 0,08 2,2311 2,2311
ULTA / Ulta Beauty, Inc. 0,00 0,08 2,1876 2,1876
DHI / D.R. Horton, Inc. 0,00 0,08 2,0840 2,0840
QGEN / Qiagen N.V. 0,00 0,08 2,0685 2,0685
DRI / Darden Restaurants, Inc. 0,00 0,08 2,0484 2,0484
ENTG / Entegris, Inc. 0,00 0,08 1,9996 1,9996
KEYS / Keysight Technologies, Inc. 0,00 0,08 1,9979 1,9979
SMG / The Scotts Miracle-Gro Company 0,00 0,07 1,9557 1,9557
WEC / WEC Energy Group, Inc. 0,00 0,07 1,9138 1,9138
DOV / Dover Corporation 0,00 0,07 1,9068 1,9068
CMI / Cummins Inc. 0,00 0,07 1,9010 1,9010
SNA / Snap-on Incorporated 0,00 0,07 1,8982 1,8982
HXL / Hexcel Corporation 0,00 0,07 1,8367 1,8367
HLI / Houlihan Lokey, Inc. 0,00 0,07 1,8310 1,8310
BR / Broadridge Financial Solutions, Inc. 0,00 0,07 1,8284 1,8284
RRJ / RenaissanceRe Holdings Ltd. 0,00 0,07 1,8006 1,8006
LH / Labcorp Holdings Inc. 0,00 0,07 1,7772 1,7772
COR / Cencora, Inc. 0,00 0,07 1,7435 1,7435
WTFC / Wintrust Financial Corporation 0,00 0,07 1,7254 1,7254
CSX / CSX Corporation 0,00 0,06 1,6803 1,6803
EWBC / East West Bancorp, Inc. 0,00 0,06 1,6107 1,6107
SWKS / Skyworks Solutions, Inc. 0,00 0,06 1,5696 1,5696
ROST / Ross Stores, Inc. 0,00 0,06 1,5634 1,5634
GD / General Dynamics Corporation 0,00 0,06 1,5538 1,5538
GATX / GATX Corporation 0,00 0,06 1,5227 1,5227
ARW / Arrow Electronics, Inc. 0,00 0,06 1,4782 1,4782
A / Agilent Technologies, Inc. 0,00 0,05 1,4418 1,4418
BXP / Boston Properties, Inc. 0,00 0,05 1,4380 1,4380
CTRA / Coterra Energy Inc. 0,00 0,05 1,4369 1,4369
PGR / The Progressive Corporation 0,00 0,05 1,3985 1,3985
AKAM / Akamai Technologies, Inc. 0,00 0,05 1,3952 1,3952
PKG / Packaging Corporation of America 0,00 0,05 1,3597 1,3597
SYY / Sysco Corporation 0,00 0,05 1,3525 1,3525
TJX / The TJX Companies, Inc. 0,00 0,05 1,3109 1,3109
SBAC / SBA Communications Corporation 0,00 0,05 1,2865 1,2865
S94 / Sensata Technologies Holding plc 0,00 0,05 1,2270 1,2270
GPN / Global Payments Inc. 0,00 0,04 1,1517 1,1517
COLD / Americold Realty Trust, Inc. 0,00 0,04 1,1314 1,1314
EMN / Eastman Chemical Company 0,00 0,04 1,0728 1,0728
BIO / Bio-Rad Laboratories, Inc. 0,00 0,04 1,0724 1,0724
AMAT / Applied Materials, Inc. 0,00 0,04 1,0309 1,0309
SEE / Sealed Air Corporation 0,00 0,03 0,8595 0,8595
ALB / Albemarle Corporation 0,00 0,03 0,8270 0,8270
SLB / Schlumberger Limited 0,00 0,03 0,7883 0,7883
CNC / Centene Corporation 0,00 0,03 0,6933 0,6933
MUR / Murphy Oil Corporation 0,00 0,02 0,5223 0,5223
XRAY / DENTSPLY SIRONA Inc. 0,00 0,02 0,4678 0,4678
HP / Helmerich & Payne, Inc. 0,00 0,02 0,4161 0,4161