Grundlæggende statistik
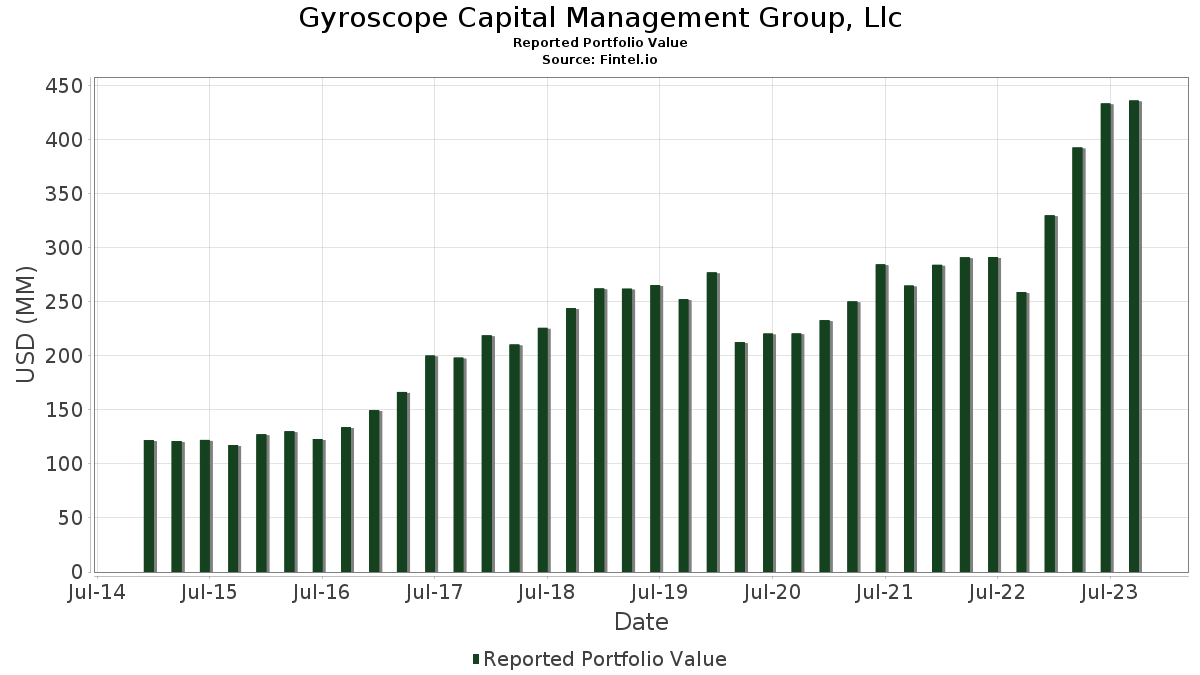
| Porteføljeværdi | $ 435.949.777 |
| Nuværende stillinger | 218 |
Seneste beholdninger, ydeevne, AUM (fra 13F, 13D)
Gyroscope Capital Management Group, Llc har afsløret 218 samlede besiddelser i deres seneste SEC-arkivering. Den seneste porteføljeværdi er beregnet til at være $ 435.949.777 USD. Faktiske aktiver under forvaltning (AUM) er denne værdi plus kontanter (som ikke er oplyst). Gyroscope Capital Management Group, Llcs største beholdninger er Berkshire Hathaway Inc. (US:BRK.B) , Apple Inc. (US:AAPL) , Cisco Systems, Inc. (US:CSCO) , Comcast Corporation (US:CMCSA) , and CVS Health Corporation (US:CVS) . Gyroscope Capital Management Group, Llcs nye stillinger omfatter Halliburton Company (US:HAL) , NXP Semiconductors N.V. (US:NXPI) , Dover Corporation (US:DOV) , First Solar, Inc. (US:FSLR) , and AppLovin Corporation (US:APP) .
Top øger dette kvartal
Vi bruger ændringen i porteføljeallokeringen, fordi dette er den mest meningsfulde metrik. Ændringer kan skyldes handler eller ændringer i aktiekurser.
| Sikkerhed | Aktier (MM) |
Værdi (MM$) |
Portefølje % | ΔPortefølje % |
|---|---|---|---|---|
| 0,23 | 9,15 | 2,0986 | 2,0986 | |
| 0,11 | 8,31 | 1,9064 | 1,9064 | |
| 0,08 | 7,82 | 1,7942 | 1,7942 | |
| 0,05 | 5,70 | 1,3080 | 1,3080 | |
| 0,05 | 9,01 | 2,0672 | 0,4808 | |
| 0,02 | 2,00 | 0,4590 | 0,4590 | |
| 0,01 | 2,20 | 0,5055 | 0,4275 | |
| 0,01 | 1,83 | 0,4200 | 0,4200 | |
| 0,01 | 2,06 | 0,4719 | 0,4173 | |
| 0,01 | 1,61 | 0,3704 | 0,3704 |
Top falder i dette kvartal
Vi bruger ændringen i porteføljeallokeringen, fordi dette er den mest meningsfulde metrik. Ændringer kan skyldes handler eller ændringer i aktiekurser.
| Sikkerhed | Aktier (MM) |
Værdi (MM$) |
Portefølje % | ΔPortefølje % |
|---|---|---|---|---|
| 0,00 | 0,29 | 0,0669 | -2,7759 | |
| 0,00 | 0,00 | -2,2066 | ||
| 0,00 | 0,00 | -2,1831 | ||
| 0,00 | 0,00 | -2,1221 | ||
| 0,08 | 14,02 | 3,2159 | -0,5457 | |
| 0,00 | 0,00 | -0,5131 | ||
| 0,12 | 8,31 | 1,9059 | -0,4022 | |
| 0,00 | 0,00 | -0,3956 | ||
| 0,10 | 8,51 | 1,9528 | -0,3447 | |
| 0,00 | 0,00 | -0,3406 |
13F og Fondsarkivering
Denne formular blev indsendt den 2023-11-13 for rapporteringsperioden 2023-09-30. Klik på linkikonet for at se den fulde transaktionshistorik.
Opgrader for at låse op for premium-data og eksportere til Excel ![]() .
.
| Sikkerhed | Type | Gennemsnitlig aktiekurs | Aktier (MM) |
Δ Aktier (%) |
Δ Aktier (%) |
Værdi ($MM) |
Portefølje (%) |
ΔPortefølje (%) |
|
|---|---|---|---|---|---|---|---|---|---|
| BRK.B / Berkshire Hathaway Inc. | 0,05 | -4,81 | 17,16 | -2,22 | 3,9361 | -0,1145 | |||
| AAPL / Apple Inc. | 0,08 | -2,53 | 14,02 | -13,97 | 3,2159 | -0,5457 | |||
| CSCO / Cisco Systems, Inc. | 0,22 | 1,13 | 11,95 | 5,08 | 2,7402 | 0,1160 | |||
| CMCSA / Comcast Corporation | 0,25 | -6,31 | 11,27 | -0,03 | 2,5851 | -0,0168 | |||
| CVS / CVS Health Corporation | 0,15 | 6,64 | 10,54 | 7,70 | 2,4177 | 0,1588 | |||
| JPM / JPMorgan Chase & Co. | 0,07 | -2,32 | 10,40 | -2,60 | 2,3856 | -0,0791 | |||
| SHW / The Sherwin-Williams Company | 0,04 | -0,65 | 10,22 | -4,57 | 2,3447 | -0,1276 | |||
| TSN / Tyson Foods, Inc. | 0,19 | 0,85 | 9,81 | -0,23 | 2,2513 | -0,0195 | |||
| CTSH / Cognizant Technology Solutions Corporation | 0,14 | -1,08 | 9,29 | 2,65 | 2,1312 | 0,0420 | |||
| HAL / Halliburton Company | 0,23 | 9,15 | 2,0986 | 2,0986 | |||||
| XLK / The Select Sector SPDR Trust - The Technology Select Sector SPDR Fund | 0,05 | 39,06 | 9,01 | 31,12 | 2,0672 | 0,4808 | |||
| FOXA / Fox Corporation | 0,28 | -1,46 | 8,83 | -9,58 | 2,0250 | -0,2285 | |||
| PFE / Pfizer Inc. | 0,26 | 8,82 | 8,75 | -1,60 | 2,0077 | -0,0453 | |||
| SWK / Stanley Black & Decker, Inc. | 0,10 | -4,10 | 8,51 | -14,47 | 1,9528 | -0,3447 | |||
| SPG / Simon Property Group, Inc. | 0,08 | -5,06 | 8,48 | -11,19 | 1,9460 | -0,2589 | |||
| C / Citigroup Inc. | 0,21 | 10,66 | 8,47 | -1,14 | 1,9425 | -0,0348 | |||
| EMN / Eastman Chemical Company | 0,11 | 8,31 | 1,9064 | 1,9064 | |||||
| BBY / Best Buy Co., Inc. | 0,12 | -1,98 | 8,31 | -16,91 | 1,9059 | -0,4022 | |||
| FIS / Fidelity National Information Services, Inc. | 0,15 | 1,44 | 8,27 | 2,49 | 1,8977 | 0,0346 | |||
| FE / FirstEnergy Corp. | 0,23 | 0,43 | 7,83 | -11,70 | 1,7966 | -0,2510 | |||
| SWKS / Skyworks Solutions, Inc. | 0,08 | 7,82 | 1,7942 | 1,7942 | |||||
| GLW / Corning Incorporated | 0,25 | 0,09 | 7,73 | -12,96 | 1,7738 | -0,2770 | |||
| MSFT / Microsoft Corporation | 0,02 | -0,34 | 6,05 | -7,59 | 1,3872 | -0,1234 | |||
| XOM / Exxon Mobil Corporation | 0,05 | 2,47 | 5,99 | 12,34 | 1,3743 | 0,1433 | |||
| PG / The Procter & Gamble Company | 0,04 | 13,54 | 5,82 | 9,14 | 1,3348 | 0,1040 | |||
| DG / Dollar General Corporation | 0,05 | 5,70 | 1,3080 | 1,3080 | |||||
| AAP / Advance Auto Parts, Inc. | 0,10 | 9,25 | 5,67 | -13,08 | 1,2998 | -0,2050 | |||
| ABBV / AbbVie Inc. | 0,03 | 8,78 | 5,22 | 20,36 | 1,1963 | 0,1961 | |||
| BMY / Bristol-Myers Squibb Company | 0,08 | 12,71 | 4,65 | 2,29 | 1,0656 | 0,0173 | |||
| PGR / The Progressive Corporation | 0,03 | -4,34 | 4,28 | 0,66 | 0,9808 | 0,0004 | |||
| XLV / The Select Sector SPDR Trust - The Health Care Select Sector SPDR Fund | 0,03 | -8,97 | 4,25 | -11,70 | 0,9744 | -0,1361 | |||
| MKC / McCormick & Company, Incorporated | 0,06 | 5,53 | 4,18 | -8,49 | 0,9596 | -0,0956 | |||
| XLF / The Select Sector SPDR Trust - The Financial Select Sector SPDR Fund | 0,13 | -19,89 | 4,16 | -21,17 | 0,9533 | -0,2636 | |||
| HVT / Haverty Furniture Companies, Inc. | 0,14 | 0,00 | 4,14 | -4,76 | 0,9506 | -0,0538 | |||
| NSC / Norfolk Southern Corporation | 0,02 | -0,50 | 3,95 | -13,59 | 0,9061 | -0,1490 | |||
| AMZN / Amazon.com, Inc. | 0,03 | 3,48 | 3,82 | 0,92 | 0,8765 | 0,0024 | |||
| XLY / The Select Sector SPDR Trust - The Consumer Discretionary Select Sector SPDR Fund | 0,02 | 14,80 | 3,74 | 8,84 | 0,8585 | 0,0647 | |||
| XLI / The Select Sector SPDR Trust - The Industrial Select Sector SPDR Fund | 0,03 | 1,08 | 3,23 | -4,52 | 0,7412 | -0,0399 | |||
| PLTR / Palantir Technologies Inc. | 0,20 | 0,00 | 3,20 | 4,37 | 0,7340 | 0,0263 | |||
| COIN / Coinbase Global, Inc. | 0,04 | 0,00 | 3,19 | 4,94 | 0,7308 | 0,0300 | |||
| UNH / UnitedHealth Group Incorporated | 0,01 | 38,24 | 2,97 | 45,07 | 0,6815 | 0,2086 | |||
| STGW / Stagwell Inc. | 0,57 | 0,00 | 2,67 | -34,95 | 0,6132 | -0,3354 | |||
| XLC / The Select Sector SPDR Trust - The Communication Services Select Sector SPDR Fund | 0,04 | 1,14 | 2,64 | 1,89 | 0,6058 | 0,0076 | |||
| NVDA / NVIDIA Corporation | 0,01 | 114,29 | 2,62 | 120,49 | 0,6000 | 0,3260 | |||
| XLE / The Select Sector SPDR Trust - The Energy Select Sector SPDR Fund | 0,03 | 4,34 | 2,30 | 16,19 | 0,5286 | 0,0708 | |||
| FFIV / F5, Inc. | 0,01 | 6,55 | 2,24 | 17,43 | 0,5147 | 0,0735 | |||
| CRM / Salesforce, Inc. | 0,01 | 579,19 | 2,20 | 551,78 | 0,5055 | 0,4275 | |||
| MOH / Molina Healthcare, Inc. | 0,01 | 5,59 | 2,16 | 14,94 | 0,4961 | 0,0617 | |||
| ABT / Abbott Laboratories | 0,02 | 32,47 | 2,16 | 17,71 | 0,4955 | 0,0718 | |||
| RCL / Royal Caribbean Cruises Ltd. | 0,02 | 3,18 | 2,14 | -8,35 | 0,4910 | -0,0481 | |||
| CBOE / Cboe Global Markets, Inc. | 0,01 | 0,00 | 2,13 | 13,17 | 0,4890 | 0,0543 | |||
| GD / General Dynamics Corporation | 0,01 | 746,36 | 2,06 | 771,61 | 0,4719 | 0,4173 | |||
| GOOGL / Alphabet Inc. | 0,02 | -30,34 | 2,04 | -23,85 | 0,4673 | -0,1502 | |||
| SBUX / Starbucks Corporation | 0,02 | 2,00 | 0,4590 | 0,4590 | |||||
| JNJ / Johnson & Johnson | 0,01 | 61,05 | 1,99 | 51,60 | 0,4563 | 0,1533 | |||
| CMI / Cummins Inc. | 0,01 | 8,35 | 1,97 | 0,97 | 0,4515 | 0,0016 | |||
| XLP / The Select Sector SPDR Trust - The Consumer Staples Select Sector SPDR Fund | 0,03 | -12,90 | 1,93 | -19,20 | 0,4424 | -0,1085 | |||
| GEN / Gen Digital Inc. | 0,11 | -18,89 | 1,93 | -22,72 | 0,4418 | -0,1332 | |||
| PYPL / PayPal Holdings, Inc. | 0,03 | 10,64 | 1,87 | -3,06 | 0,4290 | -0,0164 | |||
| NXPI / NXP Semiconductors N.V. | 0,01 | 1,83 | 0,4200 | 0,4200 | |||||
| PCOR / Procore Technologies, Inc. | 0,03 | 0,00 | 1,82 | 0,39 | 0,4186 | -0,0010 | |||
| MTCH / Match Group, Inc. | 0,05 | 5,14 | 1,82 | -1,62 | 0,4181 | -0,0094 | |||
| KR / The Kroger Co. | 0,04 | 10,64 | 1,78 | 5,32 | 0,4087 | 0,0183 | |||
| KMX / CarMax, Inc. | 0,03 | 4,91 | 1,78 | -11,33 | 0,4077 | -0,0551 | |||
| META / Meta Platforms, Inc. | 0,01 | 14,59 | 1,72 | 19,90 | 0,3953 | 0,0635 | |||
| RJF / Raymond James Financial, Inc. | 0,02 | 6,50 | 1,72 | 3,06 | 0,3937 | 0,0093 | |||
| RTX / RTX Corporation | 0,02 | 2,40 | 1,64 | -24,78 | 0,3753 | -0,1267 | |||
| GOOGL / Alphabet Inc. | 0,01 | -37,36 | 1,62 | -31,75 | 0,3715 | -0,1761 | |||
| CVX / Chevron Corporation | 0,01 | 1,61 | 0,3704 | 0,3704 | |||||
| NKE / NIKE, Inc. | 0,02 | 1,61 | 0,3692 | 0,3692 | |||||
| SEE / Sealed Air Corporation | 0,05 | 9,45 | 1,60 | -10,06 | 0,3671 | -0,0438 | |||
| DOV / Dover Corporation | 0,01 | 1,58 | 0,3616 | 0,3616 | |||||
| FSLR / First Solar, Inc. | 0,01 | 1,55 | 0,3551 | 0,3551 | |||||
| SYY / Sysco Corporation | 0,02 | 24,46 | 1,55 | 10,75 | 0,3546 | 0,0325 | |||
| ORCL / Oracle Corporation | 0,01 | 37,94 | 1,52 | 22,71 | 0,3496 | 0,0629 | |||
| MRK / Merck & Co., Inc. | 0,01 | 63,62 | 1,50 | 45,97 | 0,3446 | 0,1071 | |||
| AMGN / Amgen Inc. | 0,01 | 65,43 | 1,39 | 100,43 | 0,3183 | 0,1583 | |||
| IBM / International Business Machines Corporation | 0,01 | 24,17 | 1,36 | 30,23 | 0,3113 | 0,0707 | |||
| URI / United Rentals, Inc. | 0,00 | 0,00 | 1,33 | -0,22 | 0,3059 | -0,0025 | |||
| CME / CME Group Inc. | 0,01 | 58,30 | 1,29 | 71,14 | 0,2953 | 0,1216 | |||
| APP / AppLovin Corporation | 0,03 | 1,28 | 0,2947 | 0,2947 | |||||
| V / Visa Inc. | 0,01 | -24,14 | 1,28 | -26,50 | 0,2946 | -0,1089 | |||
| ESNT / Essent Group Ltd. | 0,03 | 0,00 | 1,26 | 1,04 | 0,2901 | 0,0012 | |||
| AON / Aon plc | 0,00 | -20,71 | 1,24 | -25,59 | 0,2844 | -0,0999 | |||
| TRV / The Travelers Companies, Inc. | 0,01 | 122,88 | 1,16 | 109,58 | 0,2660 | 0,1383 | |||
| MCD / McDonald's Corporation | 0,00 | 14,17 | 1,15 | 0,79 | 0,2638 | 0,0004 | |||
| DIS / The Walt Disney Company | 0,01 | 143,35 | 1,12 | 121,23 | 0,2558 | 0,1393 | |||
| GILD / Gilead Sciences, Inc. | 0,01 | 1,10 | 0,2525 | 0,2525 | |||||
| TSLA / Tesla, Inc. | 0,00 | 40,52 | 1,09 | 34,28 | 0,2500 | 0,0627 | |||
| F / Ford Motor Company | 0,09 | 0,15 | 1,09 | -17,75 | 0,2499 | -0,0560 | |||
| VZ / Verizon Communications Inc. | 0,03 | 22,42 | 1,08 | 6,63 | 0,2472 | 0,0140 | |||
| UBER / Uber Technologies, Inc. | 0,02 | 1,07 | 0,2444 | 0,2444 | |||||
| AKAM / Akamai Technologies, Inc. | 0,01 | 3,69 | 1,06 | 22,93 | 0,2425 | 0,0440 | |||
| T / AT&T Inc. | 0,07 | 253,31 | 0,98 | 233,56 | 0,2258 | 0,1575 | |||
| AMAT / Applied Materials, Inc. | 0,01 | -54,96 | 0,96 | -56,86 | 0,2194 | -0,2923 | |||
| XLB / The Select Sector SPDR Trust - The Materials Select Sector SPDR Fund | 0,01 | 4,92 | 0,94 | -0,53 | 0,2164 | -0,0026 | |||
| ETN / Eaton Corporation plc | 0,00 | -28,33 | 0,91 | -23,99 | 0,2079 | -0,0673 | |||
| VV / Vanguard Index Funds - Vanguard Large-Cap ETF | 0,00 | 0,00 | 0,90 | -3,44 | 0,2064 | -0,0088 | |||
| KO / The Coca-Cola Company | 0,02 | 121,93 | 0,88 | 106,35 | 0,2013 | 0,1031 | |||
| XLRE / The Select Sector SPDR Trust - The Real Estate Select Sector SPDR Fund | 0,03 | -5,36 | 0,87 | -14,41 | 0,2003 | -0,0353 | |||
| XLU / The Select Sector SPDR Trust - The Utilities Select Sector SPDR Fund | 0,01 | -15,08 | 0,84 | -23,52 | 0,1926 | -0,0608 | |||
| BDX / Becton, Dickinson and Company | 0,00 | -4,71 | 0,82 | -6,60 | 0,1884 | -0,0147 | |||
| WMB / The Williams Companies, Inc. | 0,02 | 27,23 | 0,79 | 31,40 | 0,1816 | 0,0425 | |||
| WM / Waste Management, Inc. | 0,01 | 3,70 | 0,79 | -8,83 | 0,1802 | -0,0187 | |||
| SHLS / Shoals Technologies Group, Inc. | 0,04 | 0,00 | 0,75 | -28,59 | 0,1715 | -0,0702 | |||
| PEP / PepsiCo, Inc. | 0,00 | 14,17 | 0,71 | 4,41 | 0,1632 | 0,0060 | |||
| PM / Philip Morris International Inc. | 0,01 | 0,71 | 0,1631 | 0,1631 | |||||
| AVGO / Broadcom Inc. | 0,00 | -26,64 | 0,67 | -29,77 | 0,1538 | -0,0665 | |||
| ROP / Roper Technologies, Inc. | 0,00 | 0,39 | 0,62 | 0,98 | 0,1422 | 0,0007 | |||
| GMED / Globus Medical, Inc. | 0,01 | 0,00 | 0,60 | -16,67 | 0,1367 | -0,0283 | |||
| YUM / Yum! Brands, Inc. | 0,00 | -33,66 | 0,59 | -40,20 | 0,1352 | -0,0922 | |||
| WDAY / Workday, Inc. | 0,00 | 0,00 | 0,58 | -4,76 | 0,1331 | -0,0077 | |||
| RSG / Republic Services, Inc. | 0,00 | -3,50 | 0,58 | -10,28 | 0,1323 | -0,0160 | |||
| TDY / Teledyne Technologies Incorporated | 0,00 | 0,57 | 0,1305 | 0,1305 | |||||
| LDOS / Leidos Holdings, Inc. | 0,01 | 3,56 | 0,57 | 7,82 | 0,1297 | 0,0087 | |||
| SM / SM Energy Company | 0,01 | 0,55 | 0,1264 | 0,1264 | |||||
| VIG / Vanguard Specialized Funds - Vanguard Dividend Appreciation ETF | 0,00 | 0,00 | 0,54 | -4,40 | 0,1247 | -0,0065 | |||
| EA / Electronic Arts Inc. | 0,00 | 1,77 | 0,54 | -5,43 | 0,1239 | -0,0081 | |||
| MSI / Motorola Solutions, Inc. | 0,00 | 2,39 | 0,54 | -4,96 | 0,1233 | -0,0072 | |||
| MAS / Masco Corporation | 0,01 | 0,53 | 0,1226 | 0,1226 | |||||
| ED / Consolidated Edison, Inc. | 0,01 | -32,56 | 0,53 | -36,23 | 0,1213 | -0,0700 | |||
| DUK / Duke Energy Corporation | 0,01 | 1,53 | 0,53 | -0,19 | 0,1210 | -0,0009 | |||
| COST / Costco Wholesale Corporation | 0,00 | 50,25 | 0,52 | 57,80 | 0,1186 | 0,0429 | |||
| ADBE / Adobe Inc. | 0,00 | 44,14 | 0,51 | 50,29 | 0,1180 | 0,0390 | |||
| PSA / Public Storage | 0,00 | 4,31 | 0,51 | -5,90 | 0,1171 | -0,0080 | |||
| ITW / Illinois Tool Works Inc. | 0,00 | 29,41 | 0,51 | 19,06 | 0,1162 | 0,0181 | |||
| ACN / Accenture plc | 0,00 | 23,94 | 0,50 | 23,34 | 0,1152 | 0,0212 | |||
| PPG / PPG Industries, Inc. | 0,00 | 0,52 | 0,50 | -11,95 | 0,1149 | -0,0165 | |||
| K / Kellanova | 0,01 | 3,99 | 0,50 | -8,27 | 0,1147 | -0,0110 | |||
| CTVA / Corteva, Inc. | 0,01 | 4,09 | 0,50 | -7,09 | 0,1143 | -0,0095 | |||
| BA / The Boeing Company | 0,00 | 0,50 | 0,1137 | 0,1137 | |||||
| MMM / 3M Company | 0,01 | 0,48 | 0,1112 | 0,1112 | |||||
| DOW / Dow Inc. | 0,01 | 0,48 | 0,1102 | 0,1102 | |||||
| QCOM / QUALCOMM Incorporated | 0,00 | 0,47 | 0,1073 | 0,1073 | |||||
| MO / Altria Group, Inc. | 0,01 | 0,47 | 0,1072 | 0,1072 | |||||
| WMT / Walmart Inc. | 0,00 | 62,00 | 0,47 | 65,25 | 0,1070 | 0,0417 | |||
| L / Loews Corporation | 0,01 | 0,46 | 0,1055 | 0,1055 | |||||
| WFC / Wells Fargo & Company | 0,01 | 32,86 | 0,46 | 27,09 | 0,1046 | 0,0218 | |||
| HSY / The Hershey Company | 0,00 | 4,79 | 0,46 | -16,05 | 0,1045 | -0,0207 | |||
| O / Realty Income Corporation | 0,01 | 3,74 | 0,45 | -13,38 | 0,1041 | -0,0168 | |||
| HON / Honeywell International Inc. | 0,00 | 33,89 | 0,45 | 19,47 | 0,1028 | 0,0160 | |||
| SHEL / Shell plc - Depositary Receipt (Common Stock) | 0,01 | 0,81 | 0,44 | 7,52 | 0,1016 | 0,0065 | |||
| SPGI / S&P Global Inc. | 0,00 | 51,38 | 0,44 | 38,13 | 0,1015 | 0,0275 | |||
| ZTS / Zoetis Inc. | 0,00 | 0,44 | 0,1002 | 0,1002 | |||||
| NOC / Northrop Grumman Corporation | 0,00 | 0,41 | 0,0940 | 0,0940 | |||||
| TFC / Truist Financial Corporation | 0,01 | 24,48 | 0,41 | 17,29 | 0,0934 | 0,0133 | |||
| GS / The Goldman Sachs Group, Inc. | 0,00 | 9,81 | 0,39 | 10,14 | 0,0897 | 0,0078 | |||
| AMD / Advanced Micro Devices, Inc. | 0,00 | 37,26 | 0,38 | 24,10 | 0,0874 | 0,0164 | |||
| ADSK / Autodesk, Inc. | 0,00 | 0,37 | 0,0854 | 0,0854 | |||||
| USB / U.S. Bancorp | 0,01 | 0,36 | 0,0815 | 0,0815 | |||||
| PAYX / Paychex, Inc. | 0,00 | 0,35 | 0,0808 | 0,0808 | |||||
| LMT / Lockheed Martin Corporation | 0,00 | 89,62 | 0,35 | 68,75 | 0,0806 | 0,0324 | |||
| MCO / Moody's Corporation | 0,00 | 38,75 | 0,35 | 25,90 | 0,0805 | 0,0163 | |||
| DHR / Danaher Corporation | 0,00 | 28,27 | 0,35 | 32,58 | 0,0803 | 0,0194 | |||
| SJM / The J. M. Smucker Company | 0,00 | 76,38 | 0,35 | 46,61 | 0,0796 | 0,0250 | |||
| NFLX / Netflix, Inc. | 0,00 | 51,50 | 0,34 | 29,92 | 0,0787 | 0,0177 | |||
| INTU / Intuit Inc. | 0,00 | 20,96 | 0,31 | 34,93 | 0,0710 | 0,0180 | |||
| MRO / Marathon Oil Corporation | 0,01 | -29,44 | 0,31 | -18,09 | 0,0708 | -0,0161 | |||
| GE / General Electric Company | 0,00 | 8,76 | 0,30 | 9,49 | 0,0690 | 0,0056 | |||
| MDLZ / Mondelez International, Inc. | 0,00 | 16,08 | 0,30 | 10,29 | 0,0689 | 0,0061 | |||
| BSX / Boston Scientific Corporation | 0,01 | 12,96 | 0,30 | 10,37 | 0,0684 | 0,0060 | |||
| MCHP / Microchip Technology Incorporated | 0,00 | -97,28 | 0,29 | -97,64 | 0,0669 | -2,7759 | |||
| CSL / Carlisle Companies Incorporated | 0,00 | 22,22 | 0,29 | 23,91 | 0,0654 | 0,0121 | |||
| BK / The Bank of New York Mellon Corporation | 0,01 | 0,28 | 0,0646 | 0,0646 | |||||
| CDNS / Cadence Design Systems, Inc. | 0,00 | 0,28 | 0,0645 | 0,0645 | |||||
| FTXP / Foothills Exploration, Inc. | 0,00 | 0,28 | 0,0638 | 0,0638 | |||||
| SNPS / Synopsys, Inc. | 0,00 | 0,28 | 0,0637 | 0,0637 | |||||
| AMT / American Tower Corporation | 0,00 | 0,28 | 0,0637 | 0,0637 | |||||
| PNC / The PNC Financial Services Group, Inc. | 0,00 | 0,27 | 0,0625 | 0,0625 | |||||
| LOW / Lowe's Companies, Inc. | 0,00 | 31,00 | 0,27 | 20,89 | 0,0625 | 0,0104 | |||
| NIO / NIO Inc. - Depositary Receipt (Common Stock) | 0,03 | 0,00 | 0,27 | -6,55 | 0,0622 | -0,0049 | |||
| JNPR / Juniper Networks, Inc. | 0,01 | 25,97 | 0,27 | 11,62 | 0,0618 | 0,0061 | |||
| WRB / W. R. Berkley Corporation | 0,00 | 16,67 | 0,27 | 24,30 | 0,0612 | 0,0117 | |||
| AEE / Ameren Corporation | 0,00 | 12,90 | 0,26 | 3,16 | 0,0601 | 0,0016 | |||
| C.WSA / Citigroup, Inc. | 0,00 | 34,33 | 0,26 | 25,60 | 0,0598 | 0,0119 | |||
| TXN / Texas Instruments Incorporated | 0,00 | 15,38 | 0,26 | 1,98 | 0,0591 | 0,0007 | |||
| MOS / The Mosaic Company | 0,01 | 20,00 | 0,26 | 21,90 | 0,0588 | 0,0103 | |||
| AFL / Aflac Incorporated | 0,00 | 0,26 | 0,0587 | 0,0587 | |||||
| FLT / Corpay, Inc. | 0,00 | 25,00 | 0,26 | 27,50 | 0,0586 | 0,0122 | |||
| AZO / AutoZone, Inc. | 0,00 | 0,25 | 0,0583 | 0,0583 | |||||
| LRCX / Lam Research Corporation | 0,00 | 0,25 | 0,0581 | 0,0581 | |||||
| PLD / Prologis, Inc. | 0,00 | -45,67 | 0,25 | -50,40 | 0,0575 | -0,0589 | |||
| TSCO / Tractor Supply Company | 0,00 | 20,00 | 0,24 | 9,95 | 0,0559 | 0,0049 | |||
| CPRT / Copart, Inc. | 0,01 | 0,24 | 0,0559 | 0,0559 | |||||
| AAPL / Apple Inc. | Call | 0,00 | 0,00 | 0,24 | -19,60 | 0,0556 | -0,0141 | ||
| KMI / Kinder Morgan, Inc. | 0,01 | -18,24 | 0,24 | -21,24 | 0,0554 | -0,0154 | |||
| UPS / United Parcel Service, Inc. | 0,00 | 26,58 | 0,24 | 10,23 | 0,0545 | 0,0047 | |||
| MS / Morgan Stanley | 0,00 | 7,41 | 0,24 | 2,61 | 0,0543 | 0,0011 | |||
| ISRG / Intuitive Surgical, Inc. | 0,00 | 34,50 | 0,24 | 14,63 | 0,0541 | 0,0067 | |||
| COR / Cencora, Inc. | 0,00 | 0,23 | 0,0537 | 0,0537 | |||||
| DE / Deere & Company | 0,00 | 0,23 | 0,0527 | 0,0527 | |||||
| CB / Chubb Limited | 0,00 | 0,23 | 0,0525 | 0,0525 | |||||
| ADI / Analog Devices, Inc. | 0,00 | 0,23 | 0,0522 | 0,0522 | |||||
| APD / Air Products and Chemicals, Inc. | 0,00 | 0,23 | 0,0520 | 0,0520 | |||||
| NOW / ServiceNow, Inc. | 0,00 | 0,23 | 0,0519 | 0,0519 | |||||
| NEE / NextEra Energy, Inc. | 0,00 | 27,03 | 0,23 | -2,17 | 0,0518 | -0,0013 | |||
| VBK / Vanguard Index Funds - Vanguard Small-Cap Growth ETF | 0,00 | 0,00 | 0,22 | -6,67 | 0,0514 | -0,0041 | |||
| ANET / Arista Networks Inc | 0,00 | 0,22 | 0,0506 | 0,0506 | |||||
| SYK / Stryker Corporation | 0,00 | 0,88 | 0,22 | -9,84 | 0,0506 | -0,0058 | |||
| ECL / Ecolab Inc. | 0,00 | 0,22 | 0,0505 | 0,0505 | |||||
| EQIX / Equinix, Inc. | 0,00 | 0,22 | 0,0505 | 0,0505 | |||||
| LBRDA / Liberty Broadband Corporation | 0,00 | 0,22 | 0,0504 | 0,0504 | |||||
| ANTX / AN2 Therapeutics, Inc. | 0,00 | 0,22 | 0,0499 | 0,0499 | |||||
| SHV / iShares Trust - iShares Short Treasury Bond ETF | 0,00 | 0,00 | 0,22 | 0,00 | 0,0497 | -0,0003 | |||
| CNC / Centene Corporation | 0,00 | 0,21 | 0,0490 | 0,0490 | |||||
| PANW / Palo Alto Networks, Inc. | 0,00 | 0,21 | 0,0489 | 0,0489 | |||||
| VO / Vanguard Index Funds - Vanguard Mid-Cap ETF | 0,00 | 0,00 | 0,21 | -5,36 | 0,0488 | -0,0031 | |||
| VRSK / Verisk Analytics, Inc. | 0,00 | 0,21 | 0,0488 | 0,0488 | |||||
| NDAQ / Nasdaq, Inc. | 0,00 | 0,21 | 0,0479 | 0,0479 | |||||
| AXP / American Express Company | 0,00 | 16,67 | 0,21 | -0,48 | 0,0479 | -0,0003 | |||
| VRTX / Vertex Pharmaceuticals Incorporated | 0,00 | 0,21 | 0,0479 | 0,0479 | |||||
| AJG / Arthur J. Gallagher & Co. | 0,00 | 0,21 | 0,0471 | 0,0471 | |||||
| CI / The Cigna Group | 0,00 | -11,62 | 0,20 | -9,82 | 0,0464 | -0,0054 | |||
| MET / MetLife, Inc. | 0,00 | 0,20 | 0,0462 | 0,0462 | |||||
| DXLG / Destination XL Group, Inc. | 0,04 | 0,00 | 0,19 | -8,29 | 0,0432 | -0,0043 | |||
| ONB / Old National Bancorp | 0,01 | 0,00 | 0,18 | 4,09 | 0,0410 | 0,0014 | |||
| GMED / Globus Medical, Inc. | Put | 0,01 | 0,01 | 0,0019 | 0,0019 | ||||
| ABBV / AbbVie Inc. | Put | 0,02 | 0,00 | 0,00 | -95,00 | 0,0004 | -0,0042 | ||
| GPN / Global Payments Inc. | 0,00 | -100,00 | 0,00 | -100,00 | -0,3406 | ||||
| PSX / Phillips 66 | 0,00 | -100,00 | 0,00 | -100,00 | -2,1221 | ||||
| INTC / Intel Corporation | 0,00 | -100,00 | 0,00 | -100,00 | -0,0942 | ||||
| CAT / Caterpillar Inc. | 0,00 | -100,00 | 0,00 | -100,00 | -0,0568 | ||||
| TMO / Thermo Fisher Scientific Inc. | 0,00 | -100,00 | 0,00 | -100,00 | -0,0723 | ||||
| MA / Mastercard Incorporated | 0,00 | -100,00 | 0,00 | -100,00 | -0,1089 | ||||
| LLY / Eli Lilly and Company | 0,00 | -100,00 | 0,00 | -100,00 | -0,2923 | ||||
| CE / Celanese Corporation | 0,00 | -100,00 | 0,00 | -100,00 | -2,1831 | ||||
| CCI / Crown Castle Inc. | 0,00 | -100,00 | 0,00 | -100,00 | -0,0500 | ||||
| DFS / Discover Financial Services | 0,00 | -100,00 | 0,00 | -100,00 | -2,2066 | ||||
| CSX / CSX Corporation | 0,00 | -100,00 | 0,00 | -100,00 | -0,0669 | ||||
| EOG / EOG Resources, Inc. | 0,00 | -100,00 | 0,00 | -100,00 | -0,0502 | ||||
| XPRO / Expro Group Holdings N.V. | 0,00 | -100,00 | 0,00 | -100,00 | -0,0495 | ||||
| COP / ConocoPhillips | 0,00 | -100,00 | 0,00 | -100,00 | -0,0717 | ||||
| UNP / Union Pacific Corporation | 0,00 | -100,00 | 0,00 | -100,00 | -0,0803 | ||||
| QQQ / Invesco QQQ Trust, Series 1 | 0,00 | -100,00 | 0,00 | -100,00 | -0,0682 | ||||
| ICE / Intercontinental Exchange, Inc. | 0,00 | -100,00 | 0,00 | -100,00 | -0,0657 | ||||
| TJX / The TJX Companies, Inc. | 0,00 | -100,00 | 0,00 | -100,00 | -0,0646 | ||||
| HUM / Humana Inc. | 0,00 | -100,00 | 0,00 | -100,00 | -0,0516 | ||||
| HES / Hess Corporation | 0,00 | -100,00 | 0,00 | -100,00 | -0,0502 | ||||
| DAL / Delta Air Lines, Inc. | 0,00 | -100,00 | 0,00 | -100,00 | -0,5131 | ||||
| PXD / Pioneer Natural Resources Company | 0,00 | -100,00 | 0,00 | -100,00 | -0,0717 | ||||
| MDT / Medtronic plc | 0,00 | -100,00 | 0,00 | -100,00 | -0,0630 | ||||
| CDW / CDW Corporation | 0,00 | -100,00 | 0,00 | -100,00 | -0,3956 | ||||
| HD / The Home Depot, Inc. | 0,00 | -100,00 | 0,00 | -100,00 | -0,1506 | ||||
| ORLY / O'Reilly Automotive, Inc. | 0,00 | -100,00 | 0,00 | -100,00 | -0,0662 |