Grundlæggende statistik
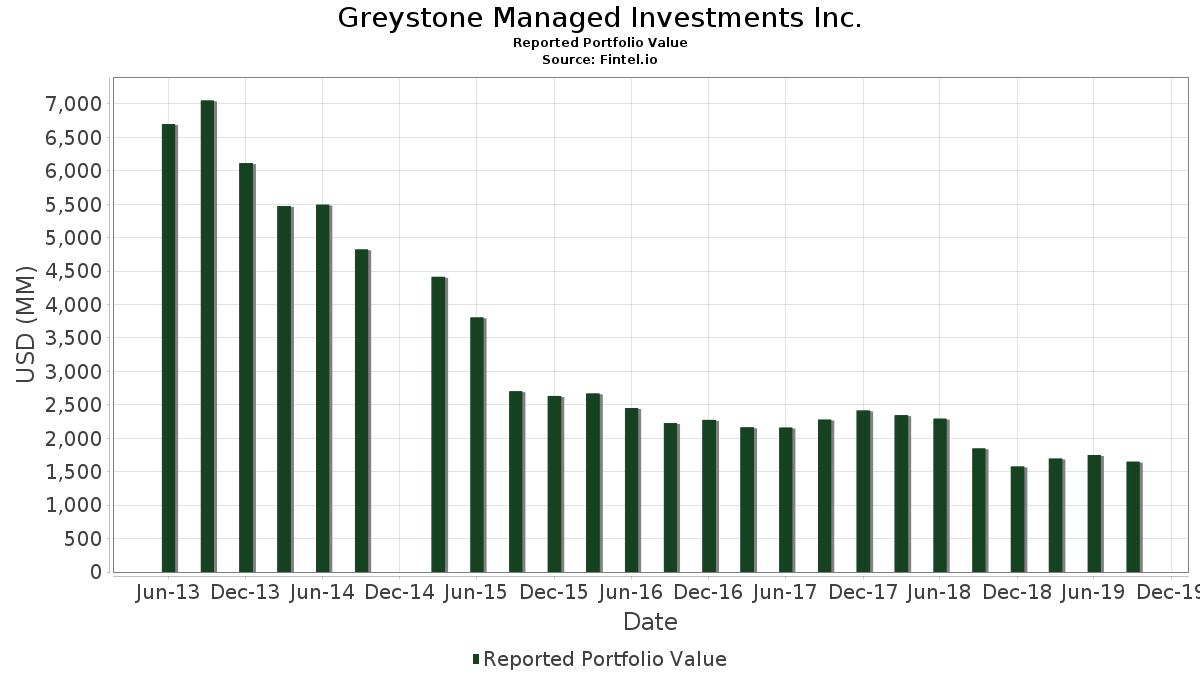
| Porteføljeværdi | $ 1.648.956.000 |
| Nuværende stillinger | 94 |
Seneste beholdninger, ydeevne, AUM (fra 13F, 13D)
Greystone Managed Investments Inc. har afsløret 94 samlede besiddelser i deres seneste SEC-arkivering. Den seneste porteføljeværdi er beregnet til at være $ 1.648.956.000 USD. Faktiske aktiver under forvaltning (AUM) er denne værdi plus kontanter (som ikke er oplyst). Greystone Managed Investments Inc.s største beholdninger er The Toronto-Dominion Bank (US:TD) , Royal Bank of Canada (US:RY) , Enbridge Inc. (US:ENB) , Canadian National Railway Company (US:CNI) , and Waste Connections, Inc. (US:WCN) . Greystone Managed Investments Inc.s nye stillinger omfatter Texas Instruments Incorporated (US:TXN) , North American Construction Group Ltd. (CA:NOA) , .
Top øger dette kvartal
Vi bruger ændringen i porteføljeallokeringen, fordi dette er den mest meningsfulde metrik. Ændringer kan skyldes handler eller ændringer i aktiekurser.
| Sikkerhed | Aktier (MM) |
Værdi (MM$) |
Portefølje % | ΔPortefølje % |
|---|---|---|---|---|
| 0,95 | 44,22 | 2,6814 | 0,5616 | |
| 0,05 | 6,37 | 0,3865 | 0,3865 | |
| 1,49 | 46,89 | 2,8439 | 0,3811 | |
| 0,09 | 9,69 | 0,5876 | 0,1747 | |
| 0,61 | 45,02 | 2,7304 | 0,1645 | |
| 0,08 | 17,59 | 1,0667 | 0,1557 | |
| 0,04 | 6,20 | 0,3757 | 0,1514 | |
| 0,07 | 16,33 | 0,9903 | 0,1422 | |
| 0,01 | 16,51 | 1,0010 | 0,1385 | |
| 2,19 | 30,05 | 1,8227 | 0,1328 |
Top falder i dette kvartal
Vi bruger ændringen i porteføljeallokeringen, fordi dette er den mest meningsfulde metrik. Ændringer kan skyldes handler eller ændringer i aktiekurser.
| Sikkerhed | Aktier (MM) |
Værdi (MM$) |
Portefølje % | ΔPortefølje % |
|---|---|---|---|---|
| 0,00 | 0,00 | -0,5816 | ||
| 0,00 | 0,00 | -0,3870 | ||
| 0,76 | 39,80 | 2,4135 | -0,2998 | |
| 0,52 | 47,44 | 2,8772 | -0,2636 | |
| 0,53 | 47,65 | 2,8898 | -0,2407 | |
| 1,77 | 103,53 | 6,2782 | -0,2281 | |
| 0,81 | 45,94 | 2,7857 | -0,2231 | |
| 1,50 | 52,54 | 3,1861 | -0,2143 | |
| 0,11 | 25,43 | 1,5425 | -0,2037 | |
| 0,39 | 19,01 | 1,1526 | -0,2010 |
13F og Fondsarkivering
Denne formular blev indsendt den 2019-11-05 for rapporteringsperioden 2019-09-30. Klik på linkikonet for at se den fulde transaktionshistorik.
Opgrader for at låse op for premium-data og eksportere til Excel ![]() .
.
| Sikkerhed | Type | Gennemsnitlig aktiekurs | Aktier (MM) |
Δ Aktier (%) |
Δ Aktier (%) |
Værdi ($MM) |
Portefølje (%) |
ΔPortefølje (%) |
|
|---|---|---|---|---|---|---|---|---|---|
| TD / The Toronto-Dominion Bank | 1,77 | -8,75 | 103,53 | -9,08 | 6,2782 | -0,2281 | |||
| RY / Royal Bank of Canada | 1,02 | -10,27 | 82,40 | -8,54 | 4,9969 | -0,1510 | |||
| ENB / Enbridge Inc. | 1,50 | -9,01 | 52,54 | -11,72 | 3,1861 | -0,2143 | |||
| CNI / Canadian National Railway Company | 0,53 | -10,22 | 47,65 | -13,02 | 2,8898 | -0,2407 | |||
| WCN / Waste Connections, Inc. | 0,52 | -10,11 | 47,44 | -13,69 | 2,8772 | -0,2636 | |||
| SU / Suncor Energy Inc. | 1,49 | 7,76 | 46,89 | 8,80 | 2,8439 | 0,3811 | |||
| GIB / CGI Inc. | 0,58 | -9,77 | 45,98 | -7,34 | 2,7886 | -0,0469 | |||
| BNS / The Bank of Nova Scotia | 0,81 | -17,38 | 45,94 | -12,77 | 2,7857 | -0,2231 | |||
| BMO / Bank of Montreal | 0,61 | 2,98 | 45,02 | 0,26 | 2,7304 | 0,1645 | |||
| TSM / Taiwan Semiconductor Manufacturing Company Limited - Depositary Receipt (Common Stock) | 0,95 | 0,44 | 44,22 | 19,18 | 2,6814 | 0,5616 | |||
| MFC / Manulife Financial Corporation | 2,32 | -9,95 | 42,51 | -9,26 | 2,5779 | -0,0989 | |||
| NICE / NICE Ltd. - Depositary Receipt (Common Stock) | 0,29 | -9,92 | 41,74 | -5,45 | 2,5316 | 0,0087 | |||
| RIO / Rio Tinto Group - Depositary Receipt (Common Stock) | 0,76 | 0,30 | 39,80 | -16,19 | 2,4135 | -0,2998 | |||
| BAMH / Brookfield Finance Inc - 4.625% NT REDEEM 16/10/2080 USD 25 | 0,75 | -12,44 | 39,62 | -2,96 | 2,4027 | 0,0698 | |||
| FTS / Fortis Inc. | 0,87 | -9,55 | 36,78 | -3,30 | 2,2308 | 0,0571 | |||
| PPL / Pembina Pipeline Corporation | 0,99 | -8,06 | 36,68 | -8,59 | 2,2247 | -0,0684 | |||
| FNV / Franco-Nevada Corporation | 0,35 | -10,38 | 31,57 | -3,93 | 1,9148 | 0,0368 | |||
| AQN / Algonquin Power & Utilities Corp. | 2,19 | -9,91 | 30,05 | 1,63 | 1,8227 | 0,1328 | |||
| CNQ / Canadian Natural Resources Limited | 1,11 | -3,57 | 29,43 | -4,98 | 1,7849 | 0,0149 | |||
| MSFT / Microsoft Corporation | 0,21 | -2,82 | 28,90 | 0,86 | 1,7527 | 0,1153 | |||
| SLFYF / Sun Life Financial, Inc. - 4.75% PRF PERPETUAL CAD 25 - Cls A Ser 1 | 0,62 | -9,09 | 27,76 | -1,99 | 1,6836 | 0,0651 | |||
| AEM / Agnico Eagle Mines Limited | 0,50 | -11,69 | 26,98 | -7,83 | 1,6361 | -0,0364 | |||
| CP / Canadian Pacific Kansas City Limited | 0,11 | -11,66 | 25,43 | -16,77 | 1,5425 | -0,2037 | |||
| NTES / NetEase, Inc. - Depositary Receipt (Common Stock) | 0,10 | -16,67 | 25,31 | -13,27 | 1,5351 | -0,1327 | |||
| OTEX / Open Text Corporation | 0,53 | -11,70 | 21,58 | -12,86 | 1,3089 | -0,1063 | |||
| RCI / Rogers Communications Inc. | 0,39 | -11,70 | 19,01 | -19,77 | 1,1526 | -0,2010 | |||
| AAPL / Apple Inc. | 0,08 | -2,50 | 17,59 | 10,33 | 1,0667 | 0,1557 | |||
| LMT / Lockheed Martin Corporation | 0,04 | -3,37 | 17,55 | 3,68 | 1,0641 | 0,0971 | |||
| JPM / JPMorgan Chase & Co. | 0,14 | -2,19 | 16,77 | 2,96 | 1,0168 | 0,0863 | |||
| GOOG / Alphabet Inc. | 0,01 | -3,03 | 16,51 | 9,35 | 1,0010 | 0,1385 | |||
| NEE / NextEra Energy, Inc. | 0,07 | -3,27 | 16,33 | 10,02 | 0,9903 | 0,1422 | |||
| CVX / Chevron Corporation | 0,13 | -2,53 | 14,89 | -7,11 | 0,9032 | -0,0129 | |||
| MRK / Merck & Co., Inc. | 0,17 | -14,74 | 14,18 | -14,41 | 0,8601 | -0,0867 | |||
| MA / Mastercard Incorporated | 0,05 | -1,79 | 14,16 | 0,83 | 0,8587 | 0,0562 | |||
| TJX / The TJX Companies, Inc. | 0,25 | -2,24 | 14,07 | 3,05 | 0,8533 | 0,0731 | |||
| HD / The Home Depot, Inc. | 0,06 | -2,29 | 14,02 | 9,01 | 0,8501 | 0,1153 | |||
| VZ / Verizon Communications Inc. | 0,23 | -3,04 | 13,96 | 2,44 | 0,8465 | 0,0679 | |||
| PFE / Pfizer Inc. | 0,35 | 16,60 | 12,53 | -3,30 | 0,7600 | 0,0195 | |||
| CMCSA / Comcast Corporation | 0,28 | -2,80 | 12,48 | 3,63 | 0,7566 | 0,0687 | |||
| HON / Honeywell International Inc. | 0,07 | -2,34 | 12,37 | -5,35 | 0,7499 | 0,0034 | |||
| WMT / Walmart Inc. | 0,10 | -1,33 | 12,23 | 5,99 | 0,7418 | 0,0823 | |||
| AMZN / Amazon.com, Inc. | 0,01 | -3,80 | 11,99 | -11,81 | 0,7272 | -0,0497 | |||
| AMT / American Tower Corporation | 0,05 | -4,98 | 11,78 | 2,77 | 0,7144 | 0,0595 | |||
| V / Visa Inc. | 0,07 | -2,63 | 11,58 | -3,50 | 0,7024 | 0,0166 | |||
| DSGX / The Descartes Systems Group Inc. | 0,26 | -11,67 | 10,56 | -3,77 | 0,6402 | 0,0134 | |||
| SHOP / Shopify Inc. | 0,03 | -11,72 | 10,49 | -8,72 | 0,6364 | -0,0205 | |||
| AVGO / Broadcom Inc. | 0,04 | -2,88 | 10,38 | -6,86 | 0,6296 | -0,0073 | |||
| C / Citigroup Inc. - Corporate Bond/Note | 0,15 | -2,91 | 10,31 | -4,23 | 0,6252 | 0,0101 | |||
| MGA / Magna International Inc. | 0,19 | -12,16 | 10,21 | -6,03 | 0,6190 | -0,0017 | |||
| UNH / UnitedHealth Group Incorporated | 0,05 | -2,87 | 10,08 | -13,50 | 0,6114 | -0,0546 | |||
| ERF / Enerplus Corporation | 1,33 | -11,72 | 9,94 | -12,70 | 0,6028 | -0,0478 | |||
| MDT / Medtronic plc | 0,09 | 20,23 | 9,69 | 34,08 | 0,5876 | 0,1747 | |||
| PGR / The Progressive Corporation | 0,12 | -3,23 | 9,64 | -6,48 | 0,5845 | -0,0044 | |||
| CBRE / CBRE Group, Inc. | 0,17 | -13,68 | 9,10 | -10,80 | 0,5519 | -0,0311 | |||
| ADBE / Adobe Inc. | 0,03 | -3,94 | 8,93 | -9,94 | 0,5417 | -0,0250 | |||
| ZTS / Zoetis Inc. | 0,07 | -13,95 | 8,93 | -5,53 | 0,5417 | 0,0014 | |||
| PNC / The PNC Financial Services Group, Inc. | 0,06 | -3,95 | 8,90 | -1,93 | 0,5398 | 0,0212 | |||
| TMO / Thermo Fisher Scientific Inc. | 0,03 | -4,00 | 8,86 | -4,80 | 0,5370 | 0,0055 | |||
| BA / The Boeing Company | 0,02 | -2,86 | 8,80 | 1,53 | 0,5338 | 0,0384 | |||
| AZO / AutoZone, Inc. | 0,01 | -4,00 | 8,79 | -5,30 | 0,5334 | 0,0027 | |||
| BSX / Boston Scientific Corporation | 0,21 | -3,95 | 8,71 | -9,07 | 0,5280 | -0,0191 | |||
| WM / Waste Management, Inc. | 0,08 | 12,50 | 8,63 | 12,15 | 0,5235 | 0,0837 | |||
| MO / Altria Group, Inc. | 0,20 | 2,34 | 8,38 | -11,60 | 0,5084 | -0,0335 | |||
| MS / Morgan Stanley | 0,19 | 12,65 | 8,24 | 9,72 | 0,4998 | 0,0706 | |||
| CE / Celanese Corporation | 0,07 | -2,97 | 8,14 | 10,06 | 0,4938 | 0,0710 | |||
| SPGI / S&P Global Inc. | 0,03 | -23,94 | 8,00 | -18,21 | 0,4849 | -0,0737 | |||
| TRP / TC Energy Corporation | 0,15 | 0,00 | 7,57 | 4,29 | 0,4588 | 0,0443 | |||
| CAT / Caterpillar Inc. | 0,06 | -3,10 | 7,27 | -10,19 | 0,4410 | -0,0217 | |||
| UNP / Union Pacific Corporation | 0,04 | -17,88 | 7,12 | -21,34 | 0,4317 | -0,0854 | |||
| BCEXF / BCE Inc. - Preferred Stock | 0,15 | 0,00 | 7,03 | 6,15 | 0,4263 | 0,0479 | |||
| META / Meta Platforms, Inc. | 0,04 | -3,94 | 6,67 | -11,37 | 0,4047 | -0,0255 | |||
| STZ / Constellation Brands, Inc. | 0,03 | -3,94 | 6,52 | 1,10 | 0,3955 | 0,0269 | |||
| TU / TELUS Corporation | 0,18 | 0,00 | 6,43 | -3,87 | 0,3899 | 0,0077 | |||
| SJRWF / Shaw Communications Inc. - Class A | 0,33 | 0,00 | 6,42 | -3,85 | 0,3892 | 0,0078 | |||
| BKNG / Booking Holdings Inc. | 0,00 | -3,60 | 6,41 | 0,93 | 0,3890 | 0,0258 | |||
| TXN / Texas Instruments Incorporated | 0,05 | 6,37 | 0,3865 | 0,3865 | |||||
| NVDA / NVIDIA Corporation | 0,04 | 48,93 | 6,20 | 57,83 | 0,3757 | 0,1514 | |||
| EOG / EOG Resources, Inc. | 0,08 | -3,95 | 6,07 | -23,48 | 0,3682 | -0,0852 | |||
| VRTX / Vertex Pharmaceuticals Incorporated | 0,04 | -2,91 | 6,04 | -10,31 | 0,3666 | -0,0185 | |||
| COST / Costco Wholesale Corporation | 0,02 | -3,96 | 5,67 | 4,71 | 0,3436 | 0,0344 | |||
| LYB / LyondellBasell Industries N.V. | 0,04 | 15,50 | 3,83 | 19,97 | 0,2325 | 0,0499 | |||
| CME / CME Group Inc. | 0,02 | 0,00 | 3,67 | 8,88 | 0,2223 | 0,0299 | |||
| PEP / PepsiCo, Inc. | 0,03 | 0,00 | 3,59 | 4,57 | 0,2178 | 0,0216 | |||
| LAZ / Lazard, Inc. | 0,10 | 18,69 | 3,43 | 20,79 | 0,2079 | 0,0457 | |||
| NTR / Nutrien Ltd. | 0,06 | 10,44 | 3,19 | 2,67 | 0,1932 | 0,0159 | |||
| CSCO / Cisco Systems, Inc. | 0,06 | 0,00 | 3,06 | -9,71 | 0,1855 | -0,0081 | |||
| JNJ / Johnson & Johnson | 0,02 | 0,00 | 3,05 | -7,13 | 0,1850 | -0,0027 | |||
| CPRI / Capri Holdings Limited | 0,09 | -6,95 | 3,04 | -11,05 | 0,1841 | -0,0109 | |||
| OKE / ONEOK, Inc. | 0,04 | 0,00 | 2,64 | 7,09 | 0,1603 | 0,0193 | |||
| SNXZF / Sandstorm Gold Ltd. | 0,38 | 12,71 | 2,17 | 14,63 | 0,1316 | 0,1316 | |||
| NOA / North American Construction Group Ltd. | 0,07 | 0,84 | 0,0509 | 0,0509 | |||||
| HBM / Hudbay Minerals Inc. | 0,13 | -59,73 | 0,47 | -73,19 | 0,0283 | -0,0710 | |||
| IYR / iShares Trust - iShares U.S. Real Estate ETF | 0,00 | 16,30 | 0,40 | 24,61 | 0,0243 | 0,0059 | |||
| CCI / Crown Castle Inc. | 0,00 | -1,18 | 0,31 | 5,39 | 0,0190 | 0,0020 | |||
| CIGI / Colliers International Group Inc. | 0,00 | -100,00 | 0,00 | -100,00 | -0,5816 | ||||
| NOW / ServiceNow, Inc. | 0,00 | -100,00 | 0,00 | -100,00 | -0,3870 |