Grundlæggende statistik
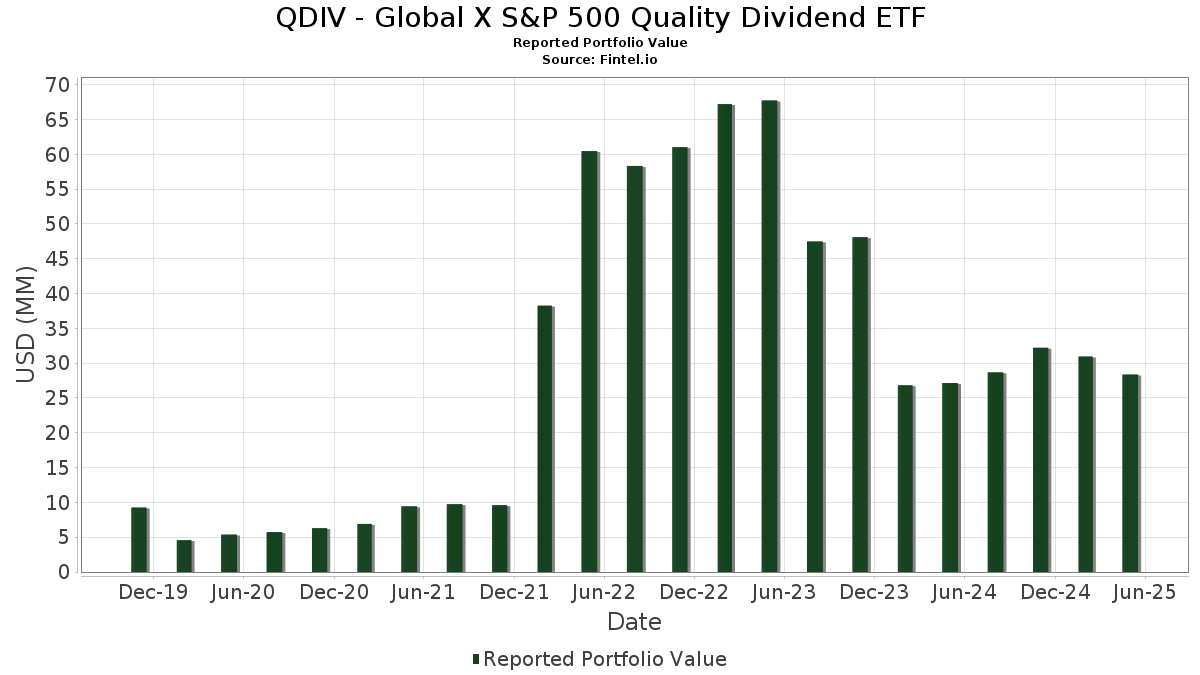
| Porteføljeværdi | $ 28.353.932 |
| Nuværende stillinger | 61 |
Seneste beholdninger, ydeevne, AUM (fra 13F, 13D)
QDIV - Global X S&P 500 Quality Dividend ETF har afsløret 61 samlede besiddelser i deres seneste SEC-arkivering. Den seneste porteføljeværdi er beregnet til at være $ 28.353.932 USD. Faktiske aktiver under forvaltning (AUM) er denne værdi plus kontanter (som ikke er oplyst). QDIV - Global X S&P 500 Quality Dividend ETFs største beholdninger er CME Group Inc. (US:CME) , RTX Corporation (US:RTX) , Huntington Ingalls Industries, Inc. (US:HII) , 3M Company (US:MMM) , and Paychex, Inc. (US:PAYX) .
Top øger dette kvartal
Vi bruger ændringen i porteføljeallokeringen, fordi dette er den mest meningsfulde metrik. Ændringer kan skyldes handler eller ændringer i aktiekurser.
| Sikkerhed | Aktier (MM) |
Værdi (MM$) |
Portefølje % | ΔPortefølje % |
|---|---|---|---|---|
| 0,00 | 0,61 | 2,1607 | 0,5663 | |
| 0,00 | 0,65 | 2,2672 | 0,4007 | |
| 0,00 | 0,56 | 1,9684 | 0,2936 | |
| 0,00 | 0,59 | 2,0588 | 0,2587 | |
| 0,00 | 0,52 | 1,8125 | 0,2244 | |
| 0,00 | 0,53 | 1,8531 | 0,2215 | |
| 0,00 | 0,59 | 2,0891 | 0,2121 | |
| 0,00 | 0,61 | 2,1615 | 0,1911 | |
| 0,00 | 0,58 | 2,0412 | 0,1879 | |
| 0,01 | 0,46 | 1,6322 | 0,1825 |
Top falder i dette kvartal
Vi bruger ændringen i porteføljeallokeringen, fordi dette er den mest meningsfulde metrik. Ændringer kan skyldes handler eller ændringer i aktiekurser.
| Sikkerhed | Aktier (MM) |
Værdi (MM$) |
Portefølje % | ΔPortefølje % |
|---|---|---|---|---|
| 0,01 | 0,40 | 1,4050 | -0,3858 | |
| 0,01 | 0,39 | 1,3861 | -0,3854 | |
| 0,01 | 0,36 | 1,2659 | -0,3618 | |
| 0,01 | 0,42 | 1,4624 | -0,3317 | |
| 0,01 | 0,42 | 1,4839 | -0,2492 | |
| 0,00 | 0,29 | 1,0342 | -0,2476 | |
| 0,01 | 0,47 | 1,6393 | -0,2063 | |
| 0,00 | 0,40 | 1,4067 | -0,2063 | |
| 0,02 | 0,47 | 1,6664 | -0,1985 | |
| 0,01 | 0,40 | 1,3990 | -0,1790 |
13F og Fondsarkivering
Denne formular blev indsendt den 2025-07-30 for rapporteringsperioden 2025-05-31. Klik på linkikonet for at se den fulde transaktionshistorik.
Opgrader for at låse op for premium-data og eksportere til Excel ![]() .
.
| Sikkerhed | Type | Gennemsnitlig aktiekurs | Aktier (MM) |
Δ Aktier (%) |
Δ Aktier (%) |
Værdi ($MM) |
Portefølje (%) |
ΔPortefølje (%) |
|
|---|---|---|---|---|---|---|---|---|---|
| CME / CME Group Inc. | 0,00 | -2,28 | 0,65 | 11,40 | 2,2672 | 0,4007 | |||
| RTX / RTX Corporation | 0,00 | -2,06 | 0,61 | 0,49 | 2,1615 | 0,1911 | |||
| HII / Huntington Ingalls Industries, Inc. | 0,00 | -2,27 | 0,61 | 24,04 | 2,1607 | 0,5663 | |||
| MMM / 3M Company | 0,00 | -2,01 | 0,61 | -6,19 | 2,1305 | 0,0475 | |||
| PAYX / Paychex, Inc. | 0,00 | -2,06 | 0,59 | 2,06 | 2,0891 | 0,2121 | |||
| MPC / Marathon Petroleum Corporation | 0,00 | -2,10 | 0,59 | 4,84 | 2,0588 | 0,2587 | |||
| ADP / Automatic Data Processing, Inc. | 0,00 | -2,30 | 0,58 | 0,87 | 2,0412 | 0,1879 | |||
| ABBV / AbbVie Inc. | 0,00 | -2,02 | 0,57 | -12,86 | 2,0030 | -0,1005 | |||
| JNJ / Johnson & Johnson | 0,00 | -2,30 | 0,56 | -8,20 | 1,9710 | 0,0059 | |||
| GD / General Dynamics Corporation | 0,00 | -2,33 | 0,56 | 7,69 | 1,9684 | 0,2936 | |||
| MDT / Medtronic plc | 0,01 | -2,02 | 0,53 | -11,59 | 1,8771 | -0,0695 | |||
| BAX / Baxter International Inc. | 0,02 | -2,04 | 0,53 | -13,47 | 1,8768 | -0,1093 | |||
| HON / Honeywell International Inc. | 0,00 | -2,27 | 0,53 | 4,15 | 1,8531 | 0,2215 | |||
| CINF / Cincinnati Financial Corporation | 0,00 | -2,08 | 0,53 | -0,19 | 1,8474 | 0,1534 | |||
| LMT / Lockheed Martin Corporation | 0,00 | -2,37 | 0,52 | 4,46 | 1,8125 | 0,2244 | |||
| MCHP / Microchip Technology Incorporated | 0,01 | -2,02 | 0,51 | -3,38 | 1,8068 | 0,0934 | |||
| PSA / Public Storage | 0,00 | -2,35 | 0,51 | -0,77 | 1,8038 | 0,1377 | |||
| CTRA / Coterra Energy Inc. | 0,02 | -1,98 | 0,51 | -11,79 | 1,7906 | -0,0676 | |||
| EG / Everest Group, Ltd. | 0,00 | -2,28 | 0,51 | -3,98 | 1,7804 | 0,0822 | |||
| UNP / Union Pacific Corporation | 0,00 | -2,34 | 0,50 | -12,32 | 1,7537 | -0,0774 | |||
| XOM / Exxon Mobil Corporation | 0,00 | -2,05 | 0,49 | -10,11 | 1,7216 | -0,0308 | |||
| QCOM / QUALCOMM Incorporated | 0,00 | -2,02 | 0,49 | -9,50 | 1,7087 | -0,0208 | |||
| KO / The Coca-Cola Company | 0,01 | -2,08 | 0,48 | -0,82 | 1,6956 | 0,1287 | |||
| SNA / Snap-on Incorporated | 0,00 | -2,36 | 0,48 | -8,27 | 1,6787 | 0,0032 | |||
| ITW / Illinois Tool Works Inc. | 0,00 | -2,31 | 0,48 | -9,33 | 1,6754 | -0,0171 | |||
| DVN / Devon Energy Corporation | 0,02 | -2,01 | 0,47 | -18,13 | 1,6664 | -0,1985 | |||
| PPG / PPG Industries, Inc. | 0,00 | -2,06 | 0,47 | -4,06 | 1,6641 | 0,0734 | |||
| BKR / Baker Hughes Company | 0,01 | -2,06 | 0,47 | -18,67 | 1,6393 | -0,2063 | |||
| KR / The Kroger Co. | 0,01 | -2,00 | 0,46 | 3,11 | 1,6322 | 0,1825 | |||
| CMI / Cummins Inc. | 0,00 | -2,31 | 0,46 | -14,76 | 1,6271 | -0,1205 | |||
| KMB / Kimberly-Clark Corporation | 0,00 | -2,07 | 0,46 | -0,86 | 1,6245 | 0,1232 | |||
| MDLZ / Mondelez International, Inc. | 0,01 | -2,45 | 0,46 | 2,46 | 1,6119 | 0,1711 | |||
| CMCSA / Comcast Corporation | 0,01 | -2,46 | 0,46 | -5,97 | 1,6084 | 0,0404 | |||
| CHRW / C.H. Robinson Worldwide, Inc. | 0,00 | -2,01 | 0,46 | -7,49 | 1,6077 | 0,0160 | |||
| IP / International Paper Company | 0,01 | -2,02 | 0,46 | -16,94 | 1,6062 | -0,1640 | |||
| EOG / EOG Resources, Inc. | 0,00 | -2,01 | 0,45 | -16,24 | 1,5974 | -0,1489 | |||
| KVUE / Kenvue Inc. | 0,02 | -3,19 | 0,45 | -1,95 | 1,5895 | 0,1023 | |||
| COP / ConocoPhillips | 0,01 | -2,46 | 0,45 | -16,01 | 1,5692 | -0,1431 | |||
| K / Kellanova | 0,01 | -2,07 | 0,43 | -2,26 | 1,5224 | 0,0934 | |||
| OMC / Omnicom Group Inc. | 0,01 | -2,43 | 0,43 | -13,51 | 1,5100 | -0,0879 | |||
| EMN / Eastman Chemical Company | 0,01 | -2,05 | 0,42 | -21,56 | 1,4839 | -0,2492 | |||
| PG / The Procter & Gamble Company | 0,00 | -2,30 | 0,42 | -4,57 | 1,4713 | 0,0595 | |||
| CL / Colgate-Palmolive Company | 0,00 | -2,41 | 0,42 | -0,48 | 1,4707 | 0,1163 | |||
| NKE / NIKE, Inc. | 0,01 | -2,10 | 0,42 | -25,31 | 1,4624 | -0,3317 | |||
| TROW / T. Rowe Price Group, Inc. | 0,00 | -2,49 | 0,41 | -13,78 | 1,4536 | -0,0893 | |||
| SWKS / Skyworks Solutions, Inc. | 0,01 | -2,55 | 0,40 | 0,76 | 1,4087 | 0,1297 | |||
| UPS / United Parcel Service, Inc. | 0,00 | -2,50 | 0,40 | -20,00 | 1,4067 | -0,2063 | |||
| BBY / Best Buy Co., Inc. | 0,01 | -2,49 | 0,40 | -28,24 | 1,4050 | -0,3858 | |||
| MRK / Merck & Co., Inc. | 0,01 | -2,48 | 0,40 | -18,78 | 1,3990 | -0,1790 | |||
| LYB / LyondellBasell Industries N.V. | 0,01 | -2,50 | 0,39 | -28,36 | 1,3861 | -0,3854 | |||
| TSN / Tyson Foods, Inc. | 0,01 | -2,06 | 0,39 | -10,30 | 1,3784 | -0,0300 | |||
| ADM / Archer-Daniels-Midland Company | 0,01 | -3,22 | 0,39 | -1,02 | 1,3619 | 0,1012 | |||
| MKC / McCormick & Company, Incorporated | 0,01 | -2,45 | 0,38 | -14,25 | 1,3347 | -0,0891 | |||
| TAP / Molson Coors Beverage Company | 0,01 | -2,49 | 0,37 | -14,58 | 1,2974 | -0,0968 | |||
| HSY / The Hershey Company | 0,00 | -3,24 | 0,37 | -10,00 | 1,2973 | -0,0230 | |||
| DOW / Dow Inc. | 0,01 | -2,11 | 0,36 | -28,71 | 1,2659 | -0,3618 | |||
| PEP / PepsiCo, Inc. | 0,00 | -2,27 | 0,35 | -16,23 | 1,2341 | -0,1166 | |||
| GIS / General Mills, Inc. | 0,01 | -2,53 | 0,34 | -12,76 | 1,2026 | -0,0604 | |||
| CAG / Conagra Brands, Inc. | 0,01 | -2,48 | 0,34 | -12,56 | 1,1997 | -0,0579 | |||
| BFB / Brown-Forman Corp. - Class B | 0,01 | -2,49 | 0,31 | -1,89 | 1,0953 | 0,0732 | |||
| TGT / Target Corporation | 0,00 | -2,31 | 0,29 | -26,13 | 1,0342 | -0,2476 |