Grundlæggende statistik
| Porteføljeværdi | $ 197.129.656 |
| Nuværende stillinger | 109 |
Seneste beholdninger, ydeevne, AUM (fra 13F, 13D)
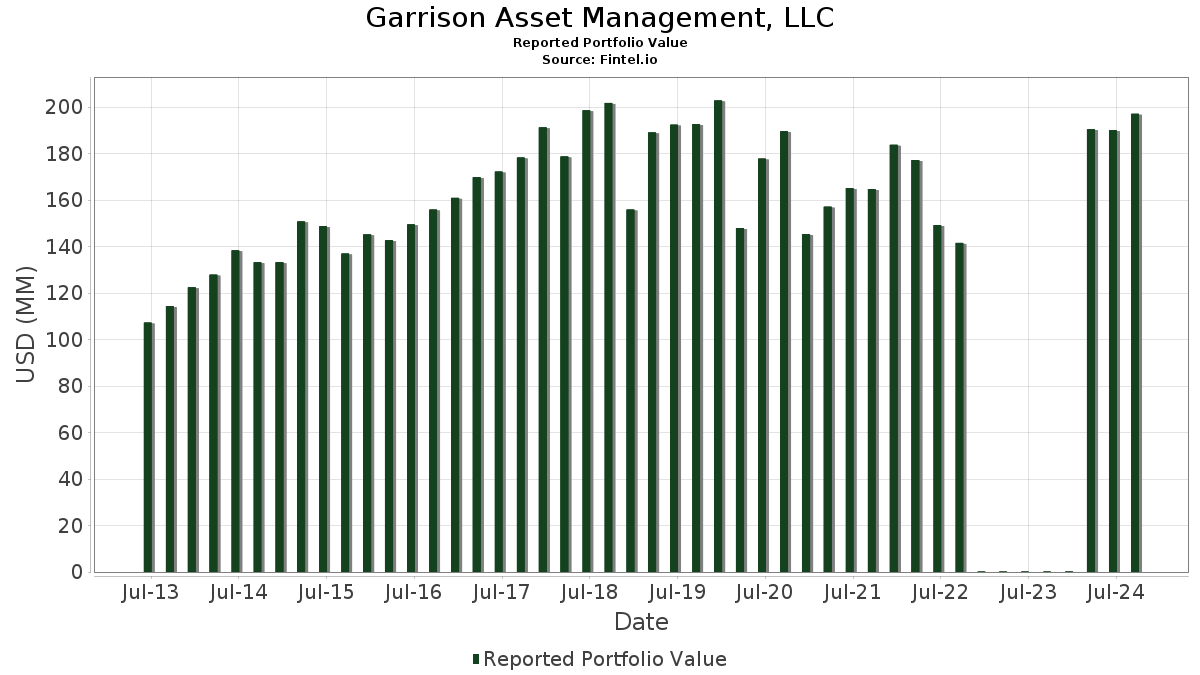
Garrison Asset Management, LLC har afsløret 109 samlede besiddelser i deres seneste SEC-arkivering. Den seneste porteføljeværdi er beregnet til at være $ 197.129.656 USD. Faktiske aktiver under forvaltning (AUM) er denne værdi plus kontanter (som ikke er oplyst). Garrison Asset Management, LLCs største beholdninger er Broadcom Inc. (US:AVGO) , Arista Networks Inc (US:ANET) , AutoZone, Inc. (US:AZO) , AbbVie Inc. (US:ABBV) , and Accenture plc (US:ACN) . Garrison Asset Management, LLCs nye stillinger omfatter Vanguard Index Funds - Vanguard Total Stock Market ETF (US:VTI) , .
Top øger dette kvartal
Vi bruger ændringen i porteføljeallokeringen, fordi dette er den mest meningsfulde metrik. Ændringer kan skyldes handler eller ændringer i aktiekurser.
| Sikkerhed | Aktier (MM) |
Værdi (MM$) |
Portefølje % | ΔPortefølje % |
|---|---|---|---|---|
| 0,02 | 5,54 | 2,8120 | 0,2396 | |
| 0,02 | 2,68 | 1,3570 | 0,1803 | |
| 0,03 | 5,60 | 2,8395 | 0,1553 | |
| 0,00 | 0,30 | 0,1523 | 0,1523 | |
| 0,00 | 2,08 | 1,0554 | 0,1472 | |
| 0,01 | 3,56 | 1,8036 | 0,1386 | |
| 0,00 | 0,27 | 0,1363 | 0,1363 | |
| 0,03 | 3,41 | 1,7291 | 0,1363 | |
| 0,02 | 3,77 | 1,9143 | 0,1284 | |
| 0,01 | 2,16 | 1,0964 | 0,1246 |
Top falder i dette kvartal
Vi bruger ændringen i porteføljeallokeringen, fordi dette er den mest meningsfulde metrik. Ændringer kan skyldes handler eller ændringer i aktiekurser.
| Sikkerhed | Aktier (MM) |
Værdi (MM$) |
Portefølje % | ΔPortefølje % |
|---|---|---|---|---|
| 0,06 | 10,55 | 5,3522 | -0,4157 | |
| 0,02 | 4,97 | 2,5220 | -0,2939 | |
| 0,03 | 3,52 | 1,7873 | -0,2727 | |
| 0,02 | 3,35 | 1,6995 | -0,2435 | |
| 0,02 | 3,15 | 1,5983 | -0,2209 | |
| 0,00 | 2,02 | 1,0229 | -0,2047 | |
| 0,01 | 1,32 | 0,6674 | -0,1943 | |
| 0,02 | 1,87 | 0,9492 | -0,1737 | |
| 0,01 | 4,29 | 2,1782 | -0,1379 | |
| 0,01 | 1,58 | 0,8006 | -0,1322 |
13F og Fondsarkivering
Denne formular blev indsendt den 2024-10-30 for rapporteringsperioden 2024-09-30. Klik på linkikonet for at se den fulde transaktionshistorik.
Opgrader for at låse op for premium-data og eksportere til Excel ![]() .
.
| Sikkerhed | Type | Gennemsnitlig aktiekurs | Aktier (MM) |
Δ Aktier (%) |
Δ Aktier (%) |
Værdi ($MM) |
Portefølje (%) |
ΔPortefølje (%) |
|
|---|---|---|---|---|---|---|---|---|---|
| AVGO / Broadcom Inc. | 0,06 | 795,78 | 10,55 | -3,76 | 5,3522 | -0,4157 | |||
| ANET / Arista Networks Inc | 0,02 | -8,28 | 7,84 | 0,45 | 3,9780 | -0,1296 | |||
| AZO / AutoZone, Inc. | 0,00 | -4,95 | 6,84 | 1,00 | 3,4676 | -0,0929 | |||
| ABBV / AbbVie Inc. | 0,03 | -4,70 | 5,60 | 9,72 | 2,8395 | 0,1553 | |||
| ACN / Accenture plc | 0,02 | -2,68 | 5,54 | 13,38 | 2,8120 | 0,2396 | |||
| SCHB / Schwab Strategic Trust - Schwab U.S. Broad Market ETF | 0,08 | -3,14 | 5,37 | 2,48 | 2,7260 | -0,0328 | |||
| WM / Waste Management, Inc. | 0,02 | -4,54 | 4,97 | -7,12 | 2,5220 | -0,2939 | |||
| TXN / Texas Instruments Incorporated | 0,02 | -3,49 | 4,96 | 2,48 | 2,5149 | -0,0303 | |||
| LECO / Lincoln Electric Holdings, Inc. | 0,02 | -1,47 | 4,70 | 0,30 | 2,3833 | -0,0814 | |||
| ABT / Abbott Laboratories | 0,04 | -1,60 | 4,34 | 7,96 | 2,2024 | 0,0867 | |||
| ANSS / ANSYS, Inc. | 0,01 | -1,58 | 4,29 | -2,45 | 2,1782 | -0,1379 | |||
| DE / Deere & Company | 0,01 | -2,87 | 4,07 | 8,51 | 2,0626 | 0,0907 | |||
| BR / Broadridge Financial Solutions, Inc. | 0,02 | -2,01 | 3,78 | 6,96 | 1,9180 | 0,0582 | |||
| ATR / AptarGroup, Inc. | 0,02 | -2,27 | 3,77 | 11,17 | 1,9143 | 0,1284 | |||
| PG / The Procter & Gamble Company | 0,02 | -2,86 | 3,58 | 2,02 | 1,8163 | -0,0302 | |||
| META / Meta Platforms, Inc. | 0,01 | -1,04 | 3,56 | 12,36 | 1,8036 | 0,1386 | |||
| PANW / Palo Alto Networks, Inc. | 0,01 | -0,96 | 3,55 | -0,14 | 1,7991 | -0,0697 | |||
| PEP / PepsiCo, Inc. | 0,02 | -2,27 | 3,53 | 0,77 | 1,7902 | -0,0526 | |||
| COP / ConocoPhillips | 0,03 | -2,23 | 3,52 | -10,01 | 1,7873 | -0,2727 | |||
| VRT / Vertiv Holdings Co | 0,03 | -2,03 | 3,41 | 12,59 | 1,7291 | 0,1363 | |||
| BDX / Becton, Dickinson and Company | 0,01 | -0,99 | 3,36 | 2,13 | 1,7049 | -0,0263 | |||
| GOOG / Alphabet Inc. | 0,02 | -0,47 | 3,35 | -9,26 | 1,6995 | -0,2435 | |||
| AAPL / Apple Inc. | 0,01 | -1,56 | 3,28 | 8,90 | 1,6641 | 0,0792 | |||
| JNJ / Johnson & Johnson | 0,02 | -1,54 | 3,25 | 9,16 | 1,6512 | 0,0825 | |||
| VRSK / Verisk Analytics, Inc. | 0,01 | -1,63 | 3,20 | -2,20 | 1,6244 | -0,0985 | |||
| MA / Mastercard Incorporated | 0,01 | -0,80 | 3,18 | 11,05 | 1,6112 | 0,1062 | |||
| PSX / Phillips 66 | 0,02 | -2,14 | 3,15 | -8,88 | 1,5983 | -0,2209 | |||
| ROK / Rockwell Automation, Inc. | 0,01 | -1,15 | 3,05 | -3,61 | 1,5461 | -0,1173 | |||
| LH / Labcorp Holdings Inc. | 0,01 | -1,17 | 3,00 | 8,53 | 1,5243 | 0,0676 | |||
| SCHA / Schwab Strategic Trust - Schwab U.S. Small-Cap ETF | 0,05 | -0,01 | 2,78 | 8,55 | 1,4108 | 0,0625 | |||
| XYL / Xylem Inc. | 0,02 | -1,92 | 2,75 | -2,34 | 1,3963 | -0,0868 | |||
| RVTY / Revvity, Inc. | 0,02 | -1,82 | 2,68 | 19,63 | 1,3570 | 0,1803 | |||
| MDT / Medtronic plc | 0,03 | -0,89 | 2,37 | 13,40 | 1,2018 | 0,1023 | |||
| CSCO / Cisco Systems, Inc. | 0,04 | -0,40 | 2,24 | 11,58 | 1,1338 | 0,0798 | |||
| PWR / Quanta Services, Inc. | 0,01 | -0,28 | 2,16 | 17,06 | 1,0964 | 0,1246 | |||
| JBHT / J.B. Hunt Transport Services, Inc. | 0,01 | -6,53 | 2,16 | 0,65 | 1,0957 | -0,0331 | |||
| AKAM / Akamai Technologies, Inc. | 0,02 | -0,65 | 2,13 | 11,33 | 1,0818 | 0,0740 | |||
| SCHF / Schwab Strategic Trust - Schwab International Equity ETF | 0,05 | -1,74 | 2,13 | 5,15 | 1,0783 | 0,0148 | |||
| KMB / Kimberly-Clark Corporation | 0,01 | -2,32 | 2,12 | 0,57 | 1,0769 | -0,0338 | |||
| ETN / Eaton Corporation plc | 0,01 | -0,44 | 2,11 | 5,24 | 1,0697 | 0,0155 | |||
| MSCI / MSCI Inc. | 0,00 | -0,39 | 2,08 | 20,51 | 1,0554 | 0,1472 | |||
| LLY / Eli Lilly and Company | 0,00 | -11,68 | 2,02 | -13,59 | 1,0229 | -0,2047 | |||
| AEP / American Electric Power Company, Inc. | 0,02 | 0,58 | 1,95 | 17,61 | 0,9894 | 0,1169 | |||
| BG / Bunge Global SA | 0,02 | -3,13 | 1,87 | -12,32 | 0,9492 | -0,1737 | |||
| VFH / Vanguard World Fund - Vanguard Financials ETF | 0,02 | -2,75 | 1,82 | 7,05 | 0,9244 | 0,0285 | |||
| EOG / EOG Resources, Inc. | 0,01 | 1,84 | 1,76 | -0,56 | 0,8947 | -0,0383 | |||
| ZS / Zscaler, Inc. | 0,01 | 0,09 | 1,58 | -10,95 | 0,8006 | -0,1322 | |||
| MSFT / Microsoft Corporation | 0,00 | -3,97 | 1,50 | -7,52 | 0,7609 | -0,0927 | |||
| NVO / Novo Nordisk A/S - Depositary Receipt (Common Stock) | 0,01 | -3,70 | 1,32 | -19,67 | 0,6674 | -0,1943 | |||
| SCHD / Schwab Strategic Trust - Schwab U.S. Dividend Equity ETF | 0,02 | 1,85 | 1,27 | 10,72 | 0,6447 | 0,0408 | |||
| VTR / Ventas, Inc. | 0,02 | 0,67 | 1,25 | 26,06 | 0,6357 | 0,1122 | |||
| DIS / The Walt Disney Company | 0,01 | -1,90 | 1,17 | -4,95 | 0,5940 | -0,0543 | |||
| WMT / Walmart Inc. | 0,01 | 1,19 | 0,99 | 20,66 | 0,5042 | 0,0709 | |||
| XOM / Exxon Mobil Corporation | 0,01 | -0,70 | 0,93 | 1,08 | 0,4737 | -0,0122 | |||
| SCHX / Schwab Strategic Trust - Schwab U.S. Large-Cap ETF | 0,01 | -0,15 | 0,91 | 5,44 | 0,4624 | 0,0076 | |||
| ADI / Analog Devices, Inc. | 0,00 | -5,90 | 0,87 | -5,21 | 0,4433 | -0,0413 | |||
| DGRW / WisdomTree Trust - WisdomTree U.S. Quality Dividend Growth Fund | 0,01 | 2,53 | 0,76 | 9,46 | 0,3876 | 0,0198 | |||
| EIPI / First Trust Exchange-Traded Fund VIII - FT Energy Income Partners Enhanced Income ETF | 0,04 | 2,61 | 0,74 | 6,76 | 0,3768 | 0,0111 | |||
| HD / The Home Depot, Inc. | 0,00 | 1,16 | 0,74 | 19,16 | 0,3755 | 0,0484 | |||
| GOOGL / Alphabet Inc. | 0,00 | 2,76 | 0,66 | -6,39 | 0,3346 | -0,0363 | |||
| COST / Costco Wholesale Corporation | 0,00 | 2,20 | 0,66 | 6,48 | 0,3337 | 0,0090 | |||
| AZN / AstraZeneca PLC - Depositary Receipt (Common Stock) | 0,01 | -0,31 | 0,63 | -0,48 | 0,3180 | -0,0132 | |||
| RPM / RPM International Inc. | 0,01 | -0,39 | 0,62 | 11,78 | 0,3135 | 0,0230 | |||
| MAA / Mid-America Apartment Communities, Inc. | 0,00 | 0,50 | 0,60 | 12,06 | 0,3065 | 0,0226 | |||
| AMZN / Amazon.com, Inc. | 0,00 | 4,78 | 0,60 | 1,02 | 0,3025 | -0,0081 | |||
| AZPN / Aspen Technology, Inc. | 0,00 | 1,64 | 0,58 | 22,20 | 0,2935 | 0,0444 | |||
| SCHM / Schwab Strategic Trust - Schwab U.S. Mid-Cap ETF | 0,01 | 2,95 | 0,57 | 9,88 | 0,2878 | 0,0162 | |||
| JPM / JPMorgan Chase & Co. | 0,00 | 3,81 | 0,55 | 8,13 | 0,2767 | 0,0115 | |||
| V / Visa Inc. | 0,00 | 2,62 | 0,53 | 7,55 | 0,2677 | 0,0094 | |||
| SCHE / Schwab Strategic Trust - Schwab Emerging Markets Equity ETF | 0,02 | 9,05 | 0,52 | 19,91 | 0,2659 | 0,0357 | |||
| AXP / American Express Company | 0,00 | -4,14 | 0,50 | 12,08 | 0,2547 | 0,0194 | |||
| KO / The Coca-Cola Company | 0,01 | -4,75 | 0,49 | 7,51 | 0,2473 | 0,0088 | |||
| FDX / FedEx Corporation | 0,00 | 0,00 | 0,47 | -8,74 | 0,2385 | -0,0325 | |||
| NOBL / ProShares Trust - ProShares S&P 500 Dividend Aristocrats ETF | 0,00 | 0,02 | 0,46 | 11,03 | 0,2352 | 0,0156 | |||
| UNH / UnitedHealth Group Incorporated | 0,00 | 0,00 | 0,45 | 14,80 | 0,2287 | 0,0221 | |||
| CDNS / Cadence Design Systems, Inc. | 0,00 | 0,00 | 0,43 | -12,01 | 0,2160 | -0,0384 | |||
| GPC / Genuine Parts Company | 0,00 | 0,03 | 0,42 | 0,97 | 0,2114 | -0,0057 | |||
| ADBE / Adobe Inc. | 0,00 | -1,49 | 0,41 | -8,04 | 0,2091 | -0,0271 | |||
| RSPG / Invesco Exchange-Traded Fund Trust - Invesco S&P 500 Equal Weight Energy ETF | 0,01 | -3,59 | 0,41 | -8,28 | 0,2080 | -0,0274 | |||
| RSPH / Invesco Exchange-Traded Fund Trust - Invesco S&P 500 Equal Weight Health Care ETF | 0,01 | -1,17 | 0,41 | 6,23 | 0,2077 | 0,0046 | |||
| TMO / Thermo Fisher Scientific Inc. | 0,00 | -0,75 | 0,41 | 11,20 | 0,2065 | 0,0136 | |||
| SPY / SPDR S&P 500 ETF | 0,00 | -2,77 | 0,40 | 2,55 | 0,2043 | -0,0024 | |||
| PLD / Prologis, Inc. | 0,00 | 0,00 | 0,39 | 12,32 | 0,1992 | 0,0154 | |||
| CTAS / Cintas Corporation | 0,00 | 295,82 | 0,37 | 16,35 | 0,1881 | 0,0205 | |||
| DLR / Digital Realty Trust, Inc. | 0,00 | -0,04 | 0,37 | 6,36 | 0,1868 | 0,0047 | |||
| GRMN / Garmin Ltd. | 0,00 | -3,74 | 0,35 | 3,82 | 0,1794 | 0,0005 | |||
| WAT / Waters Corporation | 0,00 | 0,00 | 0,34 | 23,91 | 0,1738 | 0,0285 | |||
| MCD / McDonald's Corporation | 0,00 | 0,00 | 0,34 | 19,50 | 0,1710 | 0,0226 | |||
| ITW / Illinois Tool Works Inc. | 0,00 | 0,00 | 0,32 | 10,76 | 0,1619 | 0,0101 | |||
| IYW / iShares Trust - iShares U.S. Technology ETF | 0,00 | -3,12 | 0,31 | -2,56 | 0,1550 | -0,0097 | |||
| VGT / Vanguard World Fund - Vanguard Information Technology ETF | 0,00 | 0,30 | 0,1523 | 0,1523 | |||||
| HCA / HCA Healthcare, Inc. | 0,00 | 6,96 | 0,29 | 35,65 | 0,1489 | 0,0348 | |||
| BRK.B / Berkshire Hathaway Inc. | 0,00 | 0,00 | 0,29 | 13,23 | 0,1478 | 0,0123 | |||
| NVDA / NVIDIA Corporation | 0,00 | -6,31 | 0,29 | -7,94 | 0,1472 | -0,0186 | |||
| WTW / Willis Towers Watson Public Limited Company | 0,00 | 0,00 | 0,29 | 12,50 | 0,1464 | 0,0113 | |||
| SON / Sonoco Products Company | 0,01 | -2,30 | 0,29 | 5,17 | 0,1450 | 0,0021 | |||
| XLK / The Select Sector SPDR Trust - The Technology Select Sector SPDR Fund | 0,00 | 0,00 | 0,28 | -0,35 | 0,1443 | -0,0057 | |||
| VTI / Vanguard Index Funds - Vanguard Total Stock Market ETF | 0,00 | 0,27 | 0,1363 | 0,1363 | |||||
| WPC / W. P. Carey Inc. | 0,00 | 0,09 | 0,27 | 13,25 | 0,1346 | 0,0114 | |||
| AMP / Ameriprise Financial, Inc. | 0,00 | 0,00 | 0,26 | 9,87 | 0,1301 | 0,0074 | |||
| TT / Trane Technologies plc | 0,00 | 0,00 | 0,24 | 18,05 | 0,1232 | 0,0151 | |||
| SNY / Sanofi - Depositary Receipt (Common Stock) | 0,00 | 0,23 | 0,1169 | 0,1169 | |||||
| SCHC / Schwab Strategic Trust - Schwab International Small-Cap Equity ETF | 0,01 | 1,72 | 0,23 | 10,10 | 0,1165 | 0,0068 | |||
| SCHH / Schwab Strategic Trust - Schwab U.S. REIT ETF | 0,01 | -5,09 | 0,23 | 10,19 | 0,1154 | 0,0067 | |||
| CAT / Caterpillar Inc. | 0,00 | 0,22 | 0,1093 | 0,1093 | |||||
| MRK / Merck & Co., Inc. | 0,00 | 0,00 | 0,21 | -8,26 | 0,1071 | -0,0140 | |||
| FTNT / Fortinet, Inc. | 0,00 | 0,21 | 0,1065 | 0,1065 | |||||
| VOE / Vanguard Index Funds - Vanguard Mid-Cap Value ETF | 0,00 | 0,21 | 0,1044 | 0,1044 | |||||
| CL / Colgate-Palmolive Company | 0,00 | 0,20 | 0,1031 | 0,1031 | |||||
| BCE / BCE Inc. | 0,00 | -100,00 | 0,00 | 0,0000 | |||||
| LRCX / Lam Research Corporation | 0,00 | -100,00 | 0,00 | 0,0000 |