Grundlæggende statistik
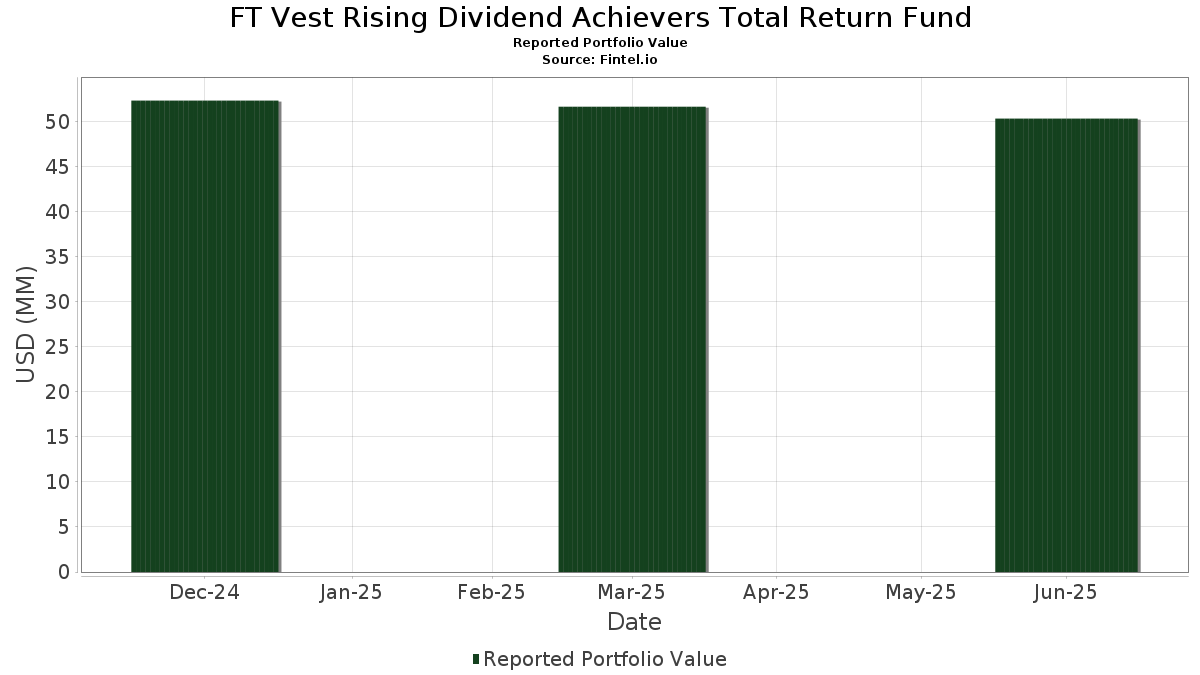
| Porteføljeværdi | $ 50.306.839 |
| Nuværende stillinger | 83 |
Seneste beholdninger, ydeevne, AUM (fra 13F, 13D)
FT Vest Rising Dividend Achievers Total Return Fund har afsløret 83 samlede besiddelser i deres seneste SEC-arkivering. Den seneste porteføljeværdi er beregnet til at være $ 50.306.839 USD. Faktiske aktiver under forvaltning (AUM) er denne værdi plus kontanter (som ikke er oplyst). FT Vest Rising Dividend Achievers Total Return Funds største beholdninger er Meta Platforms, Inc. (US:META) , Booking Holdings Inc. (US:BKNG) , Microsoft Corporation (US:MSFT) , JPMorgan Chase & Co. (US:JPM) , and eBay Inc. (US:EBAY) . FT Vest Rising Dividend Achievers Total Return Funds nye stillinger omfatter GE Vernova Inc. (US:GEV) , Dover Corporation (US:DOV) , AECOM (US:ACM) , Johnson & Johnson (US:JNJ) , and The Allstate Corporation (US:ALL) .
Top øger dette kvartal
Vi bruger ændringen i porteføljeallokeringen, fordi dette er den mest meningsfulde metrik. Ændringer kan skyldes handler eller ændringer i aktiekurser.
| Sikkerhed | Aktier (MM) |
Værdi (MM$) |
Portefølje % | ΔPortefølje % |
|---|---|---|---|---|
| 2,93 | 5,8293 | 5,8293 | ||
| 2,08 | 4,1386 | 4,1386 | ||
| 0,01 | 0,88 | 1,7585 | 0,8993 | |
| 0,00 | 0,95 | 1,8880 | 0,8406 | |
| 0,38 | 0,7551 | 0,7551 | ||
| 0,01 | 0,60 | 1,1948 | 0,7116 | |
| 0,00 | 0,56 | 1,1118 | 0,6274 | |
| 0,01 | 1,02 | 2,0297 | 0,6201 | |
| 0,00 | 0,56 | 1,1071 | 0,6137 | |
| 0,00 | 0,53 | 1,0506 | 0,5904 |
Top falder i dette kvartal
Vi bruger ændringen i porteføljeallokeringen, fordi dette er den mest meningsfulde metrik. Ændringer kan skyldes handler eller ændringer i aktiekurser.
| Sikkerhed | Aktier (MM) |
Værdi (MM$) |
Portefølje % | ΔPortefølje % |
|---|---|---|---|---|
| -4,14 | -8,2558 | -8,2558 | ||
| -0,87 | -1,7345 | -1,7345 | ||
| 0,01 | 0,25 | 0,5017 | -1,4986 | |
| 0,01 | 0,70 | 1,3879 | -0,7122 | |
| 0,00 | 0,64 | 1,2728 | -0,7008 | |
| 0,00 | 0,45 | 0,8917 | -0,6049 | |
| 0,00 | 0,45 | 0,8900 | -0,5829 | |
| 0,00 | 0,43 | 0,8504 | -0,5291 | |
| 0,01 | 0,62 | 1,2368 | -0,5262 | |
| -0,25 | -0,5078 | -0,5078 |
13F og Fondsarkivering
Denne formular blev indsendt den 2025-08-26 for rapporteringsperioden 2025-06-30. Klik på linkikonet for at se den fulde transaktionshistorik.
Opgrader for at låse op for premium-data og eksportere til Excel ![]() .
.
| Sikkerhed | Type | Gennemsnitlig aktiekurs | Aktier (MM) |
Δ Aktier (%) |
Δ Aktier (%) |
Værdi ($MM) |
Portefølje (%) |
ΔPortefølje (%) |
|
|---|---|---|---|---|---|---|---|---|---|
| SPX 11/13/26 P5969 11/26 5969.34 PUT / / DE (999999999) | 2,93 | 5,8293 | 5,8293 | ||||||
| SPX 11/13/26 C6000 11/26 6000.01 CAL / / DE (999999999) | 2,08 | 4,1386 | 4,1386 | ||||||
| META / Meta Platforms, Inc. | 0,00 | -12,78 | 1,20 | 11,70 | 2,3983 | 0,3146 | |||
| BKNG / Booking Holdings Inc. | 0,00 | -13,73 | 1,16 | 8,39 | 2,3182 | 0,2431 | |||
| MSFT / Microsoft Corporation | 0,00 | -7,70 | 1,15 | 22,33 | 2,2822 | 0,4715 | |||
| JPM / JPMorgan Chase & Co. | 0,00 | -11,41 | 1,13 | 4,73 | 2,2519 | 0,1649 | |||
| EBAY / eBay Inc. | 0,02 | -11,92 | 1,12 | -3,20 | 2,2342 | -0,0048 | |||
| BK / The Bank of New York Mellon Corporation | 0,01 | -14,41 | 1,09 | -7,05 | 2,1805 | -0,0952 | |||
| UNM / Unum Group | 0,01 | -14,68 | 1,09 | -15,42 | 2,1645 | -0,3185 | |||
| AXP / American Express Company | 0,00 | -10,08 | 1,08 | 6,54 | 2,1435 | 0,1924 | |||
| EA / Electronic Arts Inc. | 0,01 | -7,18 | 1,07 | 2,60 | 2,1218 | 0,1144 | |||
| V / Visa Inc. | 0,00 | -11,80 | 1,06 | -10,69 | 2,1150 | -0,1819 | |||
| BLK / BlackRock, Inc. | 0,00 | -10,90 | 1,05 | -1,22 | 2,1008 | 0,0368 | |||
| AMAT / Applied Materials, Inc. | 0,01 | 1,70 | 1,05 | 28,27 | 2,0895 | 0,5091 | |||
| EWBC / East West Bancorp, Inc. | 0,01 | -10,32 | 1,04 | 0,87 | 2,0796 | 0,0795 | |||
| RJF / Raymond James Financial, Inc. | 0,01 | 22,99 | 1,02 | 35,81 | 2,0414 | 0,5826 | |||
| GOOGL / Alphabet Inc. | 0,01 | 22,61 | 1,02 | 39,64 | 2,0297 | 0,6201 | |||
| TRV / The Travelers Companies, Inc. | 0,00 | 20,56 | 1,02 | 21,94 | 2,0281 | 0,4145 | |||
| HIG / The Hartford Insurance Group, Inc. | 0,01 | -10,49 | 1,02 | -8,23 | 2,0238 | -0,1159 | |||
| MLI / Mueller Industries, Inc. | 0,01 | -12,01 | 0,99 | -8,22 | 1,9819 | -0,1122 | |||
| ADP / Automatic Data Processing, Inc. | 0,00 | -11,84 | 0,99 | -11,02 | 1,9630 | -0,1776 | |||
| CB / Chubb Limited | 0,00 | -7,49 | 0,98 | -11,26 | 1,9474 | -0,1818 | |||
| KLAC / KLA Corporation | 0,00 | 32,75 | 0,95 | 75,05 | 1,8880 | 0,8406 | |||
| CTSH / Cognizant Technology Solutions Corporation | 0,01 | -10,10 | 0,94 | -8,37 | 1,8787 | -0,1093 | |||
| CRM / Salesforce, Inc. | 0,00 | 26,28 | 0,93 | 28,30 | 1,8612 | 0,4537 | |||
| SNA / Snap-on Incorporated | 0,00 | -9,14 | 0,93 | -16,18 | 1,8487 | -0,2896 | |||
| PCAR / PACCAR Inc | 0,01 | -2,06 | 0,90 | -4,47 | 1,7910 | -0,0267 | |||
| PHM / PulteGroup, Inc. | 0,01 | -0,66 | 0,89 | 1,82 | 1,7829 | 0,0853 | |||
| ELV / Elevance Health, Inc. | 0,00 | 2,32 | 0,89 | -8,53 | 1,7745 | -0,1074 | |||
| NVDA / NVIDIA Corporation | 0,01 | 36,24 | 0,88 | 98,65 | 1,7585 | 0,8993 | |||
| ACN / Accenture plc | 0,00 | -8,09 | 0,85 | -12,00 | 1,6971 | -0,1736 | |||
| ROST / Ross Stores, Inc. | 0,01 | 25,15 | 0,85 | 25,00 | 1,6935 | 0,3782 | |||
| PAYC / Paycom Software, Inc. | 0,00 | -6,94 | 0,85 | -1,40 | 1,6863 | 0,0260 | |||
| SYF / Synchrony Financial | 0,01 | -33,93 | 0,83 | -16,70 | 1,6604 | -0,2740 | |||
| LEN / Lennar Corporation | 0,01 | 5,99 | 0,78 | 2,09 | 1,5555 | 0,0777 | |||
| QCOM / QUALCOMM Incorporated | 0,00 | 5,10 | 0,77 | 8,94 | 1,5306 | 0,1675 | |||
| AFL / Aflac Incorporated | 0,01 | -32,38 | 0,70 | -35,91 | 1,3879 | -0,7122 | |||
| WSM / Williams-Sonoma, Inc. | 0,00 | 43,11 | 0,69 | 47,75 | 1,3764 | 0,4732 | |||
| BKR / Baker Hughes Company | 0,02 | 46,09 | 0,68 | 27,29 | 1,3586 | 0,3241 | |||
| ODFL / Old Dominion Freight Line, Inc. | 0,00 | 46,43 | 0,66 | 43,72 | 1,3247 | 0,4298 | |||
| AAPL / Apple Inc. | 0,00 | -32,25 | 0,64 | -37,45 | 1,2728 | -0,7008 | |||
| CSCO / Cisco Systems, Inc. | 0,01 | -39,45 | 0,62 | -31,94 | 1,2368 | -0,5262 | |||
| DHI / D.R. Horton, Inc. | 0,00 | -29,62 | 0,60 | -28,69 | 1,2048 | -0,4333 | |||
| LRCX / Lam Research Corporation | 0,01 | 79,20 | 0,60 | 140,56 | 1,1948 | 0,7116 | |||
| MPWR / Monolithic Power Systems, Inc. | 0,00 | 76,62 | 0,56 | 123,20 | 1,1118 | 0,6274 | |||
| GE / General Electric Company | 0,00 | 69,33 | 0,56 | 117,65 | 1,1071 | 0,6137 | |||
| STT / State Street Corporation | 0,00 | 86,50 | 0,53 | 121,43 | 1,0506 | 0,5904 | |||
| CF / CF Industries Holdings, Inc. | 0,01 | -37,73 | 0,52 | -26,72 | 1,0389 | -0,3363 | |||
| AMP / Ameriprise Financial, Inc. | 0,00 | -39,17 | 0,52 | -32,94 | 1,0272 | -0,4591 | |||
| MTB / M&T Bank Corporation | 0,00 | -40,28 | 0,51 | -35,23 | 1,0199 | -0,5072 | |||
| PNC / The PNC Financial Services Group, Inc. | 0,00 | 93,09 | 0,49 | 104,98 | 0,9860 | 0,5188 | |||
| COST / Costco Wholesale Corporation | 0,00 | -6,94 | 0,49 | -2,58 | 0,9782 | 0,0037 | |||
| ABT / Abbott Laboratories | 0,00 | 86,77 | 0,49 | 91,70 | 0,9676 | 0,4773 | |||
| XOM / Exxon Mobil Corporation | 0,00 | -36,21 | 0,45 | -42,25 | 0,8917 | -0,6049 | |||
| EOG / EOG Resources, Inc. | 0,00 | -37,13 | 0,45 | -41,39 | 0,8900 | -0,5829 | |||
| EG / Everest Group, Ltd. | 0,00 | -36,05 | 0,43 | -40,25 | 0,8504 | -0,5291 | |||
| CSL / Carlisle Companies Incorporated | 0,00 | -6,86 | 0,42 | 2,22 | 0,8280 | 0,0413 | |||
| SPX 11/13/26 P5000 11/26 5000.01 PUT / / DE (999999999) | 0,38 | 0,7551 | 0,7551 | ||||||
| NTRS / Northern Trust Corporation | 0,00 | -6,95 | 0,29 | 19,26 | 0,5815 | 0,1096 | |||
| US21871X1090 / Corebridge Financial, Inc. | 0,01 | -52,72 | 0,28 | -46,97 | 0,5594 | -0,4617 | |||
| MA / Mastercard Incorporated | 0,00 | -6,98 | 0,27 | -4,61 | 0,5374 | -0,0094 | |||
| GEV / GE Vernova Inc. | 0,00 | 0,27 | 0,5334 | 0,5334 | |||||
| MTG / MGIC Investment Corporation | 0,01 | -79,49 | 0,25 | -75,98 | 0,5017 | -1,4986 | |||
| EQH / Equitable Holdings, Inc. | 0,00 | -6,94 | 0,25 | 0,40 | 0,4988 | 0,0158 | |||
| DOV / Dover Corporation | 0,00 | 0,25 | 0,4913 | 0,4913 | |||||
| ACM / AECOM | 0,00 | 0,25 | 0,4897 | 0,4897 | |||||
| MCK / McKesson Corporation | 0,00 | -21,14 | 0,24 | -14,13 | 0,4847 | -0,0631 | |||
| SLM / SLM Corporation | 0,01 | 0,24 | 0,4828 | 0,4828 | |||||
| CINF / Cincinnati Financial Corporation | 0,00 | -6,97 | 0,24 | -6,30 | 0,4750 | -0,0165 | |||
| JNJ / Johnson & Johnson | 0,00 | 0,24 | 0,4689 | 0,4689 | |||||
| JXN / Jackson Financial Inc. | 0,00 | -6,91 | 0,23 | -1,29 | 0,4597 | 0,0075 | |||
| WTFC / Wintrust Financial Corporation | 0,00 | -6,97 | 0,23 | 2,23 | 0,4579 | 0,0246 | |||
| ALL / The Allstate Corporation | 0,00 | 0,23 | 0,4572 | 0,4572 | |||||
| PGR / The Progressive Corporation | 0,00 | 0,22 | 0,4461 | 0,4461 | |||||
| LNC / Lincoln National Corporation | 0,01 | -6,95 | 0,22 | -10,33 | 0,4339 | -0,0357 | |||
| ADM / Archer-Daniels-Midland Company | 0,00 | -51,86 | 0,20 | -47,12 | 0,4031 | -0,3360 | |||
| NUE / Nucor Corporation | 0,00 | -49,97 | 0,20 | -46,22 | 0,3972 | -0,3185 | |||
| NKE / NIKE, Inc. | 0,00 | -49,36 | 0,20 | -43,30 | 0,3971 | -0,2829 | |||
| FANG / Diamondback Energy, Inc. | 0,00 | -6,91 | 0,16 | -20,00 | 0,3282 | -0,0699 | |||
| XSP 11/13/26 P596.93 11/26 596.93 PUT / / DE (999999999) | 0,05 | 0,1068 | 0,1068 | ||||||
| BAC / Bank of America Corporation | 0,00 | -100,00 | 0,00 | -100,00 | -0,4843 | ||||
| SPX 07/03/25 C6175 07/25 6175.0 CAL / / DE (999999999) | -0,25 | -0,5078 | -0,5078 | ||||||
| SPX 11/13/26 P6000 11/26 6000.01 PUT / / DE (999999999) | -0,87 | -1,7345 | -1,7345 | ||||||
| SPX 11/13/26 C5000 11/26 5000.01 CAL / / DE (999999999) | -4,14 | -8,2558 | -8,2558 |