Grundlæggende statistik
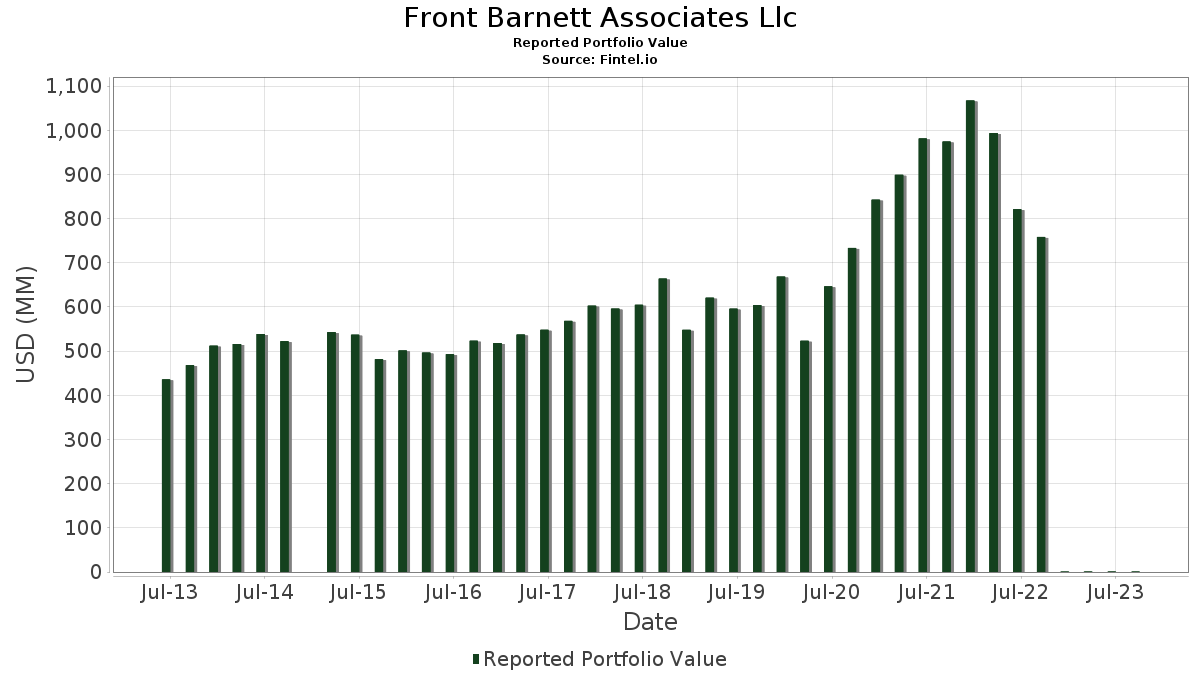
| Porteføljeværdi | $ 833.326 |
| Nuværende stillinger | 112 |
Seneste beholdninger, ydeevne, AUM (fra 13F, 13D)
Front Barnett Associates Llc har afsløret 112 samlede besiddelser i deres seneste SEC-arkivering. Den seneste porteføljeværdi er beregnet til at være $ 833.326 USD. Faktiske aktiver under forvaltning (AUM) er denne værdi plus kontanter (som ikke er oplyst). Front Barnett Associates Llcs største beholdninger er Apple Inc. (US:AAPL) , Alphabet Inc. (US:GOOGL) , Thermo Fisher Scientific Inc. (US:TMO) , Lowe's Companies, Inc. (US:LOW) , and Alphabet Inc. (US:GOOGL) .
Top øger dette kvartal
Vi bruger ændringen i porteføljeallokeringen, fordi dette er den mest meningsfulde metrik. Ændringer kan skyldes handler eller ændringer i aktiekurser.
| Sikkerhed | Aktier (MM) |
Værdi (MM$) |
Portefølje % | ΔPortefølje % |
|---|---|---|---|---|
| 0,34 | 0,04 | 5,3789 | 0,6075 | |
| 0,19 | 0,03 | 3,1665 | 0,4844 | |
| 0,22 | 0,03 | 3,4786 | 0,3875 | |
| 0,09 | 0,02 | 2,9135 | 0,3706 | |
| 0,15 | 0,03 | 3,1150 | 0,3134 | |
| 0,11 | 0,01 | 1,5681 | 0,2861 | |
| 0,09 | 0,02 | 2,7973 | 0,2621 | |
| 0,04 | 0,02 | 2,6193 | 0,2286 | |
| 0,13 | 0,03 | 3,0585 | 0,1073 | |
| 0,09 | 0,03 | 3,1674 | 0,0946 |
Top falder i dette kvartal
Vi bruger ændringen i porteføljeallokeringen, fordi dette er den mest meningsfulde metrik. Ændringer kan skyldes handler eller ændringer i aktiekurser.
| Sikkerhed | Aktier (MM) |
Værdi (MM$) |
Portefølje % | ΔPortefølje % |
|---|---|---|---|---|
| 0,65 | 0,11 | 13,4098 | -1,3445 | |
| 0,20 | 0,01 | 1,7341 | -0,5280 | |
| 0,15 | 0,02 | 2,2152 | -0,2281 | |
| 0,04 | 0,01 | 0,7218 | -0,2029 | |
| 0,17 | 0,03 | 4,1476 | -0,2007 | |
| 0,06 | 0,00 | 0,3290 | -0,1580 | |
| 0,12 | 0,02 | 2,5149 | -0,1323 | |
| 0,00 | 0,00 | 0,0414 | -0,1209 | |
| 0,07 | 0,02 | 2,6745 | -0,1025 | |
| 0,13 | 0,01 | 1,2240 | -0,0933 |
13F og Fondsarkivering
Denne formular blev indsendt den 2023-11-13 for rapporteringsperioden 2023-09-30. Klik på linkikonet for at se den fulde transaktionshistorik.
Opgrader for at låse op for premium-data og eksportere til Excel ![]() .
.
| Sikkerhed | Type | Gennemsnitlig aktiekurs | Aktier (MM) |
Δ Aktier (%) |
Δ Aktier (%) |
Værdi ($MM) |
Portefølje (%) |
ΔPortefølje (%) |
|
|---|---|---|---|---|---|---|---|---|---|
| AAPL / Apple Inc. | 0,65 | -3,17 | 0,11 | -14,62 | 13,4098 | -1,3445 | |||
| GOOGL / Alphabet Inc. | 0,34 | -3,03 | 0,04 | 4,76 | 5,3789 | 0,6075 | |||
| TMO / Thermo Fisher Scientific Inc. | 0,09 | -2,55 | 0,04 | -4,44 | 5,2088 | 0,0278 | |||
| LOW / Lowe's Companies, Inc. | 0,17 | -2,59 | 0,03 | -10,53 | 4,1476 | -0,2007 | |||
| GOOGL / Alphabet Inc. | 0,22 | -2,91 | 0,03 | 3,70 | 3,4786 | 0,3875 | |||
| AMZN / Amazon.com, Inc. | 0,23 | -2,65 | 0,03 | -6,67 | 3,4353 | 0,0322 | |||
| JPM / JPMorgan Chase & Co. | 0,19 | -3,25 | 0,03 | -3,57 | 3,2430 | 0,0819 | |||
| ACN / Accenture plc | 0,09 | -2,61 | 0,03 | -3,70 | 3,1674 | 0,0946 | |||
| J / Jacobs Solutions Inc. | 0,19 | -3,30 | 0,03 | 13,04 | 3,1665 | 0,4844 | |||
| CVX / Chevron Corporation | 0,15 | -2,43 | 0,03 | 4,17 | 3,1150 | 0,3134 | |||
| UNP / Union Pacific Corporation | 0,13 | -2,07 | 0,03 | -3,85 | 3,0585 | 0,1073 | |||
| CAT / Caterpillar Inc. | 0,09 | -2,89 | 0,02 | 9,09 | 2,9135 | 0,3706 | |||
| FDX / FedEx Corporation | 0,09 | -2,91 | 0,02 | 4,55 | 2,7973 | 0,2621 | |||
| LINN / Linde Plc | 0,06 | -2,68 | 0,02 | -4,17 | 2,7641 | 0,0306 | |||
| MSFT / Microsoft Corporation | 0,07 | -2,32 | 0,02 | -8,33 | 2,6745 | -0,1025 | |||
| UNH / UnitedHealth Group Incorporated | 0,04 | -1,78 | 0,02 | 0,00 | 2,6193 | 0,2286 | |||
| PEP / PepsiCo, Inc. | 0,12 | -2,34 | 0,02 | -13,04 | 2,5149 | -0,1323 | |||
| TEL / TE Connectivity plc | 0,15 | -3,26 | 0,02 | -14,29 | 2,2152 | -0,2281 | |||
| CRM / Salesforce, Inc. | 0,09 | -2,77 | 0,02 | -10,53 | 2,1316 | -0,0164 | |||
| IJR / iShares Trust - iShares Core S&P Small-Cap ETF | 0,18 | -0,33 | 0,02 | -5,56 | 2,0844 | 0,0069 | |||
| RTX / RTX Corporation | 0,20 | -1,88 | 0,01 | -30,00 | 1,7341 | -0,5280 | |||
| EEM / iShares, Inc. - iShares MSCI Emerging Markets ETF | 0,36 | -2,38 | 0,01 | -7,14 | 1,6611 | -0,0068 | |||
| C.WSA / Citigroup, Inc. | 0,02 | -1,88 | 0,01 | -7,14 | 1,6217 | -0,0400 | |||
| GPN / Global Payments Inc. | 0,11 | -1,79 | 0,01 | 18,18 | 1,5681 | 0,2861 | |||
| BAC / Bank of America Corporation | 0,47 | -1,77 | 0,01 | -7,69 | 1,5585 | -0,0049 | |||
| DIS / The Walt Disney Company | 0,14 | 2,90 | 0,01 | -8,33 | 1,3925 | -0,0093 | |||
| MDT / Medtronic plc | 0,13 | -1,76 | 0,01 | -9,09 | 1,2240 | -0,0933 | |||
| IVW / iShares Trust - iShares S&P 500 Growth ETF | 0,13 | -1,40 | 0,01 | 0,00 | 1,1036 | 0,0193 | |||
| IVE / iShares Trust - iShares S&P 500 Value ETF | 0,06 | 4,81 | 0,01 | 0,00 | 1,0846 | 0,0649 | |||
| EFA / iShares Trust - iShares MSCI EAFE ETF | 0,11 | -3,52 | 0,01 | -12,50 | 0,9127 | -0,0231 | |||
| HLT / Hilton Worldwide Holdings Inc. | 0,05 | 0,64 | 0,01 | 16,67 | 0,8718 | 0,0823 | |||
| EL / The Estée Lauder Companies Inc. | 0,04 | -0,27 | 0,01 | -25,00 | 0,7218 | -0,2029 | |||
| QQQ / Invesco QQQ Trust, Series 1 | 0,02 | 0,00 | 0,01 | 0,00 | 0,6623 | 0,0201 | |||
| SPY / SPDR S&P 500 ETF | 0,01 | -0,75 | 0,01 | 0,00 | 0,6056 | 0,0106 | |||
| BRK.B / Berkshire Hathaway Inc. | 0,01 | 0,00 | 0,00 | 0,00 | 0,5516 | 0,0466 | |||
| IJH / iShares Trust - iShares Core S&P Mid-Cap ETF | 0,02 | -3,67 | 0,00 | -25,00 | 0,4771 | -0,0113 | |||
| IWM / iShares Trust - iShares Russell 2000 ETF | 0,02 | -0,35 | 0,00 | 0,00 | 0,4482 | -0,0000 | |||
| ITW / Illinois Tool Works Inc. | 0,01 | -2,80 | 0,00 | 0,00 | 0,4073 | -0,0206 | |||
| IEMG / iShares, Inc. - iShares Core MSCI Emerging Markets ETF | 0,07 | -0,51 | 0,00 | 0,00 | 0,3913 | 0,0082 | |||
| AXP / American Express Company | 0,02 | -0,23 | 0,00 | 0,00 | 0,3856 | -0,0387 | |||
| IEFA / iShares Trust - iShares Core MSCI EAFE ETF | 0,05 | -3,04 | 0,00 | -33,33 | 0,3514 | -0,0060 | |||
| QLD / ProShares Trust - ProShares Ultra QQQ | 0,05 | 0,00 | 0,00 | -33,33 | 0,3397 | -0,0068 | |||
| VUSB / Vanguard Bond Index Funds - Vanguard Ultra-Short Bond ETF | 0,06 | -36,50 | 0,00 | -50,00 | 0,3290 | -0,1580 | |||
| HD / The Home Depot, Inc. | 0,01 | -0,36 | 0,00 | 0,00 | 0,3290 | 0,0098 | |||
| SYK / Stryker Corporation | 0,01 | 0,00 | 0,00 | -50,00 | 0,2345 | -0,0116 | |||
| XOM / Exxon Mobil Corporation | 0,02 | 0,00 | 0,00 | 0,00 | 0,2335 | 0,0332 | |||
| DHR / Danaher Corporation | 0,01 | -5,15 | 0,00 | 0,00 | 0,2165 | 0,0088 | |||
| PG / The Procter & Gamble Company | 0,01 | 0,00 | 0,00 | 0,00 | 0,2124 | 0,0046 | |||
| LLY / Eli Lilly and Company | 0,00 | 0,00 | 0,00 | 0,00 | 0,2098 | 0,0374 | |||
| VOO / Vanguard Index Funds - Vanguard S&P 500 ETF | 0,00 | 0,00 | 0,00 | 0,00 | 0,2023 | 0,0051 | |||
| APH / Amphenol Corporation | 0,02 | -20,48 | 0,00 | -50,00 | 0,1916 | -0,0377 | |||
| IGSB / iShares Trust - iShares 1-5 Year Investment Grade Corporate Bond ETF | 0,03 | -32,76 | 0,00 | -50,00 | 0,1800 | -0,0735 | |||
| JNJ / Johnson & Johnson | 0,01 | 0,00 | 0,00 | 0,00 | 0,1710 | 0,0000 | |||
| MCD / McDonald's Corporation | 0,00 | -6,47 | 0,00 | 0,00 | 0,1445 | -0,0201 | |||
| CSCO / Cisco Systems, Inc. | 0,02 | -1,87 | 0,00 | 0,00 | 0,1441 | 0,0112 | |||
| CL / Colgate-Palmolive Company | 0,02 | 0,00 | 0,00 | 0,00 | 0,1416 | -0,0027 | |||
| HON / Honeywell International Inc. | 0,01 | -0,24 | 0,00 | 0,00 | 0,1357 | -0,0079 | |||
| NUE / Nucor Corporation | 0,01 | 0,00 | 0,00 | 0,00 | 0,1343 | 0,0018 | |||
| ADP / Automatic Data Processing, Inc. | 0,00 | 0,00 | 0,00 | 0,1310 | 0,0184 | ||||
| GWW / W.W. Grainger, Inc. | 0,00 | 0,00 | 0,00 | 0,00 | 0,1303 | -0,0094 | |||
| BRK.A / Berkshire Hathaway Inc. | 0,00 | 0,00 | 0,00 | 0,00 | 0,1276 | 0,0107 | |||
| VWO / Vanguard International Equity Index Funds - Vanguard FTSE Emerging Markets ETF | 0,03 | -5,46 | 0,00 | 0,00 | 0,1222 | -0,0039 | |||
| NTRS / Northern Trust Corporation | 0,01 | 0,00 | 0,00 | -100,00 | 0,1144 | -0,0004 | |||
| ABBV / AbbVie Inc. | 0,01 | -7,47 | 0,00 | 0,1144 | 0,0093 | ||||
| BA / The Boeing Company | 0,00 | -0,68 | 0,00 | -100,00 | 0,1114 | -0,0048 | |||
| IWF / iShares Trust - iShares Russell 1000 Growth ETF | 0,00 | -0,15 | 0,00 | 0,1087 | 0,0029 | ||||
| IWD / iShares Trust - iShares Russell 1000 Value ETF | 0,01 | -0,09 | 0,00 | 0,1025 | 0,0022 | ||||
| V / Visa Inc. | 0,00 | 0,00 | 0,00 | 0,0894 | 0,0026 | ||||
| HWM / Howmet Aerospace Inc. | 0,02 | -8,19 | 0,00 | 0,0871 | -0,0085 | ||||
| FTV / Fortive Corporation | 0,01 | -11,81 | 0,00 | 0,0864 | -0,0065 | ||||
| ABT / Abbott Laboratories | 0,01 | -6,44 | 0,00 | 0,0863 | -0,0113 | ||||
| PXF / Invesco Exchange-Traded Fund Trust II - Invesco RAFI Developed Markets ex-U.S. ETF | 0,02 | 0,00 | 0,00 | 0,0858 | 0,0025 | ||||
| TDG / TransDigm Group Incorporated | 0,00 | 0,00 | 0,00 | 0,0808 | 0,0002 | ||||
| INTC / Intel Corporation | 0,02 | -1,47 | 0,00 | 0,0786 | 0,0081 | ||||
| AMP / Ameriprise Financial, Inc. | 0,00 | 0,00 | 0,00 | 0,0697 | 0,0037 | ||||
| ALL / The Allstate Corporation | 0,01 | 0,00 | 0,00 | 0,0685 | 0,0054 | ||||
| ADSK / Autodesk, Inc. | 0,00 | 0,00 | 0,00 | 0,0636 | 0,0045 | ||||
| KO / The Coca-Cola Company | 0,01 | 0,00 | 0,00 | 0,0628 | -0,0008 | ||||
| AMT / American Tower Corporation | 0,00 | -31,37 | 0,00 | 0,0605 | -0,0372 | ||||
| SYY / Sysco Corporation | 0,01 | 0,00 | 0,00 | 0,0596 | -0,0033 | ||||
| NVDA / NVIDIA Corporation | 0,00 | -0,93 | 0,00 | 0,0554 | 0,0043 | ||||
| MDLZ / Mondelez International, Inc. | 0,01 | 0,00 | 0,00 | 0,0546 | 0,0007 | ||||
| WEC / WEC Energy Group, Inc. | 0,01 | 0,00 | 0,00 | 0,0536 | -0,0017 | ||||
| MMS / Maximus, Inc. | 0,01 | 0,00 | 0,00 | 0,0516 | -0,0032 | ||||
| PM / Philip Morris International Inc. | 0,00 | -4,26 | 0,00 | 0,0500 | -0,0018 | ||||
| GE / General Electric Company | 0,00 | 0,00 | 0,00 | 0,0492 | 0,0032 | ||||
| INTU / Intuit Inc. | 0,00 | 0,00 | 0,00 | 0,0472 | 0,0073 | ||||
| COST / Costco Wholesale Corporation | 0,00 | 0,00 | 0,00 | 0,0470 | 0,0049 | ||||
| PFE / Pfizer Inc. | 0,01 | -0,51 | 0,00 | 0,0466 | -0,0022 | ||||
| EMR / Emerson Electric Co. | 0,00 | 0,00 | 0,00 | 0,0455 | 0,0055 | ||||
| WMT / Walmart Inc. | 0,00 | -4,54 | 0,00 | 0,0416 | 0,0014 | ||||
| IBB / iShares Trust - iShares Biotechnology ETF | 0,00 | -75,06 | 0,00 | -100,00 | 0,0414 | -0,1209 | |||
| MO / Altria Group, Inc. | 0,01 | -3,44 | 0,00 | 0,0366 | -0,0018 | ||||
| VCSH / Vanguard Scottsdale Funds - Vanguard Short-Term Corporate Bond ETF | 0,00 | -67,80 | 0,00 | 0,0350 | -0,0680 | ||||
| GTLS / Chart Industries, Inc. | 0,00 | -8,70 | 0,00 | 0,0341 | 0,0009 | ||||
| BK / The Bank of New York Mellon Corporation | 0,01 | 0,00 | 0,00 | 0,0335 | 0,0006 | ||||
| MCK / McKesson Corporation | 0,00 | 0,00 | 0,00 | 0,0332 | 0,0025 | ||||
| EXC / Exelon Corporation | 0,01 | 0,00 | 0,00 | 0,0330 | -0,0004 | ||||
| CME / CME Group Inc. | 0,00 | 0,00 | 0,00 | 0,0320 | 0,0042 | ||||
| ENV / Envestnet, Inc. | 0,01 | 0,00 | 0,00 | 0,0312 | -0,0084 | ||||
| FCX / Freeport-McMoRan Inc. | 0,01 | 0,00 | 0,00 | 0,0310 | -0,0003 | ||||
| CVS / CVS Health Corporation | 0,00 | 0,00 | 0,00 | 0,0304 | 0,0021 | ||||
| ECL / Ecolab Inc. | 0,00 | 0,00 | 0,00 | 0,0289 | -0,0010 | ||||
| FNWD / Finward Bancorp | 0,01 | 0,00 | 0,00 | 0,0283 | 0,0024 | ||||
| STT / State Street Corporation | 0,00 | 0,00 | 0,00 | 0,0274 | -0,0007 | ||||
| MSI / Motorola Solutions, Inc. | 0,00 | 0,00 | 0,00 | 0,0258 | -0,0003 | ||||
| IWR / iShares Trust - iShares Russell Mid-Cap ETF | 0,00 | 0,00 | 0,00 | 0,0252 | 0,0003 | ||||
| LHX / L3Harris Technologies, Inc. | 0,00 | 0,00 | 0,00 | 0,0251 | -0,0014 | ||||
| META / Meta Platforms, Inc. | 0,00 | -4,79 | 0,00 | 0,0251 | 0,0015 | ||||
| FITB / Fifth Third Bancorp | 0,01 | 0,00 | 0,00 | 0,0247 | 0,0007 | ||||
| MRK / Merck & Co., Inc. | 0,00 | 0,00 | 0,00 | 0,0244 | -0,0014 | ||||
| / Cue Health, Inc. | 0,03 | 0,00 | 0,00 | 0,0013 | 0,0003 | ||||
| HSY / The Hershey Company | 0,00 | -100,00 | 0,00 | 0,0000 | -0,0241 | ||||
| XLF / The Select Sector SPDR Trust - The Financial Select Sector SPDR Fund | 0,00 | -100,00 | 0,00 | 0,0000 | -0,0234 | ||||
| IVV / iShares Trust - iShares Core S&P 500 ETF | 0,00 | -100,00 | 0,00 | 0,0000 | -0,0249 | ||||
| FBIN / Fortune Brands Innovations, Inc. | 0,00 | -100,00 | 0,00 | 0,0000 | -0,0260 | ||||
| TIREX / TIAA-CREF Funds - TIAA-CREF Real Estate Securities Fund Institutional Class | 0,50 | 0,00 | 0,00 | 0,0000 | 0,0000 | ||||
| CSX / CSX Corporation | 0,00 | -100,00 | 0,00 | 0,0000 | -0,0247 | ||||
| PWR / Quanta Services, Inc. | 0,00 | -100,00 | 0,00 | 0,0000 | -0,0235 | ||||
| XPRO / Expro Group Holdings N.V. | 0,00 | -100,00 | 0,00 | 0,0000 | -0,0248 |