Grundlæggende statistik
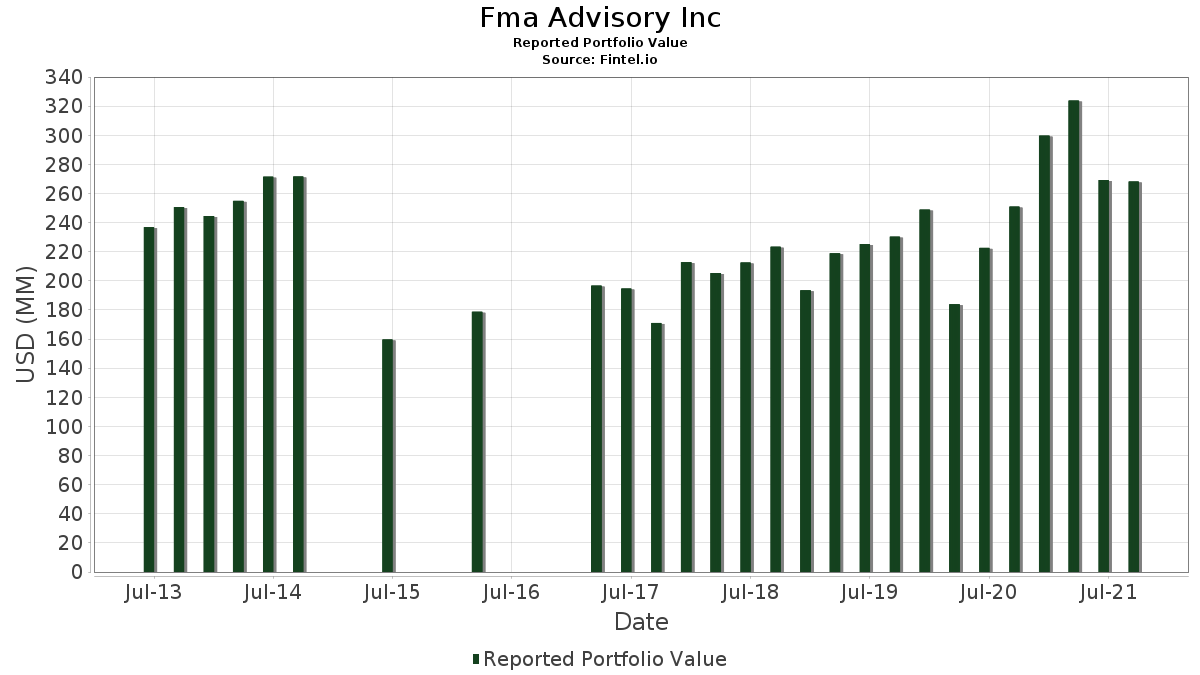
| Porteføljeværdi | $ 268.263.000 |
| Nuværende stillinger | 135 |
Seneste beholdninger, ydeevne, AUM (fra 13F, 13D)
Fma Advisory Inc har afsløret 135 samlede besiddelser i deres seneste SEC-arkivering. Den seneste porteføljeværdi er beregnet til at være $ 268.263.000 USD. Faktiske aktiver under forvaltning (AUM) er denne værdi plus kontanter (som ikke er oplyst). Fma Advisory Incs største beholdninger er Invesco QQQ Trust, Series 1 (US:QQQ) , F.N.B. Corporation (US:FNB) , Thermo Fisher Scientific Inc. (US:TMO) , PepsiCo, Inc. (US:PEP) , and NextEra Energy Capital Holdings, Inc. - Corporate Bond/Note (US:NEE.PRN) . Fma Advisory Incs nye stillinger omfatter ASML Holding N.V. (US:ASMLF) , Applied Materials, Inc. (US:AMAT) , Ball Corp. (US:BLL) , The Boston Beer Company, Inc. (US:SAM) , and FlexShares Trust - FlexShares iBoxx 3-Year Target Duration TIPS Index Fund (US:TDTT) .
Top øger dette kvartal
Vi bruger ændringen i porteføljeallokeringen, fordi dette er den mest meningsfulde metrik. Ændringer kan skyldes handler eller ændringer i aktiekurser.
| Sikkerhed | Aktier (MM) |
Værdi (MM$) |
Portefølje % | ΔPortefølje % |
|---|---|---|---|---|
| 0,03 | 2,85 | 1,0609 | 1,0609 | |
| 0,01 | 2,49 | 0,9289 | 0,9289 | |
| 0,01 | 5,45 | 2,0323 | 0,4362 | |
| 0,02 | 8,71 | 3,2453 | 0,3751 | |
| 0,00 | 0,80 | 0,2997 | 0,2997 | |
| 0,01 | 0,72 | 0,2691 | 0,2691 | |
| 0,01 | 3,88 | 1,4471 | 0,1651 | |
| 0,01 | 1,05 | 0,3914 | 0,1641 | |
| 0,01 | 0,42 | 0,1562 | 0,1562 | |
| 0,01 | 0,38 | 0,1424 | 0,1424 |
Top falder i dette kvartal
Vi bruger ændringen i porteføljeallokeringen, fordi dette er den mest meningsfulde metrik. Ændringer kan skyldes handler eller ændringer i aktiekurser.
| Sikkerhed | Aktier (MM) |
Værdi (MM$) |
Portefølje % | ΔPortefølje % |
|---|---|---|---|---|
| 0,79 | 9,13 | 3,4037 | -1,5476 | |
| 0,00 | 0,00 | -0,5704 | ||
| 0,08 | 2,07 | 0,7720 | -0,3569 | |
| 0,03 | 1,75 | 0,6509 | -0,2393 | |
| 0,04 | 3,56 | 1,3259 | -0,2241 | |
| 0,01 | 1,89 | 0,7057 | -0,1975 | |
| 0,00 | 0,00 | -0,1972 | ||
| 0,01 | 1,99 | 0,7399 | -0,1899 | |
| 0,01 | 1,72 | 0,6427 | -0,1814 | |
| 0,01 | 2,25 | 0,8380 | -0,1580 |
13F og Fondsarkivering
Denne formular blev indsendt den 2021-11-15 for rapporteringsperioden 2021-09-30. Klik på linkikonet for at se den fulde transaktionshistorik.
Opgrader for at låse op for premium-data og eksportere til Excel ![]() .
.
| Sikkerhed | Type | Gennemsnitlig aktiekurs | Aktier (MM) |
Δ Aktier (%) |
Δ Aktier (%) |
Værdi ($MM) |
Portefølje (%) |
ΔPortefølje (%) |
|
|---|---|---|---|---|---|---|---|---|---|
| QQQ / Invesco QQQ Trust, Series 1 | 0,03 | -1,72 | 12,27 | -0,74 | 4,5731 | -0,0169 | |||
| FNB / F.N.B. Corporation | 0,79 | -27,33 | 9,13 | -31,52 | 3,4037 | -1,5476 | |||
| TMO / Thermo Fisher Scientific Inc. | 0,02 | -0,54 | 8,71 | 12,64 | 3,2453 | 0,3751 | |||
| PEP / PepsiCo, Inc. | 0,05 | 3,48 | 7,09 | 5,05 | 2,6448 | 0,1366 | |||
| NEE.PRN / NextEra Energy Capital Holdings, Inc. - Corporate Bond/Note | 0,08 | -3,18 | 6,46 | 3,74 | 2,4088 | 0,0956 | |||
| AAPL / Apple Inc. | 0,04 | 1,52 | 5,86 | 4,89 | 2,1829 | 0,1096 | |||
| BAC / Bank of America Corporation | 0,14 | -0,25 | 5,81 | 2,71 | 2,1643 | 0,0650 | |||
| AMJ / JPMorgan Alerian MLP Index ETN - Corporate Bond/Note | 0,03 | -1,47 | 5,64 | 3,67 | 2,1035 | 0,0822 | |||
| MA / Mastercard Incorporated | 0,02 | -1,01 | 5,60 | -5,72 | 2,0886 | -0,1184 | |||
| HON / Honeywell International Inc. | 0,03 | 1,72 | 5,50 | -1,56 | 2,0506 | -0,0246 | |||
| PANW / Palo Alto Networks, Inc. | 0,01 | -1,73 | 5,45 | 26,85 | 2,0323 | 0,4362 | |||
| AEP / American Electric Power Company, Inc. | 0,07 | 0,55 | 5,40 | -3,52 | 2,0129 | -0,0656 | |||
| V / Visa Inc. | 0,02 | -2,41 | 5,36 | -7,02 | 1,9995 | -0,1429 | |||
| DIS / The Walt Disney Company | 0,03 | -0,38 | 5,09 | -4,13 | 1,8966 | -0,0742 | |||
| LAMR / Lamar Advertising Company | 0,04 | -0,85 | 4,87 | 7,74 | 1,8169 | 0,1368 | |||
| XLK / The Select Sector SPDR Trust - The Technology Select Sector SPDR Fund | 0,03 | -1,63 | 4,79 | -0,52 | 1,7848 | -0,0025 | |||
| TROW / T. Rowe Price Group, Inc. | 0,02 | 0,74 | 4,27 | 0,09 | 1,5917 | 0,0075 | |||
| FDIS / Fidelity Covington Trust - Fidelity MSCI Consumer Discretionary Index ETF | 0,05 | -5,11 | 4,24 | -6,07 | 1,5805 | -0,0958 | |||
| CVS / CVS Health Corporation | 0,05 | -3,58 | 4,18 | -1,92 | 1,5582 | -0,0246 | |||
| MSFT / Microsoft Corporation | 0,01 | 8,06 | 3,88 | 12,46 | 1,4471 | 0,1651 | |||
| VZ / Verizon Communications Inc. | 0,07 | -2,63 | 3,87 | -6,13 | 1,4441 | -0,0885 | |||
| MS / Morgan Stanley | 0,04 | -4,36 | 3,62 | 1,52 | 1,3487 | 0,0251 | |||
| CVX / Chevron Corporation | 0,04 | -12,01 | 3,56 | -14,78 | 1,3259 | -0,2241 | |||
| GSEW / Goldman Sachs ETF Trust - Goldman Sachs Equal Weight U.S. Large Cap Equity ETF | 0,05 | -6,47 | 3,43 | -6,97 | 1,2779 | -0,0906 | |||
| KMB / Kimberly-Clark Corporation | 0,02 | -0,22 | 3,15 | -1,22 | 1,1735 | -0,0101 | |||
| IHF / iShares Trust - iShares U.S. Healthcare Providers ETF | 0,01 | -0,29 | 3,14 | -4,30 | 1,1701 | -0,0479 | |||
| MMP / Magellan Midstream Partners L.P. | 0,06 | 0,32 | 2,93 | -6,51 | 1,0926 | -0,0716 | |||
| QCOM / QUALCOMM Incorporated | 0,02 | 2,39 | 2,86 | -7,59 | 1,0661 | -0,0832 | |||
| RTX / RTX Corporation | 0,03 | 2,85 | 1,0609 | 1,0609 | |||||
| TEL / TE Connectivity plc | 0,02 | -2,33 | 2,79 | -0,85 | 1,0397 | -0,0050 | |||
| PNC / The PNC Financial Services Group, Inc. | 0,01 | -0,77 | 2,75 | 1,77 | 1,0270 | 0,0217 | |||
| WELL / Welltower Inc. | 0,03 | 1,88 | 2,75 | 0,99 | 1,0236 | 0,0139 | |||
| JNJ / Johnson & Johnson | 0,02 | 3,46 | 2,74 | 1,45 | 1,0199 | 0,0183 | |||
| PFE / Pfizer Inc. | 0,06 | 4,28 | 2,71 | 14,51 | 1,0091 | 0,1312 | |||
| STLD / Steel Dynamics, Inc. | 0,04 | -1,03 | 2,61 | -2,90 | 0,9722 | -0,0253 | |||
| ADP / Automatic Data Processing, Inc. | 0,01 | 1,40 | 2,55 | 2,08 | 0,9513 | 0,0229 | |||
| LMT / Lockheed Martin Corporation | 0,01 | 4,48 | 2,52 | -4,69 | 0,9386 | -0,0425 | |||
| CI / The Cigna Group | 0,01 | 2,49 | 0,9289 | 0,9289 | |||||
| ABBV / AbbVie Inc. | 0,02 | -1,98 | 2,35 | -6,12 | 0,8753 | -0,0535 | |||
| LOW / Lowe's Companies, Inc. | 0,01 | -1,50 | 2,34 | 3,04 | 0,8719 | 0,0289 | |||
| CMI / Cummins Inc. | 0,01 | -9,00 | 2,25 | -16,18 | 0,8380 | -0,1580 | |||
| FCOM / Fidelity Covington Trust - Fidelity MSCI Communication Services Index ETF | 0,04 | 0,06 | 2,23 | -1,93 | 0,8331 | -0,0132 | |||
| RQI / Cohen & Steers Quality Income Realty Fund, Inc. | 0,15 | -4,15 | 2,19 | -9,09 | 0,8164 | -0,0782 | |||
| MRK / Merck & Co., Inc. | 0,03 | -14,18 | 2,08 | -17,11 | 0,7746 | -0,1564 | |||
| T / AT&T Inc. | 0,08 | -27,42 | 2,07 | -31,87 | 0,7720 | -0,3569 | |||
| META / Meta Platforms, Inc. | 0,01 | 5,29 | 2,06 | 2,74 | 0,7675 | 0,0233 | |||
| AVGO / Broadcom Inc. | 0,00 | 0,07 | 2,02 | 1,81 | 0,7545 | 0,0162 | |||
| SWKS / Skyworks Solutions, Inc. | 0,01 | -7,77 | 1,99 | -20,73 | 0,7399 | -0,1899 | |||
| AMZN / Amazon.com, Inc. | 0,00 | 23,48 | 1,94 | 17,92 | 0,7213 | 0,1119 | |||
| GS.PRJ / Goldman Sachs Group, 5.50% Dep Shares Fixd/Float Non-Cumul Preferred Stock Ser J | 0,01 | 1,28 | 1,92 | 0,84 | 0,7157 | 0,0086 | |||
| FDX / FedEx Corporation | 0,01 | 5,89 | 1,89 | -22,16 | 0,7057 | -0,1975 | |||
| ACN / Accenture plc | 0,01 | 0,12 | 1,89 | 8,70 | 0,7034 | 0,0587 | |||
| MO / Altria Group, Inc. | 0,04 | -1,84 | 1,85 | -6,27 | 0,6907 | -0,0434 | |||
| C / Citigroup Inc. - Corporate Bond/Note | 0,03 | -14,72 | 1,81 | -15,41 | 0,6732 | -0,1196 | |||
| FTEC / Fidelity Covington Trust - Fidelity MSCI Information Technology Index ETF | 0,02 | -3,95 | 1,78 | -3,26 | 0,6639 | -0,0198 | |||
| TT / Trane Technologies plc | 0,01 | 4,68 | 1,77 | -1,88 | 0,6605 | -0,0101 | |||
| VFC / V.F. Corporation | 0,03 | -10,80 | 1,75 | -27,16 | 0,6509 | -0,2393 | |||
| SPG / Simon Property Group, Inc. | 0,01 | -7,12 | 1,73 | -7,45 | 0,6434 | -0,0492 | |||
| STZ / Constellation Brands, Inc. | 0,01 | -13,76 | 1,72 | -22,31 | 0,6427 | -0,1814 | |||
| APD / Air Products and Chemicals, Inc. | 0,01 | -0,53 | 1,53 | -11,44 | 0,5715 | -0,0714 | |||
| PM / Philip Morris International Inc. | 0,02 | -2,38 | 1,50 | -6,67 | 0,5577 | -0,0376 | |||
| ARW / Arrow Electronics, Inc. | 0,01 | 0,58 | 1,44 | -0,76 | 0,5360 | -0,0021 | |||
| GM / General Motors Company | 0,03 | -9,50 | 1,40 | -19,37 | 0,5215 | -0,1228 | |||
| GOOGL / Alphabet Inc. | 0,00 | -4,57 | 1,39 | 1,46 | 0,5189 | 0,0094 | |||
| HD / The Home Depot, Inc. | 0,00 | 7,68 | 1,39 | 10,85 | 0,5181 | 0,0525 | |||
| EPD / Enterprise Products Partners L.P. - Limited Partnership | 0,06 | -6,46 | 1,33 | -16,09 | 0,4976 | -0,0932 | |||
| BMY / Bristol-Myers Squibb Company | 0,02 | -2,65 | 1,32 | -13,77 | 0,4924 | -0,0765 | |||
| CAT / Caterpillar Inc. | 0,01 | -9,88 | 1,28 | -20,52 | 0,4764 | -0,1208 | |||
| PSX / Phillips 66 | 0,02 | -2,48 | 1,27 | -20,41 | 0,4738 | -0,1193 | |||
| CB / Chubb Limited | 0,01 | -2,78 | 1,21 | 6,12 | 0,4522 | 0,0277 | |||
| TGT / Target Corporation | 0,01 | 6,71 | 1,21 | 1,00 | 0,4518 | 0,0062 | |||
| GOOGL / Alphabet Inc. | 0,00 | 12,02 | 1,17 | 22,62 | 0,4365 | 0,0819 | |||
| QRVO / Qorvo, Inc. | 0,01 | 11,90 | 1,16 | -4,39 | 0,4305 | -0,0181 | |||
| PG / The Procter & Gamble Company | 0,01 | 0,23 | 1,15 | 3,88 | 0,4294 | 0,0176 | |||
| TSM / Taiwan Semiconductor Manufacturing Company Limited - Depositary Receipt (Common Stock) | 0,01 | 84,72 | 1,05 | 71,57 | 0,3914 | 0,1641 | |||
| ICE / Intercontinental Exchange, Inc. | 0,01 | 25,49 | 1,04 | 21,45 | 0,3884 | 0,0698 | |||
| SPGI / S&P Global Inc. | 0,00 | 0,08 | 1,03 | 3,52 | 0,3840 | 0,0144 | |||
| ABT / Abbott Laboratories | 0,01 | 13,78 | 0,99 | 15,98 | 0,3679 | 0,0519 | |||
| SBUX / Starbucks Corporation | 0,01 | 18,52 | 0,96 | 16,93 | 0,3579 | 0,0530 | |||
| DHI / D.R. Horton, Inc. | 0,01 | -4,25 | 0,93 | -11,06 | 0,3448 | -0,0414 | |||
| FMAT / Fidelity Covington Trust - Fidelity MSCI Materials Index ETF | 0,02 | -10,79 | 0,90 | -14,50 | 0,3362 | -0,0555 | |||
| FIDU / Fidelity Covington Trust - Fidelity MSCI Industrials Index ETF | 0,02 | -7,49 | 0,89 | -11,49 | 0,3303 | -0,0415 | |||
| PH / Parker-Hannifin Corporation | 0,00 | 0,22 | 0,88 | -8,77 | 0,3295 | -0,0303 | |||
| OLED / Universal Display Corporation | 0,00 | -8,45 | 0,85 | -29,58 | 0,3169 | -0,1314 | |||
| FNCL / Fidelity Covington Trust - Fidelity MSCI Financials Index ETF | 0,02 | -8,35 | 0,83 | -6,02 | 0,3087 | -0,0185 | |||
| AMGN / Amgen Inc. | 0,00 | 40,37 | 0,82 | 22,47 | 0,3068 | 0,0572 | |||
| ASMLF / ASML Holding N.V. | 0,00 | 0,80 | 0,2997 | 0,2997 | |||||
| TSCO / Tractor Supply Company | 0,00 | -7,83 | 0,79 | 0,38 | 0,2934 | 0,0022 | |||
| MAS / Masco Corporation | 0,01 | -5,36 | 0,77 | -10,76 | 0,2874 | -0,0335 | |||
| TRV / The Travelers Companies, Inc. | 0,01 | 0,32 | 0,77 | 1,85 | 0,2874 | 0,0063 | |||
| FUTY / Fidelity Covington Trust - Fidelity MSCI Utilities Index ETF | 0,02 | -0,26 | 0,76 | 0,00 | 0,2814 | 0,0011 | |||
| IYR / iShares Trust - iShares U.S. Real Estate ETF | 0,01 | -1,21 | 0,73 | -0,81 | 0,2732 | -0,0012 | |||
| CMCSA / Comcast Corporation | 0,01 | 0,72 | 0,2691 | 0,2691 | |||||
| NVDA / NVIDIA Corporation | 0,00 | 687,33 | 0,71 | 104,03 | 0,2639 | 0,1351 | |||
| UPS / United Parcel Service, Inc. | 0,00 | 16,23 | 0,68 | 1,79 | 0,2546 | 0,0054 | |||
| RDS.B / Shell Plc - ADR | 0,02 | -28,15 | 0,68 | -18,12 | 0,2527 | -0,0548 | |||
| ALB / Albemarle Corporation | 0,00 | 74,38 | 0,67 | 126,96 | 0,2479 | 0,1391 | |||
| ANTM / Anthem Inc | 0,00 | 0,17 | 0,66 | -2,21 | 0,2475 | -0,0046 | |||
| XLY / The Select Sector SPDR Trust - The Consumer Discretionary Select Sector SPDR Fund | 0,00 | -1,55 | 0,66 | -1,05 | 0,2457 | -0,0017 | |||
| DCUE / Dominion Energy Inc - Units - 2019 Series A | 0,01 | 1,57 | 0,64 | 0,78 | 0,2397 | 0,0028 | |||
| FULT / Fulton Financial Corporation | 0,04 | 0,02 | 0,63 | -3,22 | 0,2356 | -0,0069 | |||
| FHLC / Fidelity Covington Trust - Fidelity MSCI Health Care Index ETF | 0,01 | -5,90 | 0,62 | -5,76 | 0,2319 | -0,0132 | |||
| LIN / Linde plc | 0,00 | 24,56 | 0,60 | 26,42 | 0,2248 | 0,0476 | |||
| ABC / Amerisource Bergen Corp. | 0,00 | 0,16 | 0,53 | 4,56 | 0,1964 | 0,0093 | |||
| MTZ / MasTec, Inc. | 0,01 | -4,74 | 0,52 | -22,47 | 0,1942 | -0,0553 | |||
| DE / Deere & Company | 0,00 | -17,21 | 0,51 | -21,38 | 0,1905 | -0,0509 | |||
| XLP / The Select Sector SPDR Trust - The Consumer Staples Select Sector SPDR Fund | 0,01 | -5,38 | 0,46 | -6,90 | 0,1711 | -0,0120 | |||
| MAR / Marriott International, Inc. | 0,00 | -31,75 | 0,45 | -25,91 | 0,1663 | -0,0573 | |||
| VAC / Marriott Vacations Worldwide Corporation | 0,00 | -7,77 | 0,43 | -8,90 | 0,1603 | -0,0150 | |||
| EMR / Emerson Electric Co. | 0,00 | -9,80 | 0,42 | -11,67 | 0,1581 | -0,0202 | |||
| CHD / Church & Dwight Co., Inc. | 0,01 | 0,42 | 0,1562 | 0,1562 | |||||
| ENBBF / Enbridge Inc - FR PRF PERPETUAL USD 25 - Ser J | 0,01 | 1,83 | 0,41 | 1,22 | 0,1543 | 0,0024 | |||
| FSTA / Fidelity Covington Trust - Fidelity MSCI Consumer Staples Index ETF | 0,01 | -4,05 | 0,40 | -5,87 | 0,1495 | -0,0087 | |||
| XLV / The Select Sector SPDR Trust - The Health Care Select Sector SPDR Fund | 0,00 | 1,77 | 0,40 | 2,86 | 0,1476 | 0,0046 | |||
| ARKF / ARK ETF Trust - ARK Fintech Innovation ETF | 0,01 | 0,38 | 0,1424 | 0,1424 | |||||
| UNH / UnitedHealth Group Incorporated | 0,00 | 0,36 | 0,1335 | 0,1335 | |||||
| ARKK / ARK ETF Trust - ARK Innovation ETF | 0,00 | 0,35 | 0,1301 | 0,1301 | |||||
| AMAT / Applied Materials, Inc. | 0,00 | 0,35 | 0,1297 | 0,1297 | |||||
| CSCO / Cisco Systems, Inc. | 0,01 | 0,34 | 0,1253 | 0,1253 | |||||
| ZBH / Zimmer Biomet Holdings, Inc. | 0,00 | -6,08 | 0,34 | -14,54 | 0,1249 | -0,0207 | |||
| DHR / Danaher Corporation | 0,00 | 11,80 | 0,34 | 26,89 | 0,1249 | 0,0268 | |||
| BLL / Ball Corp. | 0,00 | 0,33 | 0,1226 | 0,1226 | |||||
| MCD / McDonald's Corporation | 0,00 | 0,53 | 0,32 | 4,61 | 0,1185 | 0,0056 | |||
| UL / Unilever PLC - Depositary Receipt (Common Stock) | 0,01 | 2,15 | 0,32 | -5,41 | 0,1174 | -0,0062 | |||
| WMT / Walmart Inc. | 0,00 | -2,04 | 0,31 | -3,13 | 0,1152 | -0,0033 | |||
| SAM / The Boston Beer Company, Inc. | 0,00 | 0,31 | 0,1152 | 0,1152 | |||||
| DUK / Duke Energy Corporation | 0,00 | -6,47 | 0,29 | -7,52 | 0,1100 | -0,0085 | |||
| TDTT / FlexShares Trust - FlexShares iBoxx 3-Year Target Duration TIPS Index Fund | 0,01 | 0,26 | 0,0954 | 0,0954 | |||||
| DGRO / iShares Trust - iShares Core Dividend Growth ETF | 0,00 | -3,38 | 0,25 | -3,88 | 0,0924 | -0,0034 | |||
| CRM / Salesforce, Inc. | 0,00 | 0,22 | 0,0828 | 0,0828 | |||||
| ADBE / Adobe Inc. | 0,00 | 10,20 | 0,22 | 8,46 | 0,0813 | 0,0066 | |||
| XBI / SPDR Series Trust - SPDR S&P Biotech ETF | 0,00 | 0,00 | 0,21 | -7,05 | 0,0787 | -0,0056 | |||
| TSLA / Tesla, Inc. | 0,00 | 0,21 | 0,0779 | 0,0779 | |||||
| FREL / Fidelity Covington Trust - Fidelity MSCI Real Estate Index ETF | 0,01 | -2,22 | 0,20 | -2,40 | 0,0757 | -0,0016 | |||
| SIRI / Sirius XM Holdings Inc. | 0,01 | 0,18 | 0,07 | -6,33 | 0,0276 | -0,0018 | |||
| LYB / LyondellBasell Industries N.V. | 0,00 | -100,00 | 0,00 | -100,00 | -0,5704 | ||||
| GAFFX / Growth Fund Of America - Growth Fund of America - Class F-3 | 0,00 | -100,00 | 0,00 | -100,00 | -0,0832 | ||||
| O / Realty Income Corporation | 0,00 | -100,00 | 0,00 | -100,00 | -0,0750 | ||||
| PPL / PPL Corporation | 0,00 | -100,00 | 0,00 | -100,00 | -0,1972 |