Grundlæggende statistik
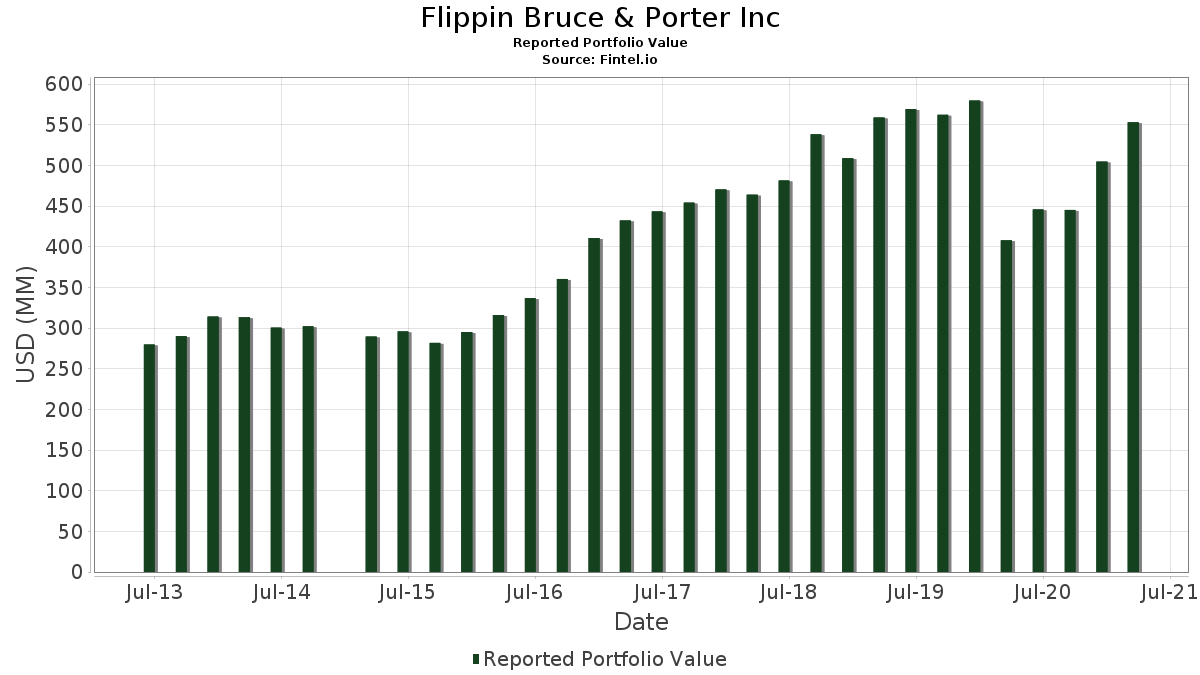
| Porteføljeværdi | $ 553.141.000 |
| Nuværende stillinger | 78 |
Seneste beholdninger, ydeevne, AUM (fra 13F, 13D)
Flippin Bruce & Porter Inc har afsløret 78 samlede besiddelser i deres seneste SEC-arkivering. Den seneste porteføljeværdi er beregnet til at være $ 553.141.000 USD. Faktiske aktiver under forvaltning (AUM) er denne værdi plus kontanter (som ikke er oplyst). Flippin Bruce & Porter Incs største beholdninger er Broadcom Inc. (US:AVGO) , JPMorgan Chase & Co. (US:JPM) , Nucor Corporation (US:NUE) , Cisco Systems, Inc. (US:CSCO) , and International Business Machines Corporation (US:IBM) . Flippin Bruce & Porter Incs nye stillinger omfatter First Horizon Corporation (US:FHN) , .
Top øger dette kvartal
Vi bruger ændringen i porteføljeallokeringen, fordi dette er den mest meningsfulde metrik. Ændringer kan skyldes handler eller ændringer i aktiekurser.
| Sikkerhed | Aktier (MM) |
Værdi (MM$) |
Portefølje % | ΔPortefølje % |
|---|---|---|---|---|
| 0,13 | 7,44 | 1,3452 | 1,2602 | |
| 0,12 | 7,23 | 1,3073 | 1,2391 | |
| 0,29 | 4,82 | 0,8712 | 0,8712 | |
| 0,14 | 6,75 | 1,2201 | 0,8550 | |
| 0,01 | 4,69 | 0,8473 | 0,8473 | |
| 0,21 | 16,71 | 3,0204 | 0,7925 | |
| 0,26 | 10,13 | 1,8312 | 0,3143 | |
| 0,14 | 7,75 | 1,4016 | 0,3077 | |
| 0,18 | 10,95 | 1,9803 | 0,2794 | |
| 0,08 | 9,39 | 1,6985 | 0,2658 |
Top falder i dette kvartal
Vi bruger ændringen i porteføljeallokeringen, fordi dette er den mest meningsfulde metrik. Ændringer kan skyldes handler eller ændringer i aktiekurser.
| Sikkerhed | Aktier (MM) |
Værdi (MM$) |
Portefølje % | ΔPortefølje % |
|---|---|---|---|---|
| 0,02 | 3,13 | 0,5668 | -1,8676 | |
| 0,08 | 1,84 | 0,3334 | -1,4223 | |
| 0,13 | 7,54 | 1,3631 | -0,8971 | |
| 0,07 | 5,90 | 1,0665 | -0,6379 | |
| 0,26 | 10,62 | 1,9207 | -0,6030 | |
| 0,17 | 13,17 | 2,3809 | -0,4322 | |
| 0,12 | 18,75 | 3,3901 | -0,4294 | |
| 0,00 | 0,00 | -0,2857 | ||
| 0,13 | 7,86 | 1,4206 | -0,2580 | |
| 0,31 | 11,24 | 2,0324 | -0,2431 |
13F og Fondsarkivering
Denne formular blev indsendt den 2021-05-04 for rapporteringsperioden 2021-03-31. Klik på linkikonet for at se den fulde transaktionshistorik.
Opgrader for at låse op for premium-data og eksportere til Excel ![]() .
.
| Sikkerhed | Type | Gennemsnitlig aktiekurs | Aktier (MM) |
Δ Aktier (%) |
Δ Aktier (%) |
Værdi ($MM) |
Portefølje (%) |
ΔPortefølje (%) |
|
|---|---|---|---|---|---|---|---|---|---|
| AVGO / Broadcom Inc. | 0,05 | -2,03 | 22,27 | 3,74 | 4,0254 | -0,2266 | |||
| JPM / JPMorgan Chase & Co. | 0,12 | -18,81 | 18,75 | -2,74 | 3,3901 | -0,4294 | |||
| NUE / Nucor Corporation | 0,21 | -1,56 | 16,71 | 48,56 | 3,0204 | 0,7925 | |||
| CSCO / Cisco Systems, Inc. | 0,29 | -1,32 | 15,13 | 14,03 | 2,7356 | 0,1068 | |||
| IBM / International Business Machines Corporation | 0,11 | 0,15 | 14,84 | 6,02 | 2,6827 | -0,0902 | |||
| JNJ / Johnson & Johnson | 0,09 | -0,73 | 14,72 | 3,67 | 2,6615 | -0,1518 | |||
| HPQ / HP Inc. | 0,45 | -21,85 | 14,27 | 0,91 | 2,5789 | -0,2215 | |||
| CVS / CVS Health Corporation | 0,19 | -1,70 | 14,22 | 8,28 | 2,5704 | -0,0309 | |||
| / ViacomCBS Inc | 0,31 | -15,73 | 14,09 | 1,99 | 2,5476 | -0,1896 | |||
| MRK / Merck & Co., Inc. | 0,17 | -1,59 | 13,17 | -7,25 | 2,3809 | -0,4322 | |||
| K / Kellanova | 0,21 | 14,40 | 12,98 | 16,36 | 2,3464 | 0,1367 | |||
| RTX / RTX Corporation | 0,16 | -1,46 | 12,18 | 6,47 | 2,2027 | -0,0645 | |||
| USB / U.S. Bancorp | 0,22 | -2,12 | 12,06 | 16,19 | 2,1806 | 0,1241 | |||
| TFC / Truist Financial Corporation | 0,19 | -2,07 | 11,34 | 19,15 | 2,0505 | 0,1647 | |||
| DOW / Dow Inc. | 0,18 | -1,58 | 11,33 | 13,38 | 2,0481 | 0,0686 | |||
| PFE / Pfizer Inc. | 0,31 | -0,55 | 11,24 | -2,12 | 2,0324 | -0,2431 | |||
| MET / MetLife, Inc. | 0,18 | -1,46 | 10,95 | 27,58 | 1,9803 | 0,2794 | |||
| KEY / KeyCorp | 0,54 | -1,99 | 10,82 | 19,33 | 1,9568 | 0,1598 | |||
| TPR / Tapestry, Inc. | 0,26 | -37,10 | 10,62 | -16,60 | 1,9207 | -0,6030 | |||
| DUK / Duke Energy Corporation | 0,11 | -0,88 | 10,30 | 4,49 | 1,8626 | -0,0907 | |||
| WFC / Wells Fargo & Company | 0,26 | 2,19 | 10,13 | 32,28 | 1,8312 | 0,3143 | |||
| UPS / United Parcel Service, Inc. | 0,06 | -2,83 | 10,03 | -1,92 | 1,8127 | -0,2125 | |||
| LNC / Lincoln National Corporation | 0,16 | -1,26 | 10,01 | 22,20 | 1,8089 | 0,1868 | |||
| SJM / The J. M. Smucker Company | 0,08 | -1,24 | 9,95 | 8,09 | 1,7986 | -0,0247 | |||
| BMY / Bristol-Myers Squibb Company | 0,15 | -0,89 | 9,69 | 0,86 | 1,7522 | -0,1514 | |||
| PM / Philip Morris International Inc. | 0,11 | -1,94 | 9,43 | 5,12 | 1,7046 | -0,0724 | |||
| SPG / Simon Property Group, Inc. | 0,08 | -2,62 | 9,39 | 29,91 | 1,6985 | 0,2658 | |||
| T / AT&T Inc. | 0,31 | -0,61 | 9,24 | 4,60 | 1,6706 | -0,0796 | |||
| GPC / Genuine Parts Company | 0,08 | -2,82 | 9,06 | 11,84 | 1,6372 | 0,0331 | |||
| INTC / Intel Corporation | 0,14 | -0,68 | 8,69 | 27,58 | 1,5716 | 0,2217 | |||
| CVX / Chevron Corporation | 0,08 | -1,35 | 8,67 | 22,41 | 1,5674 | 0,1642 | |||
| RDS.B / Shell Plc - ADR | 0,23 | -0,17 | 8,50 | 9,38 | 1,5370 | -0,0029 | |||
| COP / ConocoPhillips | 0,15 | -1,16 | 8,19 | 30,91 | 1,4806 | 0,2413 | |||
| KSS / Kohl's Corporation | 0,13 | -36,69 | 7,86 | -7,26 | 1,4206 | -0,2580 | |||
| XOM / Exxon Mobil Corporation | 0,14 | 3,67 | 7,75 | 40,40 | 1,4016 | 0,3077 | |||
| VTR / Ventas, Inc. | 0,14 | -2,27 | 7,58 | 6,29 | 1,3711 | -0,0424 | |||
| ADM / Archer-Daniels-Midland Company | 0,13 | -41,55 | 7,54 | -33,91 | 1,3631 | -0,8971 | |||
| VZ / Verizon Communications Inc. | 0,13 | 1.650,55 | 7,44 | 1.634,50 | 1,3452 | 1,2602 | |||
| MDLZ / Mondelez International, Inc. | 0,12 | 2.000,60 | 7,23 | 2.002,03 | 1,3073 | 1,2391 | |||
| PRU / Prudential Financial, Inc. | 0,08 | -0,63 | 7,08 | 15,96 | 1,2807 | 0,0704 | |||
| BK / The Bank of New York Mellon Corporation | 0,14 | 228,61 | 6,75 | 266,20 | 1,2201 | 0,8550 | |||
| PBCT / People`s United Financial Inc | 0,34 | -0,36 | 6,07 | 37,91 | 1,0976 | 0,2255 | |||
| EMR / Emerson Electric Co. | 0,07 | -38,92 | 5,90 | -31,43 | 1,0665 | -0,6379 | |||
| BAC / Bank of America Corporation | 0,15 | -2,24 | 5,69 | 24,78 | 1,0289 | 0,1253 | |||
| CMP / Compass Minerals International, Inc. | 0,08 | -0,48 | 5,26 | 1,12 | 0,9506 | -0,0796 | |||
| PSA / Public Storage | 0,02 | -0,91 | 5,02 | 5,89 | 0,9070 | -0,0316 | |||
| PPL / PPL Corporation | 0,17 | -0,47 | 4,82 | 1,77 | 0,8714 | -0,0669 | |||
| FHN / First Horizon Corporation | 0,29 | 4,82 | 0,8712 | 0,8712 | |||||
| LMT / Lockheed Martin Corporation | 0,01 | 4,69 | 0,8473 | 0,8473 | |||||
| NFG / National Fuel Gas Company | 0,09 | 0,50 | 4,65 | 22,13 | 0,8401 | 0,0863 | |||
| TSN / Tyson Foods, Inc. | 0,06 | -1,10 | 4,52 | 14,03 | 0,8170 | 0,0319 | |||
| DOX / Amdocs Limited | 0,06 | -1,38 | 4,32 | -2,46 | 0,7810 | -0,0964 | |||
| MDT / Medtronic plc | 0,03 | 0,07 | 4,01 | 0,91 | 0,7248 | -0,0623 | |||
| FDX / FedEx Corporation | 0,01 | -0,24 | 3,94 | 9,12 | 0,7118 | -0,0030 | |||
| MSFT / Microsoft Corporation | 0,02 | -0,74 | 3,87 | 5,19 | 0,7000 | -0,0292 | |||
| AAPL / Apple Inc. | 0,03 | 0,76 | 3,65 | -7,24 | 0,6599 | -0,1197 | |||
| ETN / Eaton Corporation plc | 0,02 | -77,83 | 3,13 | -74,49 | 0,5668 | -1,8676 | |||
| COF / Capital One Financial Corporation | 0,02 | -0,66 | 3,06 | 27,85 | 0,5536 | 0,0791 | |||
| WMT / Walmart Inc. | 0,02 | -9,66 | 2,49 | -14,91 | 0,4500 | -0,1295 | |||
| TRV / The Travelers Companies, Inc. | 0,02 | -0,93 | 2,34 | 6,11 | 0,4236 | -0,0138 | |||
| TGT / Target Corporation | 0,01 | -1,74 | 1,92 | 10,21 | 0,3473 | 0,0020 | |||
| DVN / Devon Energy Corporation | 0,08 | -84,94 | 1,84 | -79,19 | 0,3334 | -1,4223 | |||
| TT / Trane Technologies plc | 0,01 | -1,11 | 1,71 | 12,69 | 0,3082 | 0,0085 | |||
| MOS / The Mosaic Company | 0,05 | -0,23 | 1,51 | 37,02 | 0,2730 | 0,0547 | |||
| F / Ford Motor Company | 0,12 | -0,67 | 1,44 | 38,40 | 0,2600 | 0,0541 | |||
| FCX / Freeport-McMoRan Inc. | 0,04 | -1,28 | 1,33 | 24,91 | 0,2403 | 0,0295 | |||
| TJX / The TJX Companies, Inc. | 0,02 | -0,28 | 1,23 | -3,45 | 0,2225 | -0,0300 | |||
| PEP / PepsiCo, Inc. | 0,01 | -0,34 | 1,19 | -4,97 | 0,2142 | -0,0328 | |||
| WU / The Western Union Company | 0,04 | -0,25 | 1,08 | 12,03 | 0,1952 | 0,0043 | |||
| HSY / The Hershey Company | 0,08 | -26,11 | 1,06 | -10,16 | 0,1918 | -0,0422 | |||
| LUMN / Lumen Technologies, Inc. | 0,08 | -0,38 | 1,06 | 36,39 | 0,1911 | 0,0376 | |||
| CCL / Carnival Corporation & plc | 0,03 | -10,06 | 0,83 | 10,21 | 0,1502 | 0,0009 | |||
| KO / The Coca-Cola Company | 0,01 | 0,00 | 0,75 | -3,96 | 0,1360 | -0,0192 | |||
| PG / The Procter & Gamble Company | 0,00 | 0,00 | 0,52 | -2,80 | 0,0942 | -0,0120 | |||
| MO / Altria Group, Inc. | 0,01 | 0,00 | 0,46 | 24,66 | 0,0823 | 0,0099 | |||
| NSC / Norfolk Southern Corporation | 0,00 | 0,00 | 0,30 | 13,11 | 0,0546 | 0,0017 | |||
| CSX / CSX Corporation | 0,00 | -3,85 | 0,24 | 2,12 | 0,0436 | -0,0032 | |||
| IR / Ingersoll Rand Inc. | 0,00 | 0,21 | 0,0376 | 0,0376 | |||||
| NOK / Nokia Oyj - Depositary Receipt (Common Stock) | 0,00 | -100,00 | 0,00 | -100,00 | -0,2857 | ||||
| KRFG / King Resources, Inc. | 0,01 | 0,00 | 0,0000 | 0,0000 |