Grundlæggende statistik
| Porteføljeværdi | $ 350.223.000 |
| Nuværende stillinger | 189 |
Seneste beholdninger, ydeevne, AUM (fra 13F, 13D)
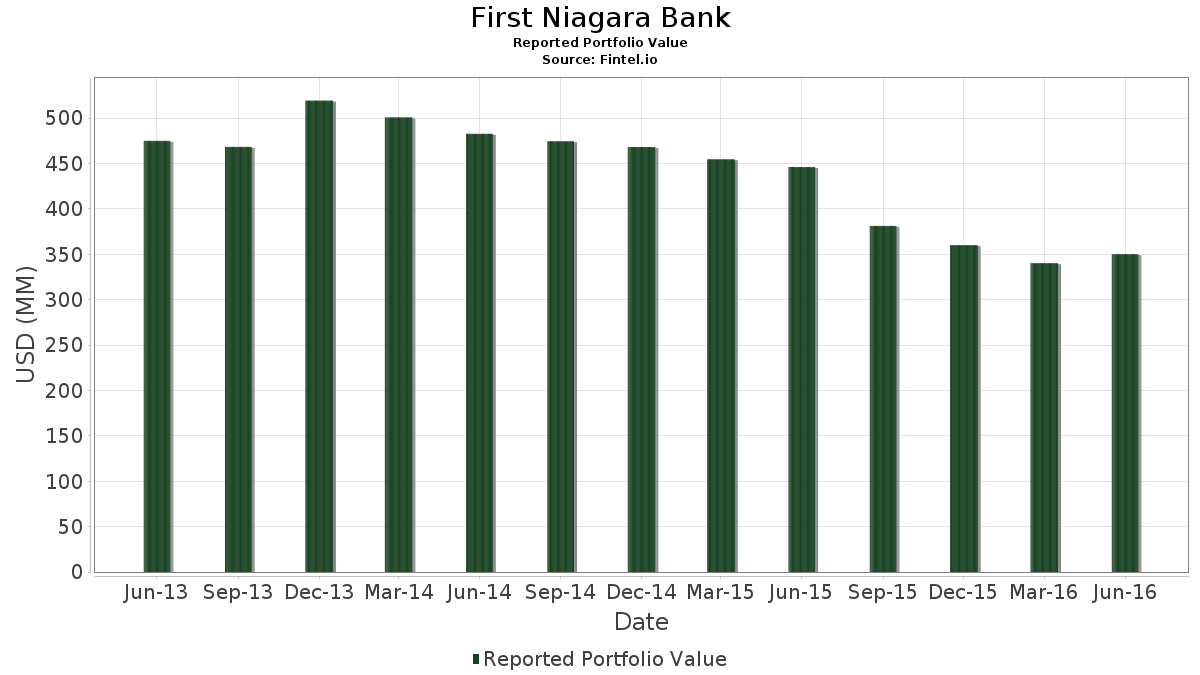
First Niagara Bank har afsløret 189 samlede besiddelser i deres seneste SEC-arkivering. Den seneste porteføljeværdi er beregnet til at være $ 350.223.000 USD. Faktiske aktiver under forvaltning (AUM) er denne værdi plus kontanter (som ikke er oplyst). First Niagara Banks største beholdninger er Johnson & Johnson (US:JNJ) , Exxon Mobil Corporation (US:XOM) , 3M Company (US:MMM) , General Electric Company (US:GE) , and The Procter & Gamble Company (US:PG) . First Niagara Banks nye stillinger omfatter iShares Trust - iShares Biotechnology ETF (US:IBB) , Seagate Technology Holdings plc (US:STX) , PayPal Holdings, Inc. (US:PYPL) , Healthcare Realty Trust Incorporated (US:HR) , and .
Top øger dette kvartal
Vi bruger ændringen i porteføljeallokeringen, fordi dette er den mest meningsfulde metrik. Ændringer kan skyldes handler eller ændringer i aktiekurser.
| Sikkerhed | Aktier (MM) |
Værdi (MM$) |
Portefølje % | ΔPortefølje % |
|---|---|---|---|---|
| 0,16 | 19,91 | 5,6858 | 0,3423 | |
| 0,02 | 1,00 | 0,2850 | 0,2850 | |
| 0,21 | 7,40 | 2,1141 | 0,2555 | |
| 0,03 | 0,98 | 0,2795 | 0,1975 | |
| 0,20 | 18,46 | 5,2718 | 0,1836 | |
| 0,05 | 4,88 | 1,3934 | 0,1150 | |
| 0,06 | 4,20 | 1,1990 | 0,1083 | |
| 0,03 | 4,95 | 1,4137 | 0,0912 | |
| 0,01 | 0,31 | 0,0897 | 0,0897 | |
| 0,00 | 0,30 | 0,0862 | 0,0862 |
Top falder i dette kvartal
Vi bruger ændringen i porteføljeallokeringen, fordi dette er den mest meningsfulde metrik. Ændringer kan skyldes handler eller ændringer i aktiekurser.
| Sikkerhed | Aktier (MM) |
Værdi (MM$) |
Portefølje % | ΔPortefølje % |
|---|---|---|---|---|
| 0,00 | 0,20 | 0,0582 | -0,3705 | |
| 0,08 | 7,45 | 2,1272 | -0,3188 | |
| 0,00 | 0,32 | 0,0914 | -0,2772 | |
| 0,11 | 5,72 | 1,6321 | -0,1333 | |
| 0,06 | 5,65 | 1,6124 | -0,1242 | |
| 0,38 | 11,95 | 3,4113 | -0,1210 | |
| 0,06 | 3,23 | 0,9223 | -0,1049 | |
| 0,05 | 8,04 | 2,2948 | -0,1045 | |
| 0,05 | 2,74 | 0,7824 | -0,1026 | |
| 0,02 | 2,55 | 0,7273 | -0,0760 |
13F og Fondsarkivering
Denne formular blev indsendt den 2016-07-25 for rapporteringsperioden 2016-06-30. Klik på linkikonet for at se den fulde transaktionshistorik.
Opgrader for at låse op for premium-data og eksportere til Excel ![]() .
.
| Sikkerhed | Type | Gennemsnitlig aktiekurs | Aktier (MM) |
Δ Aktier (%) |
Δ Aktier (%) |
Værdi ($MM) |
Portefølje (%) |
ΔPortefølje (%) |
|
|---|---|---|---|---|---|---|---|---|---|
| JNJ / Johnson & Johnson | 0,16 | -2,31 | 19,91 | 9,52 | 5,6858 | 0,3423 | |||
| XOM / Exxon Mobil Corporation | 0,20 | -4,91 | 18,46 | 6,64 | 5,2718 | 0,1836 | |||
| MMM / 3M Company | 0,07 | -1,03 | 11,99 | 4,02 | 3,4241 | 0,0361 | |||
| GE / General Electric Company | 0,38 | 0,38 | 11,95 | -0,60 | 3,4113 | -0,1210 | |||
| PG / The Procter & Gamble Company | 0,12 | -1,24 | 9,76 | 1,59 | 2,7857 | -0,0366 | |||
| IBM / International Business Machines Corporation | 0,05 | -1,77 | 8,04 | -1,56 | 2,2948 | -0,1045 | |||
| PEP / PepsiCo, Inc. | 0,07 | -0,67 | 7,92 | 2,67 | 2,2600 | -0,0056 | |||
| AAPL / Apple Inc. | 0,08 | 2,04 | 7,45 | -10,49 | 2,1272 | -0,3188 | |||
| PFE / Pfizer Inc. | 0,21 | -1,44 | 7,40 | 17,08 | 2,1141 | 0,2555 | |||
| PM / Philip Morris International Inc. | 0,07 | 0,76 | 6,88 | 4,48 | 1,9659 | 0,0291 | |||
| RTX / RTX Corporation | 0,06 | -0,41 | 6,59 | 2,03 | 1,8814 | -0,0166 | |||
| JPM / JPMorgan Chase & Co. | 0,09 | 0,23 | 5,86 | 5,19 | 1,6732 | 0,0359 | |||
| T / AT&T Inc. | 0,13 | -5,13 | 5,76 | 4,67 | 1,6447 | 0,0274 | |||
| MSFT / Microsoft Corporation | 0,11 | 2,70 | 5,72 | -4,84 | 1,6321 | -0,1333 | |||
| CVS / CVS Health Corporation | 0,06 | 3,53 | 5,65 | -4,43 | 1,6124 | -0,1242 | |||
| CVX / Chevron Corporation | 0,05 | -0,87 | 5,36 | 8,93 | 1,5296 | 0,0842 | |||
| ITW / Illinois Tool Works Inc. | 0,05 | 2,39 | 5,01 | 4,13 | 1,4317 | 0,0166 | |||
| BDX / Becton, Dickinson and Company | 0,03 | -1,49 | 4,95 | 10,02 | 1,4137 | 0,0912 | |||
| ECL / Ecolab Inc. | 0,04 | -0,65 | 4,95 | 5,64 | 1,4125 | 0,0362 | |||
| DIS / The Walt Disney Company | 0,05 | 1,59 | 4,94 | 0,06 | 1,4100 | -0,0404 | |||
| ADP / Automatic Data Processing, Inc. | 0,05 | 9,56 | 4,88 | 12,18 | 1,3934 | 0,1150 | |||
| NEE / NextEra Energy, Inc. | 0,04 | -0,76 | 4,67 | 9,36 | 1,3349 | 0,0785 | |||
| VZ / Verizon Communications Inc. | 0,08 | -2,57 | 4,65 | 0,63 | 1,3269 | -0,0303 | |||
| MRK / Merck & Co., Inc. | 0,08 | -0,76 | 4,50 | 8,09 | 1,2863 | 0,0614 | |||
| INTC / Intel Corporation | 0,13 | -0,92 | 4,39 | 0,46 | 1,2543 | -0,0308 | |||
| BMY / Bristol-Myers Squibb Company | 0,06 | -1,70 | 4,20 | 13,15 | 1,1990 | 0,1083 | |||
| ABT / Abbott Laboratories | 0,10 | 4,04 | 3,85 | -2,21 | 1,1007 | -0,0578 | |||
| OMC / Omnicom Group Inc. | 0,04 | 2,63 | 3,67 | 0,49 | 1,0468 | -0,0254 | |||
| WFC / Wells Fargo & Company | 0,07 | 0,55 | 3,50 | -1,57 | 1,0008 | -0,0458 | |||
| ABBV / AbbVie Inc. | 0,05 | -1,36 | 3,33 | 6,94 | 0,9503 | 0,0357 | |||
| TMO / Thermo Fisher Scientific Inc. | 0,02 | -0,42 | 3,25 | 3,93 | 0,9294 | 0,0089 | |||
| NKE / NIKE, Inc. | 0,06 | 2,91 | 3,23 | -7,58 | 0,9223 | -0,1049 | |||
| KO / The Coca-Cola Company | 0,07 | -0,36 | 3,12 | -2,65 | 0,8903 | -0,0510 | |||
| DHR / Danaher Corporation | 0,03 | 0,15 | 3,06 | 6,62 | 0,8732 | 0,0303 | |||
| MO / Altria Group, Inc. | 0,04 | -1,56 | 2,98 | 8,32 | 0,8515 | 0,0424 | |||
| STT / State Street Corporation | 0,05 | -1,24 | 2,74 | -9,00 | 0,7824 | -0,1026 | |||
| AMGN / Amgen Inc. | 0,02 | -8,15 | 2,55 | -6,81 | 0,7273 | -0,0760 | |||
| HON / Honeywell International Inc. | 0,02 | -0,16 | 2,53 | 3,65 | 0,7224 | 0,0050 | |||
| KMB / Kimberly-Clark Corporation | 0,02 | -0,95 | 2,37 | 1,24 | 0,6767 | -0,0113 | |||
| UNH / UnitedHealth Group Incorporated | 0,02 | -13,72 | 2,35 | -5,46 | 0,6724 | -0,0597 | |||
| DOW / Dow Inc. | 0,03 | 1,09 | 2,26 | 3,43 | 0,6453 | 0,0031 | |||
| GIS / General Mills, Inc. | 0,03 | -1,45 | 2,17 | 11,03 | 0,6210 | 0,0453 | |||
| DG / Dollar General Corporation | 0,02 | 0,31 | 2,16 | 10,13 | 0,6176 | 0,0404 | |||
| MCHP / Microchip Technology Incorporated | 0,04 | 6,83 | 2,15 | 12,52 | 0,6133 | 0,0523 | |||
| MMC / Marsh & McLennan Companies, Inc. | 0,03 | -2,27 | 2,13 | 10,08 | 0,6082 | 0,0395 | |||
| BA / The Boeing Company | 0,02 | -1,84 | 2,00 | 0,45 | 0,5708 | -0,0141 | |||
| MDLZ / Mondelez International, Inc. | 0,04 | -3,29 | 1,98 | 9,74 | 0,5662 | 0,0351 | |||
| GWW / W.W. Grainger, Inc. | 0,01 | -1,77 | 1,98 | -4,35 | 0,5656 | -0,0430 | |||
| OXY / Occidental Petroleum Corporation | 0,03 | 3,79 | 1,94 | 14,56 | 0,5548 | 0,0563 | |||
| UNP / Union Pacific Corporation | 0,02 | 1,37 | 1,93 | 11,22 | 0,5519 | 0,0411 | |||
| HD / The Home Depot, Inc. | 0,01 | -4,66 | 1,91 | -8,73 | 0,5462 | -0,0698 | |||
| GILD / Gilead Sciences, Inc. | 0,02 | 5,28 | 1,89 | -4,40 | 0,5394 | -0,0414 | |||
| BAC / Bank of America Corporation | 0,13 | -0,25 | 1,78 | -2,03 | 0,5088 | -0,0258 | |||
| RDS.A / Shell Plc - ADR (Representing Ordinary Shares - Class A) | 0,03 | 4,86 | 1,74 | 19,53 | 0,4980 | 0,0692 | |||
| MCD / McDonald's Corporation | 0,01 | -3,60 | 1,74 | -7,71 | 0,4954 | -0,0571 | |||
| BAX / Baxter International Inc. | 0,04 | -0,56 | 1,70 | 9,38 | 0,4860 | 0,0287 | |||
| ABC / Amerisource Bergen Corp. | 0,02 | 3,90 | 1,69 | -4,80 | 0,4814 | -0,0391 | |||
| HAS / Hasbro, Inc. | 0,02 | 0,00 | 1,68 | 4,87 | 0,4797 | 0,0089 | |||
| CMCSA / Comcast Corporation | 0,03 | -0,95 | 1,65 | 5,71 | 0,4703 | 0,0124 | |||
| SLB / Schlumberger Limited | 0,02 | -0,48 | 1,62 | 6,71 | 0,4634 | 0,0164 | |||
| CSCO / Cisco Systems, Inc. | 0,06 | -0,88 | 1,62 | -0,12 | 0,4617 | -0,0141 | |||
| 74005P104 / Praxair, Inc. | 0,01 | -0,71 | 1,62 | -2,47 | 0,4614 | -0,0256 | |||
| LOW / Lowe's Companies, Inc. | 0,02 | 1,84 | 1,61 | 6,39 | 0,4608 | 0,0150 | |||
| SJM / The J. M. Smucker Company | 0,01 | -4,97 | 1,57 | 11,61 | 0,4474 | 0,0348 | |||
| WMT / Walmart Inc. | 0,02 | -1,39 | 1,54 | 5,11 | 0,4403 | 0,0092 | |||
| AFL / Aflac Incorporated | 0,02 | -12,54 | 1,53 | -0,07 | 0,4377 | -0,0131 | |||
| GOOG / Alphabet Inc. | 0,00 | 0,00 | 1,52 | -7,08 | 0,4346 | -0,0468 | |||
| CERN / Cerner Corp. | 0,02 | -0,83 | 1,40 | 9,67 | 0,3983 | 0,0245 | |||
| RAI / Reynolds American, Inc. | 0,03 | 6,94 | 1,39 | 14,62 | 0,3963 | 0,0404 | |||
| VDE / Vanguard World Fund - Vanguard Energy ETF | 0,01 | -2,86 | 1,36 | 7,75 | 0,3892 | 0,0174 | |||
| VHT / Vanguard World Fund - Vanguard Health Care ETF | 0,01 | -12,21 | 1,35 | -7,09 | 0,3852 | -0,0415 | |||
| SYK / Stryker Corporation | 0,01 | -2,49 | 1,25 | 8,89 | 0,3569 | 0,0195 | |||
| GOOGL / Alphabet Inc. | 0,00 | -1,15 | 1,21 | -8,86 | 0,3466 | -0,0448 | |||
| TGT / Target Corporation | 0,02 | -0,64 | 1,16 | -15,70 | 0,3312 | -0,0732 | |||
| SO / The Southern Company | 0,02 | -0,46 | 1,16 | 3,21 | 0,3301 | 0,0009 | |||
| MET / MetLife, Inc. | 0,03 | -1,45 | 1,15 | -10,64 | 0,3286 | -0,0499 | |||
| BRK.B / Berkshire Hathaway Inc. | 0,01 | -1,39 | 1,14 | 0,71 | 0,3255 | -0,0072 | |||
| EMR / Emerson Electric Co. | 0,02 | 6,91 | 1,12 | 2,57 | 0,3192 | -0,0011 | |||
| APD / Air Products and Chemicals, Inc. | 0,01 | -0,99 | 1,06 | -2,30 | 0,3029 | -0,0162 | |||
| PPG / PPG Industries, Inc. | 0,01 | -0,25 | 1,05 | -6,80 | 0,3012 | -0,0314 | |||
| COST / Costco Wholesale Corporation | 0,01 | -0,21 | 1,04 | -0,57 | 0,2967 | -0,0104 | |||
| BK / The Bank of New York Mellon Corporation | 0,03 | -3,03 | 1,02 | 2,20 | 0,2915 | -0,0021 | |||
| DOW / Dow Inc. | 0,02 | -1,11 | 1,00 | -3,29 | 0,2850 | 0,2850 | |||
| KHC / The Kraft Heinz Company | 0,01 | -1,32 | 0,98 | 11,17 | 0,2812 | 0,0209 | |||
| KR / The Kroger Co. | 0,03 | 264,79 | 0,98 | 250,90 | 0,2795 | 0,1975 | |||
| CFR / Cullen/Frost Bankers, Inc. | 0,02 | -1,38 | 0,98 | 14,14 | 0,2790 | 0,0274 | |||
| FNFG / First Niagara Financial Group, Inc. | 0,10 | -11,32 | 0,96 | -10,76 | 0,2747 | -0,0421 | |||
| AMZN / Amazon.com, Inc. | 0,00 | 0,30 | 0,95 | 20,97 | 0,2718 | 0,0405 | |||
| AXP / American Express Company | 0,02 | -1,85 | 0,95 | -2,76 | 0,2718 | -0,0159 | |||
| ORCL / Oracle Corporation | 0,02 | -0,00 | 0,95 | 0,00 | 0,2701 | -0,0079 | |||
| COP / ConocoPhillips | 0,02 | 4,10 | 0,95 | 12,62 | 0,2701 | 0,0232 | |||
| PNC / The PNC Financial Services Group, Inc. | 0,01 | 0,00 | 0,94 | -3,78 | 0,2690 | -0,0187 | |||
| 465685105 / ITC Holdings Corp. | 0,02 | -3,21 | 0,90 | 4,06 | 0,2561 | 0,0028 | |||
| BP / BP p.l.c. - Depositary Receipt (Common Stock) | 0,02 | -7,41 | 0,89 | 8,96 | 0,2536 | 0,0140 | |||
| CSX / CSX Corporation | 0,03 | 0,00 | 0,88 | 1,27 | 0,2510 | -0,0041 | |||
| GLW / Corning Incorporated | 0,04 | 3,31 | 0,86 | 1,18 | 0,2458 | -0,0043 | |||
| LLY / Eli Lilly and Company | 0,01 | 38,77 | 0,85 | 51,89 | 0,2416 | 0,0779 | |||
| LUV / Southwest Airlines Co. | 0,02 | 0,00 | 0,78 | -12,44 | 0,2230 | -0,0392 | |||
| META / Meta Platforms, Inc. | 0,01 | 0,00 | 0,78 | 0,26 | 0,2219 | -0,0059 | |||
| UVSP / Univest Financial Corporation | 0,04 | 0,00 | 0,77 | 7,72 | 0,2190 | 0,0098 | |||
| F / Ford Motor Company | 0,06 | -1,90 | 0,77 | -8,59 | 0,2187 | -0,0276 | |||
| GS / The Goldman Sachs Group, Inc. | 0,00 | 0,69 | 0,71 | -4,67 | 0,2039 | -0,0163 | |||
| ROP / Roper Technologies, Inc. | 0,00 | -15,40 | 0,69 | -20,99 | 0,1967 | -0,0595 | |||
| ALL / The Allstate Corporation | 0,01 | 0,07 | 0,68 | 3,95 | 0,1953 | 0,0019 | |||
| CPB / The Campbell's Company | 0,01 | 17,68 | 0,64 | 22,71 | 0,1836 | 0,0296 | |||
| TROW / T. Rowe Price Group, Inc. | 0,01 | -0,41 | 0,63 | -0,94 | 0,1810 | -0,0071 | |||
| SYY / Sysco Corporation | 0,01 | -7,37 | 0,62 | 0,65 | 0,1776 | -0,0040 | |||
| EMC / Global X Funds - Global X Emerging Markets Great Consumer ETF | 0,02 | 0,00 | 0,61 | 2,01 | 0,1742 | -0,0016 | |||
| QCOM / QUALCOMM Incorporated | 0,01 | 0,00 | 0,60 | 4,87 | 0,1722 | 0,0032 | |||
| CTSH / Cognizant Technology Solutions Corporation | 0,01 | -1,08 | 0,58 | -9,80 | 0,1656 | -0,0234 | |||
| BIIB / Biogen Inc. | 0,00 | -0,04 | 0,58 | -7,20 | 0,1656 | -0,0181 | |||
| CI / The Cigna Group | 0,00 | -19,95 | 0,56 | -25,36 | 0,1613 | -0,0612 | |||
| NSC / Norfolk Southern Corporation | 0,01 | 0,00 | 0,53 | 2,31 | 0,1519 | -0,0009 | |||
| ARCC / Ares Capital Corporation | 0,04 | 0,00 | 0,53 | -4,19 | 0,1502 | -0,0112 | |||
| CL / Colgate-Palmolive Company | 0,01 | 1,82 | 0,51 | 5,34 | 0,1465 | 0,0034 | |||
| MBVT / Merchants Bancshares, Inc. | 0,00 | -90,00 | 0,51 | 2,42 | 0,1451 | -0,0007 | |||
| USB / U.S. Bancorp | 0,01 | 1,69 | 0,51 | 1,00 | 0,1448 | -0,0028 | |||
| HSIC / Henry Schein, Inc. | 0,00 | -2,56 | 0,51 | -0,39 | 0,1442 | -0,0048 | |||
| WBA / Walgreens Boots Alliance, Inc. | 0,01 | -11,04 | 0,50 | -11,89 | 0,1439 | -0,0242 | |||
| V / Visa Inc. | 0,01 | -0,01 | 0,49 | -2,94 | 0,1413 | -0,0085 | |||
| PEG / Public Service Enterprise Group Incorporated | 0,01 | -5,21 | 0,49 | -6,35 | 0,1391 | -0,0138 | |||
| BR / Broadridge Financial Solutions, Inc. | 0,01 | 0,00 | 0,46 | 9,86 | 0,1305 | 0,0082 | |||
| FBHS / Fortune Brands Home & Security Inc | 0,01 | -4,73 | 0,45 | -1,32 | 0,1282 | -0,0055 | |||
| MTB / M&T Bank Corporation | 0,00 | 0,00 | 0,43 | 6,44 | 0,1228 | 0,0040 | |||
| LMT / Lockheed Martin Corporation | 0,00 | -13,37 | 0,42 | -3,20 | 0,1211 | -0,0077 | |||
| HSBC / HSBC Holdings plc - Depositary Receipt (Common Stock) | 0,01 | 79,58 | 0,42 | 80,43 | 0,1211 | 0,0520 | |||
| NVS / Novartis AG - Depositary Receipt (Common Stock) | 0,01 | 0,00 | 0,42 | 13,82 | 0,1199 | 0,0115 | |||
| CDK / CDK Global Inc | 0,01 | -4,54 | 0,41 | 13,74 | 0,1182 | 0,0112 | |||
| AEP / American Electric Power Company, Inc. | 0,01 | 0,00 | 0,41 | 5,64 | 0,1176 | 0,0030 | |||
| 018490100 / Allergan plc | 0,00 | 0,00 | 0,41 | -13,80 | 0,1159 | -0,0225 | |||
| HPE / Hewlett Packard Enterprise Company | 0,02 | -7,59 | 0,41 | -4,92 | 0,1159 | -0,0096 | |||
| GD / General Dynamics Corporation | 0,00 | 0,00 | 0,41 | 6,02 | 0,1156 | 0,0034 | |||
| / Total S.A. | 0,01 | 0,00 | 0,41 | 6,02 | 0,1156 | 0,0034 | |||
| FISV / Fiserv, Inc. | 0,00 | -6,43 | 0,38 | -1,04 | 0,1088 | -0,0044 | |||
| ESRX / Express Scripts Holding Co. | 0,00 | 7,91 | 0,38 | 19,30 | 0,1076 | 0,0148 | |||
| DUK / Duke Energy Corporation | 0,00 | -0,39 | 0,37 | 5,71 | 0,1056 | 0,0028 | |||
| PPL / PPL Corporation | 0,01 | 4,11 | 0,36 | 3,43 | 0,1034 | 0,0005 | |||
| SWK / Stanley Black & Decker, Inc. | 0,00 | -37,82 | 0,36 | -34,24 | 0,1031 | -0,0583 | |||
| MS / Morgan Stanley | 0,01 | -0,71 | 0,36 | 3,14 | 0,1031 | 0,0002 | |||
| DEO / Diageo plc - Depositary Receipt (Common Stock) | 0,00 | 0,00 | 0,34 | 4,56 | 0,0982 | 0,0015 | |||
| GSK / GSK plc - Depositary Receipt (Common Stock) | 0,01 | 0,00 | 0,34 | 6,98 | 0,0962 | 0,0036 | |||
| D / Dominion Energy, Inc. | 0,00 | 0,00 | 0,33 | 3,76 | 0,0945 | 0,0008 | |||
| CNP / CenterPoint Energy, Inc. | 0,01 | -0,09 | 0,33 | 14,58 | 0,0942 | 0,0096 | |||
| ANTM / Anthem Inc | 0,00 | 0,00 | 0,33 | -5,19 | 0,0939 | -0,0080 | |||
| AET / Aetna, Inc. | 0,00 | -0,57 | 0,32 | 8,08 | 0,0917 | 0,0044 | |||
| PRGO / Perrigo Company plc | 0,00 | -64,04 | 0,32 | -74,48 | 0,0914 | -0,2772 | |||
| RTN / Raytheon Co. | 0,00 | 0,00 | 0,32 | 11,23 | 0,0905 | 0,0068 | |||
| NJR / New Jersey Resources Corporation | 0,01 | 0,00 | 0,32 | 5,67 | 0,0905 | 0,0023 | |||
| AZN / AstraZeneca PLC - Depositary Receipt (Common Stock) | 0,01 | 0,00 | 0,31 | 0,0897 | 0,0897 | ||||
| ZBH / Zimmer Biomet Holdings, Inc. | 0,00 | -3,77 | 0,31 | 8,83 | 0,0879 | 0,0048 | |||
| HPQ / HP Inc. | 0,02 | 0,90 | 0,31 | 3,03 | 0,0874 | 0,0001 | |||
| IBB / iShares Trust - iShares Biotechnology ETF | 0,00 | 0,30 | 0,0862 | 0,0862 | |||||
| LUMN / Lumen Technologies, Inc. | 0,01 | -0,28 | 0,30 | -9,34 | 0,0859 | -0,0116 | |||
| ADBE / Adobe Inc. | 0,00 | -7,27 | 0,30 | -5,66 | 0,0857 | -0,0078 | |||
| HSY / The Hershey Company | 0,00 | 0,00 | 0,30 | 23,24 | 0,0848 | 0,0140 | |||
| EXC / Exelon Corporation | 0,01 | 0,00 | 0,29 | 0,0837 | 0,0837 | ||||
| BMS / Bemis Co., Inc. | 0,01 | -0,75 | 0,28 | -1,06 | 0,0802 | -0,0032 | |||
| MCO / Moody's Corporation | 0,00 | 0,00 | 0,28 | -3,10 | 0,0802 | -0,0050 | |||
| XLV / The Select Sector SPDR Trust - The Health Care Select Sector SPDR Fund | 0,00 | -19,86 | 0,28 | -15,12 | 0,0785 | -0,0167 | |||
| PSX / Phillips 66 | 0,00 | 0,00 | 0,27 | -8,36 | 0,0782 | -0,0096 | |||
| SPGI / S&P Global Inc. | 0,00 | -30,26 | 0,27 | -24,51 | 0,0774 | -0,0281 | |||
| STX / Seagate Technology Holdings plc | 0,01 | 0,26 | 0,0748 | 0,0748 | |||||
| YUM / Yum! Brands, Inc. | 0,00 | 0,00 | 0,26 | 1,56 | 0,0745 | -0,0010 | |||
| CB / Chubb Limited | 0,00 | -9,05 | 0,26 | -0,38 | 0,0740 | -0,0025 | |||
| AVY / Avery Dennison Corporation | 0,00 | -0,72 | 0,26 | 2,79 | 0,0737 | -0,0001 | |||
| FDX / FedEx Corporation | 0,00 | 0,00 | 0,26 | -6,55 | 0,0734 | -0,0074 | |||
| CLX / The Clorox Company | 0,00 | -10,16 | 0,25 | -1,56 | 0,0722 | -0,0033 | |||
| US16941M1099 / China Mobile Ltd. | 0,00 | 0,00 | 0,25 | 4,66 | 0,0705 | 0,0012 | |||
| IR / Ingersoll Rand Inc. | 0,00 | 0,00 | 0,24 | 2,94 | 0,0700 | 0,0000 | |||
| US0549371070 / BB&T Corp. | 0,01 | -0,84 | 0,24 | -12,64 | 0,0691 | 0,0691 | |||
| GM / General Motors Company | 0,01 | -2,95 | 0,24 | -12,73 | 0,0685 | -0,0123 | |||
| PRU / Prudential Financial, Inc. | 0,00 | 0,00 | 0,23 | -1,67 | 0,0671 | -0,0031 | |||
| MDT / Medtronic plc | 0,00 | -5,34 | 0,23 | 9,48 | 0,0660 | 0,0039 | |||
| XLP / The Select Sector SPDR Trust - The Consumer Staples Select Sector SPDR Fund | 0,00 | -14,31 | 0,23 | -10,85 | 0,0657 | -0,0102 | |||
| KDP / Keurig Dr Pepper Inc. | 0,00 | -23,80 | 0,23 | -17,69 | 0,0651 | -0,0163 | |||
| MA / Mastercard Incorporated | 0,00 | 1,40 | 0,22 | -5,49 | 0,0640 | -0,0057 | |||
| HBI / Hanesbrands Inc. | 0,01 | 0,00 | 0,22 | -11,16 | 0,0637 | -0,0101 | |||
| JWN / Nordstrom, Inc. | 0,01 | -0,85 | 0,22 | -34,12 | 0,0634 | -0,0357 | |||
| TJX / The TJX Companies, Inc. | 0,00 | -0,73 | 0,22 | -2,20 | 0,0634 | -0,0033 | |||
| PYPL / PayPal Holdings, Inc. | 0,01 | 0,22 | 0,0625 | 0,0625 | |||||
| BRK.A / Berkshire Hathaway Inc. | 0,00 | 0,00 | 0,22 | 1,88 | 0,0620 | -0,0006 | |||
| CAT / Caterpillar Inc. | 0,00 | 1,40 | 0,21 | 0,00 | 0,0611 | -0,0018 | |||
| ACN / Accenture plc | 0,00 | -9,71 | 0,21 | -11,34 | 0,0602 | -0,0097 | |||
| HR / Healthcare Realty Trust Incorporated | 0,01 | 0,21 | 0,0600 | 0,0600 | |||||
| IFF / International Flavors & Fragrances Inc. | 0,00 | -12,00 | 0,21 | -2,35 | 0,0594 | -0,0032 | |||
| APA / APA Corporation | 0,00 | 0,00 | 0,21 | 0,0594 | 0,0594 | ||||
| RDS.A / Shell Plc - ADR (Representing Ordinary Shares - Class A) | 0,00 | -87,89 | 0,20 | -86,02 | 0,0582 | -0,3705 | |||
| PBCT / People`s United Financial Inc | 0,01 | 0,00 | 0,20 | -7,94 | 0,0562 | -0,0066 | |||
| XPL / Solitario Resources Corp. | 0,03 | 0,00 | 0,01 | 7,14 | 0,0043 | 0,0002 | |||
| RCL / Royal Caribbean Cruises Ltd. | 0,00 | -100,00 | 0,00 | -100,00 | -0,0620 | ||||
| BXLT / Baxalta Incorporated | 0,00 | -100,00 | 0,00 | -100,00 | -0,0688 | ||||
| TECK / Teck Resources Limited | 0,00 | -100,00 | 0,00 | -100,00 | -0,0291 | ||||
| NPBC / National Penn Bancshares, Inc. | 0,00 | -100,00 | 0,00 | -100,00 | -0,0312 | ||||
| VGT / Vanguard World Fund - Vanguard Information Technology ETF | 0,00 | -100,00 | 0,00 | -100,00 | -0,0752 | ||||
| SIRI / Sirius XM Holdings Inc. | 0,00 | -100,00 | 0,00 | -100,00 | -0,0173 |