Grundlæggende statistik
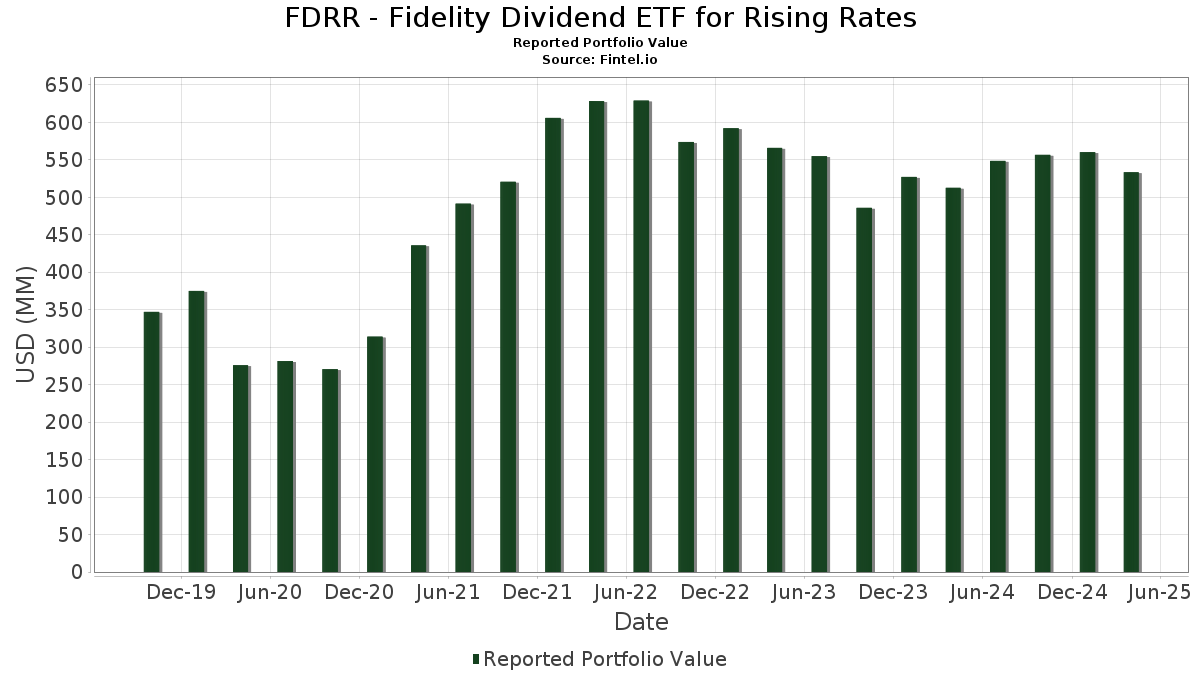
| Porteføljeværdi | $ 533.402.215 |
| Nuværende stillinger | 117 |
Seneste beholdninger, ydeevne, AUM (fra 13F, 13D)
FDRR - Fidelity Dividend ETF for Rising Rates har afsløret 117 samlede besiddelser i deres seneste SEC-arkivering. Den seneste porteføljeværdi er beregnet til at være $ 533.402.215 USD. Faktiske aktiver under forvaltning (AUM) er denne værdi plus kontanter (som ikke er oplyst). FDRR - Fidelity Dividend ETF for Rising Ratess største beholdninger er Apple Inc. (US:AAPL) , Microsoft Corporation (US:MSFT) , NVIDIA Corporation (US:NVDA) , Alphabet Inc. (US:GOOGL) , and Fidelity Securities Lending Cash Central Fund (US:US31635A3032) . FDRR - Fidelity Dividend ETF for Rising Ratess nye stillinger omfatter Alphabet Inc. (US:GOOGL) , Meta Platforms, Inc. (US:META) , ABN AMRO Bank N.V. - Depositary Receipt (Common Stock) (US:ABMRF) , Microchip Technology Incorporated (US:MCHP) , and Yamaha Motor Co., Ltd. (US:YAMHF) .
Top øger dette kvartal
Vi bruger ændringen i porteføljeallokeringen, fordi dette er den mest meningsfulde metrik. Ændringer kan skyldes handler eller ændringer i aktiekurser.
| Sikkerhed | Aktier (MM) |
Værdi (MM$) |
Portefølje % | ΔPortefølje % |
|---|---|---|---|---|
| 0,11 | 16,96 | 3,2648 | 3,2648 | |
| 0,02 | 12,09 | 2,3266 | 2,3266 | |
| 15,20 | 15,20 | 2,9255 | 2,0229 | |
| 0,29 | 5,97 | 1,1488 | 1,1488 | |
| 0,11 | 4,95 | 0,9534 | 0,9534 | |
| 0,60 | 4,72 | 0,9087 | 0,9087 | |
| 0,01 | 4,13 | 0,7953 | 0,7953 | |
| 0,08 | 4,00 | 0,7695 | 0,7695 | |
| 0,05 | 3,56 | 0,6851 | 0,6851 | |
| 0,08 | 3,50 | 0,6740 | 0,6740 |
Top falder i dette kvartal
Vi bruger ændringen i porteføljeallokeringen, fordi dette er den mest meningsfulde metrik. Ændringer kan skyldes handler eller ændringer i aktiekurser.
| Sikkerhed | Aktier (MM) |
Værdi (MM$) |
Portefølje % | ΔPortefølje % |
|---|---|---|---|---|
| 0,28 | 30,98 | 5,9629 | -1,2091 | |
| 0,07 | 13,35 | 2,5705 | -0,8637 | |
| 0,01 | 0,58 | 0,1109 | -0,6426 | |
| 0,02 | 5,51 | 1,0615 | -0,5274 | |
| 0,17 | 36,50 | 7,0268 | -0,4687 | |
| 0,09 | 2,45 | 0,4725 | -0,4393 | |
| 0,00 | 0,00 | -0,4372 | ||
| 0,02 | 0,56 | 0,1070 | -0,4355 | |
| 0,01 | 0,56 | 0,1069 | -0,4136 | |
| 0,01 | 0,55 | 0,1051 | -0,3663 |
13F og Fondsarkivering
Denne formular blev indsendt den 2025-06-26 for rapporteringsperioden 2025-04-30. Klik på linkikonet for at se den fulde transaktionshistorik.
Opgrader for at låse op for premium-data og eksportere til Excel ![]() .
.
| Sikkerhed | Type | Gennemsnitlig aktiekurs | Aktier (MM) |
Δ Aktier (%) |
Δ Aktier (%) |
Værdi ($MM) |
Portefølje (%) |
ΔPortefølje (%) |
|
|---|---|---|---|---|---|---|---|---|---|
| AAPL / Apple Inc. | 0,17 | -2,74 | 36,50 | -12,43 | 7,0268 | -0,4687 | |||
| MSFT / Microsoft Corporation | 0,09 | -2,75 | 34,05 | -7,39 | 6,5551 | -0,0565 | |||
| NVDA / NVIDIA Corporation | 0,28 | -14,38 | 30,98 | -22,33 | 5,9629 | -1,2091 | |||
| GOOGL / Alphabet Inc. | 0,11 | 16,96 | 3,2648 | 3,2648 | |||||
| US31635A3032 / Fidelity Securities Lending Cash Central Fund | 15,20 | 202,77 | 15,20 | 202,79 | 2,9255 | 2,0229 | |||
| AVGO / Broadcom Inc. | 0,07 | -19,62 | 13,35 | -30,08 | 2,5705 | -0,8637 | |||
| META / Meta Platforms, Inc. | 0,02 | 12,09 | 2,3266 | 2,3266 | |||||
| LLY / Eli Lilly and Company | 0,01 | -8,63 | 11,44 | 1,27 | 2,2027 | 0,1709 | |||
| JPM / JPMorgan Chase & Co. | 0,05 | -6,09 | 11,06 | -14,06 | 2,1284 | -0,1851 | |||
| JNJ / Johnson & Johnson | 0,05 | 4,46 | 7,95 | 7,32 | 1,5297 | 0,1982 | |||
| ABBV / AbbVie Inc. | 0,04 | -3,59 | 7,67 | 2,28 | 1,4758 | 0,1279 | |||
| HD / The Home Depot, Inc. | 0,02 | 14,19 | 7,64 | -0,07 | 1,4711 | 0,0958 | |||
| MCD / McDonald's Corporation | 0,02 | 34,21 | 7,49 | 48,61 | 1,4425 | 0,5357 | |||
| CSCO / Cisco Systems, Inc. | 0,13 | -9,78 | 7,30 | -14,05 | 1,4057 | -0,1221 | |||
| IBM / International Business Machines Corporation | 0,03 | -16,78 | 7,22 | -21,29 | 1,3889 | -0,2595 | |||
| UNH / UnitedHealth Group Incorporated | 0,02 | -0,88 | 6,92 | -24,82 | 1,3328 | -0,3233 | |||
| BAC / Bank of America Corporation | 0,17 | 0,13 | 6,64 | -13,75 | 1,2776 | -0,1061 | |||
| WFC / Wells Fargo & Company | 0,09 | -10,65 | 6,54 | -19,49 | 1,2585 | -0,2016 | |||
| CME / CME Group Inc. | 0,02 | 20,51 | 6,43 | 41,18 | 1,2383 | 0,4189 | |||
| TJX / The TJX Companies, Inc. | 0,05 | 14,86 | 6,28 | 18,45 | 1,2097 | 0,2557 | |||
| TXN / Texas Instruments Incorporated | 0,04 | -3,11 | 6,25 | -16,00 | 1,2034 | -0,1348 | |||
| PG / The Procter & Gamble Company | 0,04 | 3,42 | 6,22 | 1,29 | 1,1967 | 0,0931 | |||
| MRK / Merck & Co., Inc. | 0,07 | 28,10 | 6,12 | 10,46 | 1,1772 | 0,1816 | |||
| ABMRF / ABN AMRO Bank N.V. - Depositary Receipt (Common Stock) | 0,29 | 5,97 | 1,1488 | 1,1488 | |||||
| PM / Philip Morris International Inc. | 0,03 | -7,80 | 5,96 | 21,36 | 1,1476 | 0,2642 | |||
| XOM / Exxon Mobil Corporation | 0,06 | 9,69 | 5,87 | 8,46 | 1,1303 | 0,1568 | |||
| CVS / CVS Health Corporation | 0,09 | 36,40 | 5,87 | 61,09 | 1,1296 | 0,4746 | |||
| KO / The Coca-Cola Company | 0,08 | 7,20 | 5,70 | 22,53 | 1,0973 | 0,2606 | |||
| AMGN / Amgen Inc. | 0,02 | -28,82 | 5,51 | -34,11 | 1,0615 | -0,5274 | |||
| C / Citigroup Inc. | 0,08 | 2,08 | 5,36 | -14,28 | 1,0320 | -0,0926 | |||
| MS / Morgan Stanley | 0,05 | -6,98 | 5,36 | -22,45 | 1,0309 | -0,2107 | |||
| PFE / Pfizer Inc. | 0,21 | 9,10 | 5,24 | 0,42 | 1,0096 | 0,0704 | |||
| F / Ford Motor Company | 0,51 | 78,26 | 5,12 | 77,06 | 0,9864 | 0,4659 | |||
| GE / General Electric Company | 0,03 | -16,48 | 5,10 | -17,31 | 0,9815 | -0,1273 | |||
| DELL / Dell Technologies Inc. | 0,06 | -8,17 | 5,08 | -18,67 | 0,9780 | -0,1452 | |||
| GM / General Motors Company | 0,11 | 20,97 | 4,97 | 10,63 | 0,9575 | 0,1491 | |||
| MCHP / Microchip Technology Incorporated | 0,11 | 4,95 | 0,9534 | 0,9534 | |||||
| AFG / American Financial Group, Inc. | 0,04 | 30,63 | 4,81 | 37,41 | 0,9265 | 0,2615 | |||
| MBG / Mercedes-Benz Group AG | 0,08 | 83,70 | 4,79 | 78,89 | 0,9220 | 0,4405 | |||
| YAMHF / Yamaha Motor Co., Ltd. | 0,60 | 4,72 | 0,9087 | 0,9087 | |||||
| USB / U.S. Bancorp | 0,12 | 22,62 | 4,67 | 3,53 | 0,8983 | 0,0877 | |||
| NLY / Annaly Capital Management, Inc. | 0,24 | 44,95 | 4,65 | 48,06 | 0,8943 | 0,2985 | |||
| PRU / Prudential Financial, Inc. | 0,05 | -4,04 | 4,64 | -11,67 | 0,8934 | 0,0181 | |||
| RTX / RTX Corporation | 0,04 | -15,25 | 4,58 | -17,11 | 0,8816 | -0,1118 | |||
| HPQ / HP Inc. | 0,18 | -1,42 | 4,53 | -22,44 | 0,8729 | -0,1785 | |||
| SBUX / Starbucks Corporation | 0,05 | 22,04 | 4,27 | -9,28 | 0,8221 | -0,0243 | |||
| NKE / NIKE, Inc. | 0,08 | 79,54 | 4,24 | 31,68 | 0,8170 | 0,2374 | |||
| PEP / PepsiCo, Inc. | 0,03 | 19,52 | 4,21 | 7,54 | 0,8098 | 0,1064 | |||
| HON / Honeywell International Inc. | 0,02 | 0,01 | 4,19 | -5,89 | 0,8058 | 0,0058 | |||
| LMT / Lockheed Martin Corporation | 0,01 | 5,50 | 4,18 | 8,89 | 0,8043 | 0,1142 | |||
| ADP / Automatic Data Processing, Inc. | 0,01 | 4,13 | 0,7953 | 0,7953 | |||||
| CAT / Caterpillar Inc. | 0,01 | -3,98 | 4,05 | -20,04 | 0,7802 | -0,1314 | |||
| OMF / OneMain Holdings, Inc. | 0,08 | 4,00 | 0,7695 | 0,7695 | |||||
| UNP / Union Pacific Corporation | 0,02 | 9,56 | 3,93 | -4,63 | 0,7569 | 0,0154 | |||
| MO / Altria Group, Inc. | 0,07 | -2,38 | 3,86 | 10,56 | 0,7435 | 0,1153 | |||
| WHR / Whirlpool Corporation | 0,05 | 3,56 | 0,6851 | 0,6851 | |||||
| TPG / TPG Inc. | 0,08 | 3,50 | 0,6740 | 0,6740 | |||||
| CVX / Chevron Corporation | 0,03 | 2,94 | 3,45 | -6,12 | 0,6641 | 0,0033 | |||
| 1 / CK Hutchison Holdings Limited | 0,61 | 21,37 | 3,43 | 36,24 | 0,6607 | 0,2078 | |||
| H4W / Jardine Matheson Holdings Limited | 0,08 | 3,41 | 0,6556 | 0,6556 | |||||
| STLAP / Stellantis N.V. | 0,36 | 3,35 | 0,6457 | 0,6457 | |||||
| C6L / Singapore Airlines Limited | 0,64 | 3,28 | 0,6316 | 0,6316 | |||||
| UPS / United Parcel Service, Inc. | 0,03 | 32,88 | 3,24 | 10,84 | 0,6240 | 0,0982 | |||
| LIN / Linde plc | 0,01 | 6,43 | 3,22 | 8,13 | 0,6194 | 0,0843 | |||
| PCAR / PACCAR Inc | 0,03 | 8,07 | 3,00 | -12,09 | 0,5768 | -0,0360 | |||
| KHC / The Kraft Heinz Company | 0,10 | 2,85 | 0,5496 | 0,5496 | |||||
| RAND / Randstad N.V. | 0,07 | 36,09 | 2,77 | -4,92 | 0,5323 | -0,0199 | |||
| CA N / Carrefour SA | 0,18 | 2,76 | 0,5309 | 0,5309 | |||||
| NEE / NextEra Energy, Inc. | 0,04 | 5,23 | 2,46 | -1,64 | 0,4736 | 0,0238 | |||
| T / AT&T Inc. | 0,09 | -58,53 | 2,45 | -51,61 | 0,4725 | -0,4393 | |||
| VZ / Verizon Communications Inc. | 0,05 | -48,98 | 2,31 | -42,93 | 0,4445 | -0,2831 | |||
| SO / The Southern Company | 0,02 | 6,47 | 2,25 | 16,55 | 0,4326 | 0,0858 | |||
| DUK / Duke Energy Corporation | 0,02 | 7,77 | 2,16 | 17,43 | 0,4152 | 0,0849 | |||
| AMT / American Tower Corporation | 0,01 | -11,90 | 2,06 | 1,47 | 0,3975 | 0,0112 | |||
| DIS / The Walt Disney Company | 0,02 | 1,98 | 0,3817 | 0,3817 | |||||
| US31635A1051 / Fidelity Cash Central Fund | 1,83 | 289,01 | 1,83 | 289,17 | 0,3530 | 0,2682 | |||
| EOG / EOG Resources, Inc. | 0,02 | 10,87 | 1,79 | -2,77 | 0,3452 | 0,0136 | |||
| EXC / Exelon Corporation | 0,04 | 11,66 | 1,78 | 30,97 | 0,3419 | 0,0980 | |||
| CMCSA / Comcast Corporation | 0,05 | -46,96 | 1,73 | -46,11 | 0,3331 | -0,2443 | |||
| PLD / Prologis, Inc. | 0,02 | -3,87 | 1,67 | -17,65 | 0,3209 | -0,0429 | |||
| TMUS / T-Mobile US, Inc. | 0,01 | 1,64 | 0,3148 | 0,3148 | |||||
| D / Dominion Energy, Inc. | 0,03 | 11,84 | 1,60 | 9,42 | 0,3087 | 0,0451 | |||
| APD / Air Products and Chemicals, Inc. | 0,01 | 11,05 | 1,49 | -10,20 | 0,2864 | -0,0116 | |||
| CCI / Crown Castle Inc. | 0,01 | 4,36 | 1,46 | 23,62 | 0,2812 | 0,0687 | |||
| DVN / Devon Energy Corporation | 0,05 | 55,68 | 1,42 | 38,92 | 0,2729 | 0,0893 | |||
| O / Realty Income Corporation | 0,02 | 6,63 | 1,41 | 13,46 | 0,2712 | 0,0354 | |||
| EIX / Edison International | 0,03 | 59,90 | 1,38 | 58,53 | 0,2650 | 0,1088 | |||
| FANG / Diamondback Energy, Inc. | 0,01 | 1,34 | 0,2581 | 0,2581 | |||||
| FMC / FMC Corporation | 0,03 | 1,34 | 0,2574 | 0,2574 | |||||
| PSA / Public Storage | 0,00 | -12,80 | 1,32 | -12,26 | 0,2537 | -0,0163 | |||
| VICI / VICI Properties Inc. | 0,04 | -7,15 | 1,25 | -0,16 | 0,2405 | 0,0155 | |||
| SPG / Simon Property Group, Inc. | 0,01 | -24,61 | 1,23 | -31,76 | 0,2363 | -0,0871 | |||
| CHRD / Chord Energy Corporation | 0,01 | 1,17 | 0,2255 | 0,2255 | |||||
| IP / International Paper Company | 0,03 | 8,20 | 1,17 | -11,17 | 0,2251 | -0,0116 | |||
| AES / The AES Corporation | 0,12 | 1,17 | 0,2246 | 0,2246 | |||||
| VNOM / Viper Energy, Inc. | 0,03 | 1,16 | 0,2226 | 0,2226 | |||||
| AMCR / Amcor plc | 0,12 | 38,84 | 1,12 | 31,38 | 0,2161 | 0,0625 | |||
| DOW / Dow Inc. | 0,04 | 78,57 | 1,10 | 39,87 | 0,2114 | 0,0702 | |||
| LYB / LyondellBasell Industries N.V. | 0,02 | 69,73 | 0,98 | 30,45 | 0,1889 | 0,0537 | |||
| OHI / Omega Healthcare Investors, Inc. | 0,03 | -29,55 | 0,98 | -25,82 | 0,1882 | -0,0487 | |||
| GLPI / Gaming and Leisure Properties, Inc. | 0,02 | -15,01 | 0,97 | -15,94 | 0,1859 | -0,0207 | |||
| FVJ / Fortescue Ltd | 0,09 | 0,96 | 0,1839 | 0,1839 | |||||
| HST / Host Hotels & Resorts, Inc. | 0,06 | 0,84 | 0,1611 | 0,1611 | |||||
| EA / Electronic Arts Inc. | 0,01 | -72,38 | 0,84 | -67,39 | 0,1610 | -0,3001 | |||
| FOXA / Fox Corporation | 0,01 | -85,86 | 0,58 | -86,25 | 0,1109 | -0,6426 | |||
| NWSA / News Corporation | 0,02 | -80,89 | 0,56 | -81,60 | 0,1070 | -0,4355 | |||
| NYT / The New York Times Company | 0,01 | -79,99 | 0,56 | -80,82 | 0,1069 | -0,4136 | |||
| PARA / Paramount Global | 0,05 | -73,40 | 0,55 | -71,31 | 0,1067 | -0,2405 | |||
| OMC / Omnicom Group Inc. | 0,01 | -76,26 | 0,55 | -79,17 | 0,1051 | -0,3663 | |||
| IPG / The Interpublic Group of Companies, Inc. | 0,02 | -75,53 | 0,49 | -78,58 | 0,0948 | -0,3184 | |||
| NXST / Nexstar Media Group, Inc. | 0,00 | -78,02 | 0,48 | -78,53 | 0,0919 | -0,3078 | |||
| WMG / Warner Music Group Corp. | 0,02 | -78,01 | 0,47 | -78,98 | 0,0897 | -0,3082 | |||
| SIRI / Sirius XM Holdings Inc. | 0,02 | 0,42 | 0,0803 | 0,0803 | |||||
| ABN / ABN AMRO Bank N.V. - Depositary Receipt (Common Stock) | 0,29 | 0,25 | 0,0473 | 0,0473 | |||||
| UST BILLS 0% 05/29/2025 / DBT (US912797NN35) | 0,08 | 0,0163 | 0,0163 | ||||||
| S and P500 EMINI FUT JUN25 ESM5 / DE (N/A) | 0,02 | 0,0044 | 0,0044 | ||||||
| NEM / Newmont Corporation | 0,00 | -100,00 | 0,00 | -100,00 | -0,2399 | ||||
| 9104 / Mitsui O.S.K. Lines, Ltd. | 0,00 | -100,00 | 0,00 | -100,00 | -0,4372 | ||||
| SP500 MIC EMIN FUTJUN25 HWAM5 / DE (N/A) | -0,01 | -0,0022 | -0,0022 |