Grundlæggende statistik
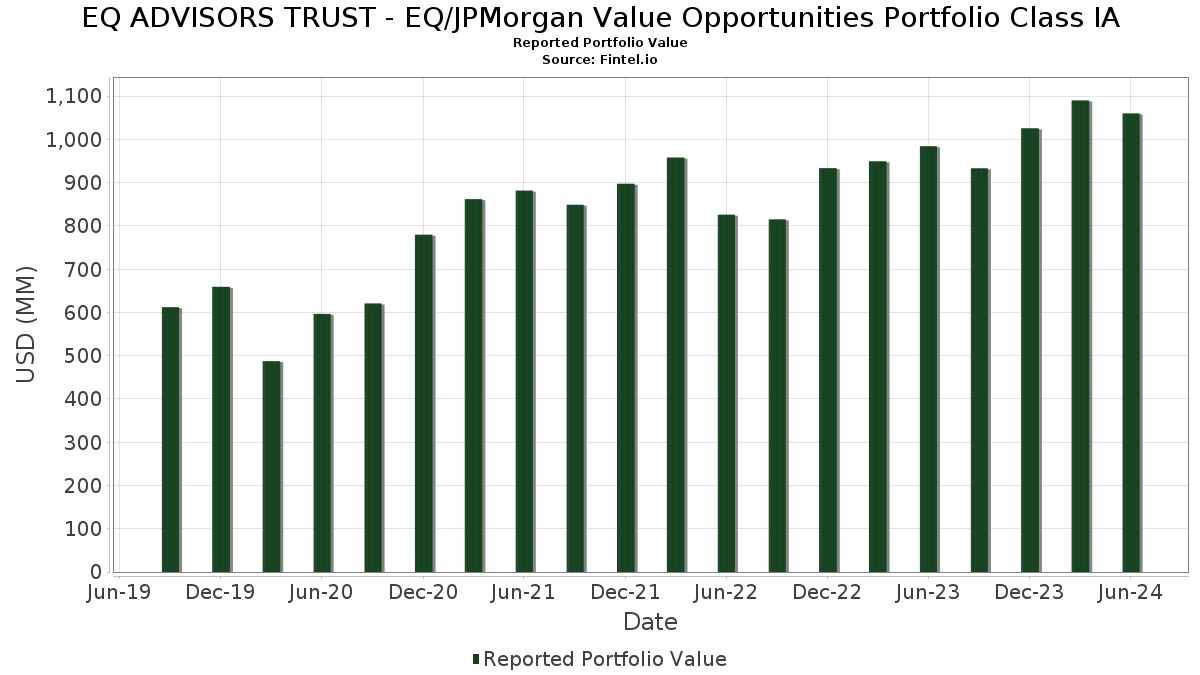
| Porteføljeværdi | $ 1.059.950.051 |
| Nuværende stillinger | 106 |
Seneste beholdninger, ydeevne, AUM (fra 13F, 13D)
EQ ADVISORS TRUST - EQ/JPMorgan Value Opportunities Portfolio Class IA har afsløret 106 samlede besiddelser i deres seneste SEC-arkivering. Den seneste porteføljeværdi er beregnet til at være $ 1.059.950.051 USD. Faktiske aktiver under forvaltning (AUM) er denne værdi plus kontanter (som ikke er oplyst). EQ ADVISORS TRUST - EQ/JPMorgan Value Opportunities Portfolio Class IAs største beholdninger er Exxon Mobil Corporation (US:XOM) , Chevron Corporation (US:CVX) , Berkshire Hathaway Inc. (US:BRK.B) , CVS Health Corporation (US:CVS) , and Citigroup Inc. (US:C) . EQ ADVISORS TRUST - EQ/JPMorgan Value Opportunities Portfolio Class IAs nye stillinger omfatter FED HM LN BK BD 7/1/2020 (US:US313384YV57) , Corning Incorporated (US:GLW) , GE Vernova Inc. (US:GEV) , American Tower Corporation (US:AMT) , and AutoZone, Inc. (US:AZO) .
Top øger dette kvartal
Vi bruger ændringen i porteføljeallokeringen, fordi dette er den mest meningsfulde metrik. Ændringer kan skyldes handler eller ændringer i aktiekurser.
| Sikkerhed | Aktier (MM) |
Værdi (MM$) |
Portefølje % | ΔPortefølje % |
|---|---|---|---|---|
| 0,08 | 15,89 | 1,4981 | 1,4981 | |
| 0,33 | 37,76 | 3,5612 | 1,4211 | |
| 0,21 | 13,81 | 1,3023 | 1,3023 | |
| 0,33 | 12,67 | 1,1952 | 1,1952 | |
| 0,27 | 22,36 | 2,1082 | 1,1681 | |
| 0,48 | 28,39 | 2,6774 | 1,1066 | |
| 0,05 | 13,88 | 1,3089 | 0,8331 | |
| 0,29 | 18,00 | 1,6975 | 0,8163 | |
| 0,09 | 7,54 | 0,7113 | 0,7113 | |
| 0,19 | 12,38 | 1,1672 | 0,6811 |
Top falder i dette kvartal
Vi bruger ændringen i porteføljeallokeringen, fordi dette er den mest meningsfulde metrik. Ændringer kan skyldes handler eller ændringer i aktiekurser.
| Sikkerhed | Aktier (MM) |
Værdi (MM$) |
Portefølje % | ΔPortefølje % |
|---|---|---|---|---|
| 0,65 | 25,90 | 2,4425 | -2,3966 | |
| 0,10 | 15,33 | 1,4460 | -1,0938 | |
| 0,02 | 5,03 | 0,4745 | -1,0377 | |
| 0,08 | 6,08 | 0,5732 | -0,9983 | |
| 0,12 | 5,04 | 0,4757 | -0,8568 | |
| 0,14 | 5,37 | 0,5063 | -0,8313 | |
| 0,10 | 7,21 | 0,6801 | -0,7706 | |
| 0,01 | 2,22 | 0,2096 | -0,7690 | |
| 0,00 | 0,00 | -0,7348 | ||
| 0,02 | 2,70 | 0,2546 | -0,7318 |
13F og Fondsarkivering
Denne formular blev indsendt den 2024-08-26 for rapporteringsperioden 2024-06-30. Klik på linkikonet for at se den fulde transaktionshistorik.
Opgrader for at låse op for premium-data og eksportere til Excel ![]() .
.
| Sikkerhed | Type | Gennemsnitlig aktiekurs | Aktier (MM) |
Δ Aktier (%) |
Δ Aktier (%) |
Værdi ($MM) |
Portefølje (%) |
ΔPortefølje (%) |
|
|---|---|---|---|---|---|---|---|---|---|
| XOM / Exxon Mobil Corporation | 0,33 | 63,28 | 37,76 | 61,71 | 3,5612 | 1,4211 | |||
| CVX / Chevron Corporation | 0,23 | -6,76 | 35,49 | -7,54 | 3,3471 | -0,1707 | |||
| BRK.B / Berkshire Hathaway Inc. | 0,08 | -0,68 | 32,69 | -3,92 | 3,0824 | -0,0352 | |||
| CVS / CVS Health Corporation | 0,48 | 123,69 | 28,39 | 65,64 | 2,6774 | 1,1066 | |||
| C / Citigroup Inc. | 0,43 | -10,77 | 27,52 | -10,46 | 2,5950 | -0,2214 | |||
| BAC / Bank of America Corporation | 0,65 | -53,23 | 25,90 | -50,95 | 2,4425 | -2,3966 | |||
| ABBV / AbbVie Inc. | 0,13 | 29,69 | 22,66 | 22,16 | 2,1371 | 0,4371 | |||
| LW / Lamb Weston Holdings, Inc. | 0,27 | 176,10 | 22,36 | 117,93 | 2,1082 | 1,1681 | |||
| TFC / Truist Financial Corporation | 0,56 | -21,53 | 21,81 | -21,80 | 2,0570 | -0,4989 | |||
| CAH / Cardinal Health, Inc. | 0,20 | 26,71 | 19,76 | 11,34 | 1,8635 | 0,2370 | |||
| BMY / Bristol-Myers Squibb Company | 0,47 | 27,09 | 19,60 | -2,68 | 1,8482 | 0,0029 | |||
| EMR / Emerson Electric Co. | 0,17 | 34,60 | 19,26 | 30,73 | 1,8164 | 0,4662 | |||
| TSM / Taiwan Semiconductor Manufacturing Company Limited - Depositary Receipt (Common Stock) | 0,11 | -1,05 | 18,70 | 26,41 | 1,7631 | 0,4077 | |||
| CARR / Carrier Global Corporation | 0,29 | 72,50 | 18,00 | 87,20 | 1,6975 | 0,8163 | |||
| DLR / Digital Realty Trust, Inc. | 0,12 | 34,84 | 17,86 | 42,34 | 1,6841 | 0,5344 | |||
| PM / Philip Morris International Inc. | 0,17 | 40,34 | 17,58 | 55,21 | 1,6583 | 0,6201 | |||
| HON / Honeywell International Inc. | 0,08 | 38,40 | 17,11 | 44,00 | 1,6137 | 0,5246 | |||
| UNH / UnitedHealth Group Incorporated | 0,03 | 14,02 | 17,07 | 15,17 | 1,6099 | 0,0223 | |||
| SBAC / SBA Communications Corporation | 0,08 | 15,89 | 1,4981 | 1,4981 | |||||
| STX / Seagate Technology Holdings plc | 0,15 | -1,22 | 15,62 | 9,63 | 1,4728 | 0,1673 | |||
| FI / Fiserv, Inc. | 0,10 | -40,67 | 15,33 | -44,68 | 1,4460 | -1,0938 | |||
| US313384YV57 / FED HM LN BK BD 7/1/2020 | 15,02 | 33,66 | 1,4163 | -0,4642 | |||||
| MCD / McDonald's Corporation | 0,06 | 41,74 | 14,67 | 56,38 | 1,3830 | 0,3161 | |||
| CPAY / Corpay, Inc. | 0,05 | 209,60 | 13,88 | 167,37 | 1,3089 | 0,8331 | |||
| ELS / Equity LifeStyle Properties, Inc. | 0,21 | 13,81 | 1,3023 | 1,3023 | |||||
| EQIX / Equinix, Inc. | 0,02 | 43,30 | 13,66 | 50,37 | 1,2883 | 0,3333 | |||
| FDX / FedEx Corporation | 0,04 | -14,82 | 13,33 | -11,85 | 1,2573 | -0,1287 | |||
| FITB / Fifth Third Bancorp | 0,36 | -7,95 | 13,29 | -9,73 | 1,2537 | -0,0960 | |||
| VTR / Ventas, Inc. | 0,26 | -1,04 | 13,17 | 16,50 | 1,2422 | 0,2061 | |||
| WFC / Wells Fargo & Company | 0,22 | 21,00 | 13,07 | 23,98 | 1,2324 | 0,2665 | |||
| TRV / The Travelers Companies, Inc. | 0,06 | -2,27 | 12,80 | -13,65 | 1,2069 | -0,1513 | |||
| GLW / Corning Incorporated | 0,33 | 12,67 | 1,1952 | 1,1952 | |||||
| NEE / NextEra Energy, Inc. | 0,18 | 0,31 | 12,45 | 11,15 | 1,1742 | 0,1476 | |||
| MDLZ / Mondelez International, Inc. | 0,19 | 189,19 | 12,38 | 172,72 | 1,1672 | 0,6811 | |||
| FCX / Freeport-McMoRan Inc. | 0,25 | 26,07 | 12,33 | 30,31 | 1,1632 | 0,2957 | |||
| PFGC / Performance Food Group Company | 0,18 | -7,90 | 12,07 | -18,43 | 1,1380 | -0,2177 | |||
| WMT / Walmart Inc. | 0,18 | -33,64 | 11,95 | -25,33 | 1,1273 | -0,3397 | |||
| BJ / BJ's Wholesale Club Holdings, Inc. | 0,14 | 10,03 | 11,95 | 27,77 | 1,1268 | 0,2698 | |||
| TOL / Toll Brothers, Inc. | 0,10 | 39,61 | 11,92 | 24,29 | 1,1238 | 0,2452 | |||
| CC / The Chemours Company | 0,51 | -8,66 | 11,44 | -21,49 | 1,0788 | -0,2565 | |||
| CCL / Carnival Corporation & plc | 0,60 | 51,41 | 11,24 | 73,48 | 1,0598 | 0,4661 | |||
| FIS / Fidelity National Information Services, Inc. | 0,15 | -34,60 | 11,17 | -33,56 | 1,0532 | -0,4872 | |||
| REGN / Regeneron Pharmaceuticals, Inc. | 0,01 | 28,40 | 10,12 | 40,22 | 0,9545 | 0,2930 | |||
| XEL / Xcel Energy Inc. | 0,18 | 44,07 | 9,70 | 43,16 | 0,9147 | 0,2938 | |||
| EQR / Equity Residential | 0,14 | 11,23 | 9,48 | 22,20 | 0,8939 | 0,1831 | |||
| AER / AerCap Holdings N.V. | 0,09 | -44,62 | 8,38 | -40,62 | 0,7905 | -0,5031 | |||
| D / Dominion Energy, Inc. | 0,17 | 40,29 | 8,36 | 39,74 | 0,7884 | 0,2402 | |||
| SQ / Block, Inc. | 0,13 | 92,83 | 8,17 | 47,05 | 0,7707 | 0,2613 | |||
| TT / Trane Technologies plc | 0,02 | 38,95 | 8,17 | 52,26 | 0,7703 | 0,2786 | |||
| TMO / Thermo Fisher Scientific Inc. | 0,01 | -1,97 | 7,91 | -6,73 | 0,7464 | -0,0313 | |||
| GPK / Graphic Packaging Holding Company | 0,29 | -1,45 | 7,59 | -11,48 | 0,7154 | -0,0700 | |||
| NTRS / Northern Trust Corporation | 0,09 | 7,54 | 0,7113 | 0,7113 | |||||
| CSX / CSX Corporation | 0,22 | -40,78 | 7,43 | -46,56 | 0,7009 | -0,5737 | |||
| MET / MetLife, Inc. | 0,10 | -51,90 | 7,21 | -54,44 | 0,6801 | -0,7706 | |||
| GEV / GE Vernova Inc. | 0,04 | 6,79 | 0,6403 | 0,6403 | |||||
| MCHP / Microchip Technology Incorporated | 0,07 | -22,59 | 6,62 | -21,04 | 0,6238 | -0,1440 | |||
| BIIB / Biogen Inc. | 0,03 | 94,33 | 6,49 | 108,92 | 0,6120 | 0,3273 | |||
| VZ / Verizon Communications Inc. | 0,15 | 18,74 | 6,18 | 16,69 | 0,5828 | 0,0975 | |||
| MDT / Medtronic plc | 0,08 | -60,75 | 6,08 | -64,56 | 0,5732 | -0,9983 | |||
| NOC / Northrop Grumman Corporation | 0,01 | -20,59 | 5,95 | -22,59 | 0,5615 | -0,2401 | |||
| CMS / CMS Energy Corporation | 0,10 | -2,06 | 5,92 | -3,38 | 0,5586 | -0,0032 | |||
| DAL / Delta Air Lines, Inc. | 0,12 | -31,32 | 5,90 | -31,94 | 0,5565 | -0,2380 | |||
| BKR / Baker Hughes Company | 0,17 | -1,04 | 5,88 | 3,89 | 0,5548 | 0,0359 | |||
| AMT / American Tower Corporation | 0,03 | 5,84 | 0,5505 | 0,5505 | |||||
| CHTR / Charter Communications, Inc. | 0,02 | -39,21 | 5,83 | -53,25 | 0,5502 | -0,6671 | |||
| AZO / AutoZone, Inc. | 0,00 | 5,67 | 0,5347 | 0,5347 | |||||
| MHK / Mohawk Industries, Inc. | 0,05 | -43,23 | 5,62 | -50,74 | 0,5302 | -0,5156 | |||
| MAS / Masco Corporation | 0,08 | -1,25 | 5,50 | -16,55 | 0,5190 | -0,0853 | |||
| SCHW / The Charles Schwab Corporation | 0,07 | -51,13 | 5,50 | -50,22 | 0,5186 | -0,4937 | |||
| RCL / Royal Caribbean Cruises Ltd. | 0,03 | -40,10 | 5,48 | -31,31 | 0,5169 | -0,2143 | |||
| WMG / Warner Music Group Corp. | 0,18 | 5,45 | 0,5137 | 0,5137 | |||||
| ADM / Archer-Daniels-Midland Company | 0,09 | -0,98 | 5,40 | -4,70 | 0,5088 | -0,0100 | |||
| CMCSA / Comcast Corporation | 0,14 | -56,15 | 5,37 | -60,84 | 0,5063 | -0,8313 | |||
| NI / NiSource Inc. | 0,18 | 5,30 | 0,4997 | 0,4997 | |||||
| JNJ / Johnson & Johnson | 0,04 | -29,28 | 5,26 | -37,56 | 0,4961 | -0,3660 | |||
| SLGN / Silgan Holdings Inc. | 0,12 | -60,20 | 5,04 | -65,31 | 0,4757 | -0,8568 | |||
| NXPI / NXP Semiconductors N.V. | 0,02 | -71,92 | 5,03 | -69,51 | 0,4745 | -1,0377 | |||
| KTB / Kontoor Brands, Inc. | 0,07 | -54,18 | 4,94 | -49,70 | 0,4655 | -0,4336 | |||
| BMRN / BioMarin Pharmaceutical Inc. | 0,06 | 11,87 | 4,93 | 5,46 | 0,4647 | 0,0365 | |||
| CME / CME Group Inc. | 0,02 | 817,34 | 4,89 | 873,51 | 0,4609 | 0,4095 | |||
| HSY / The Hershey Company | 0,02 | 4,52 | 0,4264 | 0,4264 | |||||
| IP / International Paper Company | 0,10 | 4,19 | 0,3950 | 0,3950 | |||||
| US7587501039 / Regal-Beloit Corp. | 0,03 | 100,36 | 4,12 | 50,44 | 0,3885 | 0,1375 | |||
| VRTX / Vertex Pharmaceuticals Incorporated | 0,01 | 41,32 | 3,97 | 58,45 | 0,3748 | 0,1450 | |||
| WBD / Warner Bros. Discovery, Inc. | 0,53 | -43,55 | 3,92 | -51,90 | 0,3698 | -0,3772 | |||
| TDG / TransDigm Group Incorporated | 0,00 | 3,88 | 0,3655 | 0,3655 | |||||
| HPE / Hewlett Packard Enterprise Company | 0,18 | -43,29 | 3,79 | -15,75 | 0,3572 | -0,1744 | |||
| AA / Alcoa Corporation | 0,09 | -41,58 | 3,65 | -31,22 | 0,3445 | -0,1423 | |||
| UBER / Uber Technologies, Inc. | 0,05 | 3,63 | 0,3419 | 0,3419 | |||||
| NBIX / Neurocrine Biosciences, Inc. | 0,02 | -18,92 | 3,35 | 14,50 | 0,3158 | -0,0384 | |||
| MTG / MGIC Investment Corporation | 0,15 | 3,30 | 0,3112 | 0,3112 | |||||
| AON / Aon plc | 0,01 | 3,16 | 0,2980 | 0,2980 | |||||
| MPC / Marathon Petroleum Corporation | 0,02 | -34,65 | 3,15 | -43,74 | 0,2971 | -0,2161 | |||
| NVT / nVent Electric plc | 0,04 | 3,06 | 0,2883 | 0,2883 | |||||
| BAX / Baxter International Inc. | 0,09 | -1,04 | 2,96 | -22,54 | 0,2791 | -0,0711 | |||
| NXT / Nextracker Inc. | 0,06 | 2,92 | 0,2750 | 0,2750 | |||||
| CPRI / Capri Holdings Limited | 0,08 | -1,38 | 2,77 | -27,99 | 0,2609 | -0,0912 | |||
| ORCL / Oracle Corporation | 0,02 | -80,06 | 2,70 | -73,30 | 0,2546 | -0,7318 | |||
| FCNCA / First Citizens BancShares, Inc. | 0,00 | 2,70 | 0,2542 | 0,2542 | |||||
| LYV / Live Nation Entertainment, Inc. | 0,03 | 2,49 | 0,2346 | 0,2346 | |||||
| AES / The AES Corporation | 0,14 | 2,44 | 0,2298 | 0,2298 | |||||
| FSLR / First Solar, Inc. | 0,01 | -82,28 | 2,30 | 10,78 | 0,2171 | -0,2088 | |||
| AMZN / Amazon.com, Inc. | 0,01 | -80,58 | 2,22 | -79,19 | 0,2096 | -0,7690 | |||
| ICE / Intercontinental Exchange, Inc. | 0,02 | -62,59 | 2,15 | -60,14 | 0,2024 | -0,3227 | |||
| SIRI / Sirius XM Holdings Inc. | 0,34 | 0,96 | 0,0906 | 0,0906 | |||||
| Viking Holdings Ltd. / EC (BMG93A5A1010) | 0,00 | 0,12 | 0,0113 | 0,0113 | |||||
| ILMN / Illumina, Inc. | 0,00 | -100,00 | 0,00 | -100,00 | -0,2659 | ||||
| GE / General Electric Company | 0,00 | -100,00 | 0,00 | -100,00 | -0,3005 | ||||
| LHX / L3Harris Technologies, Inc. | 0,00 | -100,00 | 0,00 | -100,00 | -0,2363 | ||||
| META / Meta Platforms, Inc. | 0,00 | -100,00 | 0,00 | -100,00 | -0,7348 | ||||
| AAL / American Airlines Group Inc. | 0,00 | -100,00 | 0,00 | -100,00 | -0,4811 |