Grundlæggende statistik
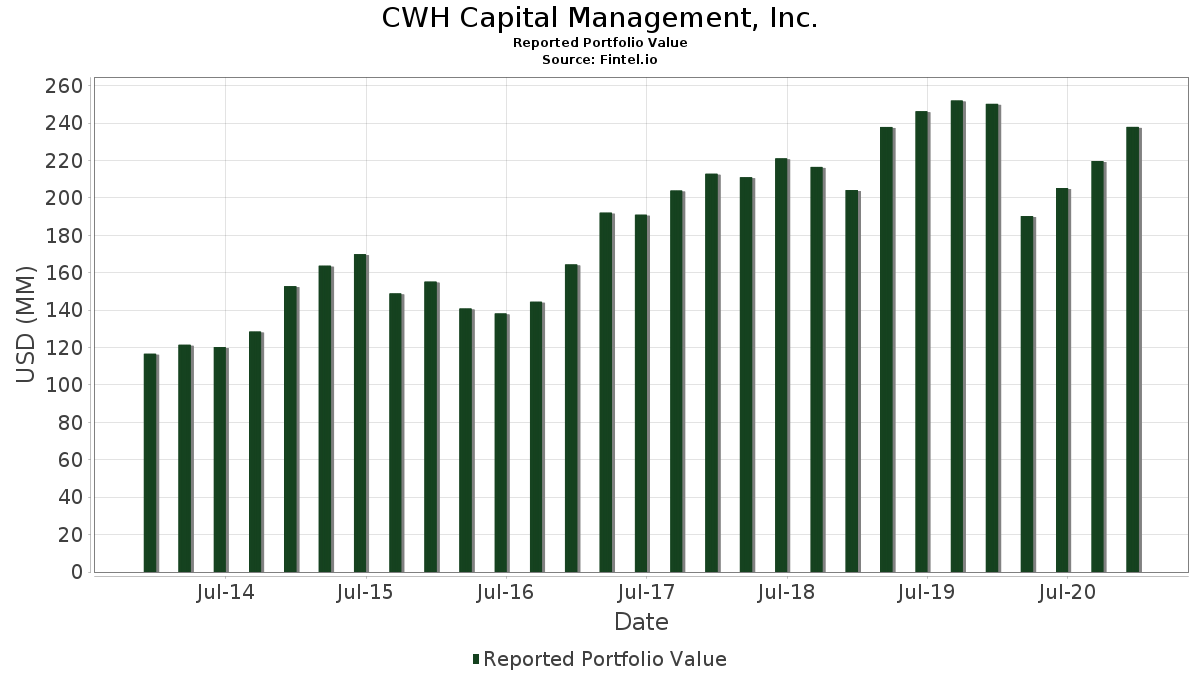
| Porteføljeværdi | $ 237.994.000 |
| Nuværende stillinger | 92 |
Seneste beholdninger, ydeevne, AUM (fra 13F, 13D)
CWH Capital Management, Inc. har afsløret 92 samlede besiddelser i deres seneste SEC-arkivering. Den seneste porteføljeværdi er beregnet til at være $ 237.994.000 USD. Faktiske aktiver under forvaltning (AUM) er denne værdi plus kontanter (som ikke er oplyst). CWH Capital Management, Inc.s største beholdninger er iShares Trust - iShares Core U.S. Aggregate Bond ETF (US:AGG) , Invesco Actively Managed Exchange-Traded Fund Trust - Invesco Ultra Short Duration ETF (US:GSY) , J.P. Morgan Exchange-Traded Fund Trust - JPMorgan Ultra-Short Income ETF (US:JPST) , Vanguard Index Funds - Vanguard Small-Cap Growth ETF (US:VBK) , and Schwab Strategic Trust - Schwab U.S. Dividend Equity ETF (US:SCHD) . CWH Capital Management, Inc.s nye stillinger omfatter Schwab Strategic Trust - Schwab U.S. Dividend Equity ETF (US:SCHD) , Vanguard Index Funds - Vanguard Mid-Cap Value ETF (US:VOE) , Vertex Pharmaceuticals Incorporated (US:VRTX) , Tyson Foods, Inc. (US:TSN) , and Fidelity National Financial, Inc. (US:FNF) .
Top øger dette kvartal
Vi bruger ændringen i porteføljeallokeringen, fordi dette er den mest meningsfulde metrik. Ændringer kan skyldes handler eller ændringer i aktiekurser.
| Sikkerhed | Aktier (MM) |
Værdi (MM$) |
Portefølje % | ΔPortefølje % |
|---|---|---|---|---|
| 0,18 | 11,60 | 4,8737 | 4,8737 | |
| 0,07 | 8,36 | 3,5135 | 3,5135 | |
| 0,02 | 4,48 | 1,8811 | 1,8811 | |
| 0,01 | 4,43 | 1,8614 | 1,8614 | |
| 0,01 | 3,54 | 1,4870 | 1,4870 | |
| 0,04 | 2,52 | 1,0605 | 1,0605 | |
| 0,14 | 6,69 | 2,8097 | 0,9814 | |
| 0,05 | 12,13 | 5,0955 | 0,6903 | |
| 0,11 | 6,02 | 2,5299 | 0,6260 | |
| 0,04 | 5,52 | 2,3181 | 0,3651 |
Top falder i dette kvartal
Vi bruger ændringen i porteføljeallokeringen, fordi dette er den mest meningsfulde metrik. Ændringer kan skyldes handler eller ændringer i aktiekurser.
| Sikkerhed | Aktier (MM) |
Værdi (MM$) |
Portefølje % | ΔPortefølje % |
|---|---|---|---|---|
| 0,00 | 0,49 | 0,2046 | -3,9780 | |
| 0,01 | 0,33 | 0,1366 | -3,0036 | |
| 0,11 | 4,20 | 1,7643 | -2,3706 | |
| 0,02 | 5,53 | 2,3253 | -1,6672 | |
| 0,05 | 5,00 | 2,1005 | -1,5266 | |
| 0,00 | 0,00 | -1,3860 | ||
| 0,30 | 15,36 | 6,4518 | -1,2669 | |
| 0,03 | 6,52 | 2,7379 | -0,8268 | |
| 0,28 | 14,17 | 5,9523 | -0,6275 | |
| 0,00 | 0,00 | -0,5802 |
13F og Fondsarkivering
Denne formular blev indsendt den 2021-02-02 for rapporteringsperioden 2020-12-31. Klik på linkikonet for at se den fulde transaktionshistorik.
Opgrader for at låse op for premium-data og eksportere til Excel ![]() .
.
| Sikkerhed | Type | Gennemsnitlig aktiekurs | Aktier (MM) |
Δ Aktier (%) |
Δ Aktier (%) |
Værdi ($MM) |
Portefølje (%) |
ΔPortefølje (%) |
|
|---|---|---|---|---|---|---|---|---|---|
| AGG / iShares Trust - iShares Core U.S. Aggregate Bond ETF | 0,16 | 6,23 | 18,85 | 6,35 | 7,9216 | -0,1452 | |||
| GSY / Invesco Actively Managed Exchange-Traded Fund Trust - Invesco Ultra Short Duration ETF | 0,30 | -9,59 | 15,36 | -9,48 | 6,4518 | -1,2669 | |||
| JPST / J.P. Morgan Exchange-Traded Fund Trust - JPMorgan Ultra-Short Income ETF | 0,28 | -2,02 | 14,17 | -2,03 | 5,9523 | -0,6275 | |||
| VBK / Vanguard Index Funds - Vanguard Small-Cap Growth ETF | 0,05 | 0,59 | 12,13 | 25,27 | 5,0955 | 0,6903 | |||
| SCHD / Schwab Strategic Trust - Schwab U.S. Dividend Equity ETF | 0,18 | 11,60 | 4,8737 | 4,8737 | |||||
| IWP / iShares Trust - iShares Russell Mid-Cap Growth ETF | 0,08 | 71,47 | 8,43 | 1,82 | 3,5413 | -0,2250 | |||
| CMCSA / Comcast Corporation | 0,16 | -4,05 | 8,37 | 8,67 | 3,5177 | 0,0122 | |||
| VOE / Vanguard Index Funds - Vanguard Mid-Cap Value ETF | 0,07 | 8,36 | 3,5135 | 3,5135 | |||||
| WAB / Westinghouse Air Brake Technologies Corporation | 0,09 | 3,35 | 6,70 | 22,27 | 2,8165 | 0,3220 | |||
| LYFT / Lyft, Inc. | 0,14 | -6,68 | 6,69 | 66,43 | 2,8097 | 0,9814 | |||
| MSFT / Microsoft Corporation | 0,03 | -21,35 | 6,52 | -16,82 | 2,7379 | -0,8268 | |||
| SCHW / The Charles Schwab Corporation | 0,11 | -1,70 | 6,02 | 43,91 | 2,5299 | 0,6260 | |||
| FDX / FedEx Corporation | 0,02 | -3,88 | 5,86 | -0,78 | 2,4606 | -0,2250 | |||
| QQQ / Invesco QQQ Trust, Series 1 | 0,02 | -44,14 | 5,53 | -36,93 | 2,3253 | -1,6672 | |||
| JPM / JPMorgan Chase & Co. | 0,04 | -2,62 | 5,52 | 28,54 | 2,3181 | 0,3651 | |||
| ABBV / AbbVie Inc. | 0,05 | -48,74 | 5,00 | -37,29 | 2,1005 | -1,5266 | |||
| KR / The Kroger Co. | 0,15 | -3,85 | 4,92 | -9,94 | 2,0673 | -0,4186 | |||
| AAPL / Apple Inc. | 0,04 | -2,97 | 4,85 | 11,16 | 2,0374 | 0,0526 | |||
| ULTA / Ulta Beauty, Inc. | 0,02 | -1,92 | 4,48 | 25,76 | 1,8811 | 1,8811 | |||
| NOC / Northrop Grumman Corporation | 0,01 | 1,20 | 4,43 | -2,27 | 1,8614 | 1,8614 | |||
| XLRE / The Select Sector SPDR Trust - The Real Estate Select Sector SPDR Fund | 0,11 | -55,42 | 4,20 | -53,79 | 1,7643 | -2,3706 | |||
| GOOGL / Alphabet Inc. | 0,00 | -3,43 | 4,19 | 15,49 | 1,7610 | 0,1097 | |||
| GDDY / GoDaddy Inc. | 0,05 | 4,89 | 4,07 | 14,51 | 1,7080 | 0,0927 | |||
| HD / The Home Depot, Inc. | 0,01 | -0,17 | 3,96 | -4,51 | 1,6618 | -0,2229 | |||
| VRTX / Vertex Pharmaceuticals Incorporated | 0,01 | 3,54 | 1,4870 | 1,4870 | |||||
| RHI / Robert Half Inc. | 0,06 | -0,18 | 3,44 | 17,81 | 1,4454 | 0,1167 | |||
| JNJ / Johnson & Johnson | 0,02 | 5,66 | 3,11 | 11,71 | 1,3063 | 0,0400 | |||
| IVW / iShares Trust - iShares S&P 500 Growth ETF | 0,05 | 289,58 | 2,91 | 7,62 | 1,2219 | -0,0076 | |||
| FAF / First American Financial Corporation | 0,06 | -3,71 | 2,89 | -2,33 | 1,2135 | -0,1321 | |||
| TSN / Tyson Foods, Inc. | 0,04 | 2,52 | 1,0605 | 1,0605 | |||||
| FIBK / First Interstate BancSystem, Inc. | 0,05 | -1,00 | 1,99 | 26,69 | 0,8357 | 0,1213 | |||
| SCHX / Schwab Strategic Trust - Schwab U.S. Large-Cap ETF | 0,02 | -1,27 | 1,91 | 11,38 | 0,8017 | 0,0222 | |||
| VEA / Vanguard Tax-Managed Funds - Vanguard FTSE Developed Markets ETF | 0,04 | -0,16 | 1,78 | 15,25 | 0,7462 | 0,0450 | |||
| COST / Costco Wholesale Corporation | 0,00 | -14,70 | 1,10 | -9,45 | 0,4630 | -0,0907 | |||
| USFR / WisdomTree Trust - WisdomTree Floating Rate Treasury Fund | 0,04 | -24,24 | 1,08 | -24,28 | 0,4521 | -0,1945 | |||
| SBUX / Starbucks Corporation | 0,01 | -9,96 | 1,03 | 12,13 | 0,4349 | 0,0149 | |||
| V / Visa Inc. | 0,00 | -20,59 | 1,00 | -13,09 | 0,4185 | -0,1030 | |||
| SYK / Stryker Corporation | 0,00 | 0,00 | 0,96 | 17,58 | 0,4046 | 0,0320 | |||
| CSCO / Cisco Systems, Inc. | 0,02 | 88,19 | 0,74 | 113,51 | 0,3122 | 0,1538 | |||
| NTAP / NetApp, Inc. | 0,01 | 74,94 | 0,73 | 164,62 | 0,3080 | 0,3080 | |||
| HPQ / HP Inc. | 0,03 | 69,71 | 0,70 | 119,69 | 0,2954 | 0,1498 | |||
| EVR / Evercore Inc. | 0,01 | 32,22 | 0,70 | 121,52 | 0,2941 | 0,2941 | |||
| MS / Morgan Stanley | 0,01 | 67,98 | 0,69 | 137,67 | 0,2916 | 0,1587 | |||
| BANR / Banner Corporation | 0,01 | -5,58 | 0,69 | 36,31 | 0,2887 | 0,0593 | |||
| BAC / Bank of America Corporation | 0,02 | 24,46 | 0,68 | 56,61 | 0,2836 | 0,0875 | |||
| PNC / The PNC Financial Services Group, Inc. | 0,00 | 76,03 | 0,67 | 138,35 | 0,2794 | 0,2794 | |||
| LYB / LyondellBasell Industries N.V. | 0,01 | 65,74 | 0,66 | 115,74 | 0,2765 | 0,1377 | |||
| MMM / 3M Company | 0,00 | 57,38 | 0,65 | 71,58 | 0,2740 | 0,1010 | |||
| QCOM / QUALCOMM Incorporated | 0,00 | 7,40 | 0,64 | 38,88 | 0,2702 | 0,0595 | |||
| IPG / The Interpublic Group of Companies, Inc. | 0,03 | 73,78 | 0,64 | 145,38 | 0,2681 | 0,1498 | |||
| AVGO / Broadcom Inc. | 0,00 | 57,14 | 0,63 | 88,92 | 0,2651 | 0,1132 | |||
| EMN / Eastman Chemical Company | 0,01 | 52,88 | 0,63 | 95,96 | 0,2651 | 0,1186 | |||
| IBM / International Business Machines Corporation | 0,00 | 77,88 | 0,63 | 84,41 | 0,2635 | 0,1087 | |||
| FNF / Fidelity National Financial, Inc. | 0,02 | 0,61 | 0,2571 | 0,2571 | |||||
| CAT / Caterpillar Inc. | 0,00 | 56,27 | 0,61 | 90,60 | 0,2555 | 0,2555 | |||
| TSLA / Tesla, Inc. | 0,00 | 0,00 | 0,60 | 64,31 | 0,2534 | 0,0864 | |||
| ETN / Eaton Corporation plc | 0,00 | 60,90 | 0,60 | 89,56 | 0,2517 | 0,2517 | |||
| TXN / Texas Instruments Incorporated | 0,00 | 58,88 | 0,58 | 82,39 | 0,2437 | 0,0990 | |||
| AQN / Algonquin Power & Utilities Corp. | 0,04 | 65,69 | 0,58 | 87,95 | 0,2424 | 0,1027 | |||
| VYMI / Vanguard Whitehall Funds - Vanguard International High Dividend Yield ETF | 0,01 | 86,45 | 0,58 | 117,36 | 0,2420 | 0,2420 | |||
| INTC / Intel Corporation | 0,01 | 0,57 | 0,2416 | 0,2416 | |||||
| T / AT&T Inc. | 0,02 | 92,76 | 0,57 | 94,56 | 0,2403 | 0,1066 | |||
| TROW / T. Rowe Price Group, Inc. | 0,00 | 69,86 | 0,57 | 100,70 | 0,2403 | 0,2403 | |||
| LEG / Leggett & Platt, Incorporated | 0,01 | 61,12 | 0,57 | 73,48 | 0,2391 | 0,2391 | |||
| UNP / Union Pacific Corporation | 0,00 | 68,12 | 0,57 | 77,81 | 0,2391 | 0,2391 | |||
| PEY / Invesco Exchange-Traded Fund Trust - Invesco High Yield Equity Dividend Achievers ETF | 0,03 | 75,26 | 0,57 | 111,94 | 0,2387 | 0,1167 | |||
| VNQ / Vanguard Specialized Funds - Vanguard Real Estate ETF | 0,01 | 0,00 | 0,56 | 7,50 | 0,2349 | -0,0017 | |||
| DGRW / WisdomTree Trust - WisdomTree U.S. Quality Dividend Growth Fund | 0,01 | 85,06 | 0,56 | 101,45 | 0,2336 | 0,2336 | |||
| WSM / Williams-Sonoma, Inc. | 0,01 | 41,55 | 0,55 | 59,54 | 0,2319 | 0,0745 | |||
| GBCI / Glacier Bancorp, Inc. | 0,01 | 0,00 | 0,54 | 43,65 | 0,2282 | 0,0562 | |||
| PSB / PS Business Parks, Inc. | 0,00 | 102,89 | 0,54 | 119,92 | 0,2273 | 0,2273 | |||
| EXR / Extra Space Storage Inc. | 0,00 | 66,05 | 0,54 | 80,00 | 0,2269 | 0,2269 | |||
| WBA / Walgreens Boots Alliance, Inc. | 0,01 | 110,71 | 0,54 | 133,77 | 0,2269 | 0,1218 | |||
| GD / General Dynamics Corporation | 0,00 | 93,87 | 0,54 | 108,56 | 0,2252 | 0,2252 | |||
| CMI / Cummins Inc. | 0,00 | 45,95 | 0,53 | 56,93 | 0,2235 | 0,2235 | |||
| OGE / OGE Energy Corp. | 0,02 | 83,26 | 0,51 | 94,68 | 0,2151 | 0,2151 | |||
| BMY / Bristol-Myers Squibb Company | 0,01 | 79,96 | 0,51 | 85,04 | 0,2130 | 0,2130 | |||
| PNW / Pinnacle West Capital Corporation | 0,01 | 77,60 | 0,49 | 90,31 | 0,2063 | 0,2063 | |||
| SHV / iShares Trust - iShares Short Treasury Bond ETF | 0,00 | -94,70 | 0,49 | -94,70 | 0,2046 | -3,9780 | |||
| KTCC / Key Tronic Corporation | 0,07 | 0,00 | 0,46 | -29,91 | 0,1950 | -0,1063 | |||
| BBY / Best Buy Co., Inc. | 0,00 | 34,97 | 0,44 | 20,82 | 0,1853 | 0,0192 | |||
| GOOG / Alphabet Inc. | 0,00 | 0,00 | 0,39 | 19,15 | 0,1647 | 0,0150 | |||
| SCHF / Schwab Strategic Trust - Schwab International Equity ETF | 0,01 | 4,48 | 0,39 | 19,69 | 0,1634 | 0,0156 | |||
| SPEM / SPDR Index Shares Funds - SPDR Portfolio Emerging Markets ETF | 0,01 | 3,03 | 0,36 | 18,63 | 0,1525 | 0,0133 | |||
| SPHD / Invesco Exchange-Traded Fund Trust II - Invesco S&P 500 High Dividend Low Volatility ETF | 0,01 | -95,87 | 0,33 | -95,29 | 0,1366 | -3,0036 | |||
| BRK.B / Berkshire Hathaway Inc. | 0,00 | 0,00 | 0,31 | 8,71 | 0,1311 | 0,0005 | |||
| ITRI / Itron, Inc. | 0,00 | 0,28 | 0,1189 | 0,1189 | |||||
| KSPN / Kaspien Holdings Inc. | 0,02 | 0,00 | 0,28 | 89,12 | 0,1168 | 0,0499 | |||
| AMZN / Amazon.com, Inc. | 0,00 | 22,73 | 0,26 | 26,92 | 0,1109 | 0,0163 | |||
| ADBE / Adobe Inc. | 0,00 | 0,00 | 0,25 | 2,04 | 0,1050 | -0,0064 | |||
| SCHM / Schwab Strategic Trust - Schwab U.S. Mid-Cap ETF | 0,00 | -3,93 | 0,24 | 18,14 | 0,1013 | 0,0084 | |||
| US0268741560 / American International Group, Inc. Warrants | 0,01 | -61,17 | 0,00 | -60,00 | 0,0008 | -0,0014 | |||
| IJK / iShares Trust - iShares S&P Mid-Cap 400 Growth ETF | 0,00 | -100,00 | 0,00 | -100,00 | -0,5802 | ||||
| VLO / Valero Energy Corporation | 0,00 | -100,00 | 0,00 | 0,0000 | 0,0000 | ||||
| AVB / AvalonBay Communities, Inc. | 0,00 | -100,00 | 0,00 | 0,0000 | 0,0000 | ||||
| BA / The Boeing Company | 0,00 | -100,00 | 0,00 | -100,00 | -1,3860 | ||||
| HL / Hecla Mining Company | 0,00 | -100,00 | 0,00 | -100,00 | -0,1156 |