Grundlæggende statistik
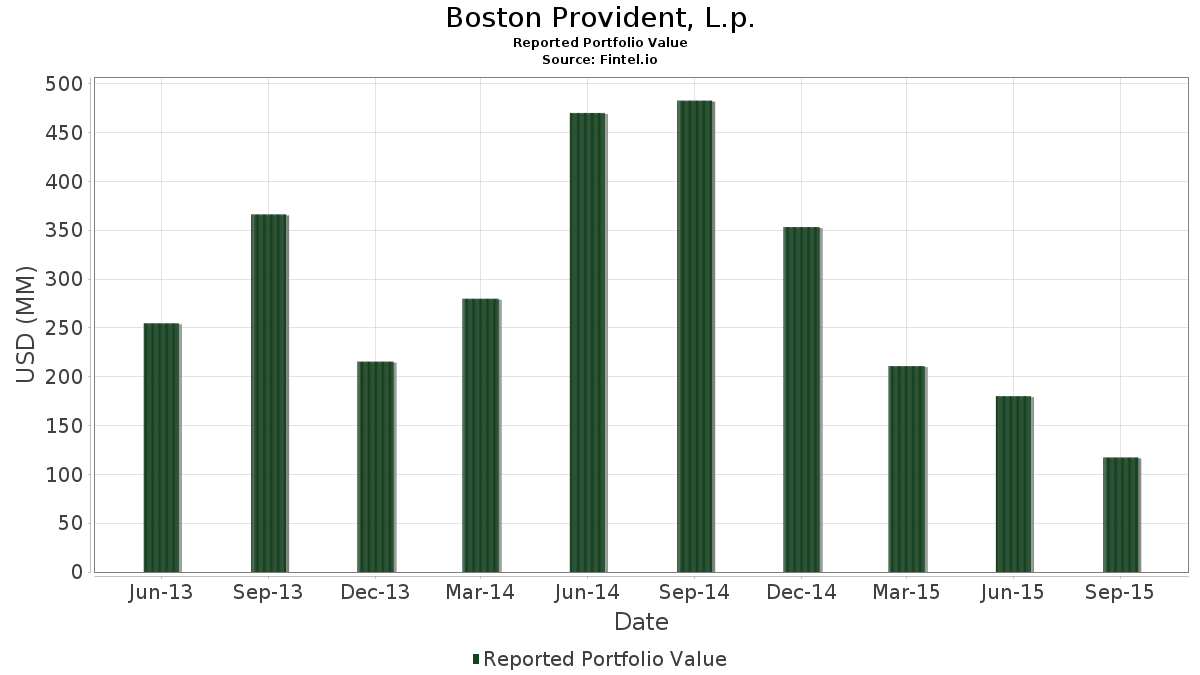
| Porteføljeværdi | $ 117.329.000 |
| Nuværende stillinger | 47 |
Seneste beholdninger, ydeevne, AUM (fra 13F, 13D)
Boston Provident, L.p. har afsløret 47 samlede besiddelser i deres seneste SEC-arkivering. Den seneste porteføljeværdi er beregnet til at være $ 117.329.000 USD. Faktiske aktiver under forvaltning (AUM) er denne værdi plus kontanter (som ikke er oplyst). Boston Provident, L.p.s største beholdninger er Altisource Portfolio Solutions S.A. (US:ASPS) , The Select Sector SPDR Trust - The Financial Select Sector SPDR Fund (US:XLF) , American International Group, Inc. (US:AIG) , Citigroup Inc. - Corporate Bond/Note (US:C) , and Altisource Residential Corp (US:US35904G1076) . Boston Provident, L.p.s nye stillinger omfatter E*TRADE Financial, Inc. (US:US2692464017) , Zions Bancorporation, National Association (US:ZION) , The Goldman Sachs Group, Inc. (US:GS) , Taubman Centers, Inc. (US:US8766641034) , and Realogy Holdings Corp (US:RLGY) .
Top øger dette kvartal
Vi bruger ændringen i porteføljeallokeringen, fordi dette er den mest meningsfulde metrik. Ændringer kan skyldes handler eller ændringer i aktiekurser.
| Sikkerhed | Aktier (MM) |
Værdi (MM$) |
Portefølje % | ΔPortefølje % |
|---|---|---|---|---|
| 0,15 | 8,49 | 7,2327 | 7,2327 | |
| 0,17 | 8,36 | 7,1210 | 7,1210 | |
| 0,58 | 8,05 | 6,8619 | 5,5331 | |
| 0,15 | 7,74 | 6,5951 | 3,4455 | |
| 0,13 | 3,41 | 2,9081 | 2,9081 | |
| 0,12 | 3,32 | 2,8271 | 2,8271 | |
| 0,02 | 3,30 | 2,8109 | 2,8109 | |
| 0,65 | 15,54 | 13,2431 | 2,7387 | |
| 0,40 | 3,10 | 2,6396 | 2,2853 | |
| 0,03 | 2,38 | 2,0310 | 2,0310 |
Top falder i dette kvartal
Vi bruger ændringen i porteføljeallokeringen, fordi dette er den mest meningsfulde metrik. Ændringer kan skyldes handler eller ændringer i aktiekurser.
| Sikkerhed | Aktier (MM) |
Værdi (MM$) |
Portefølje % | ΔPortefølje % |
|---|---|---|---|---|
| 0,60 | 13,60 | 11,5879 | -12,1034 | |
| 0,00 | 0,00 | -11,4328 | ||
| 0,14 | 1,76 | 1,5009 | -5,1859 | |
| 0,02 | 0,58 | 0,4909 | -5,0408 | |
| 0,00 | 0,00 | -3,4661 | ||
| 0,03 | 0,39 | 0,3298 | -3,2523 | |
| 0,08 | 1,10 | 0,9367 | -2,9936 | |
| 0,12 | 4,93 | 4,1985 | -2,9203 | |
| 0,05 | 0,28 | 0,2378 | -2,6675 | |
| 0,00 | 0,00 | -2,3494 |
13F og Fondsarkivering
Denne formular blev indsendt den 2015-11-16 for rapporteringsperioden 2015-09-30. Klik på linkikonet for at se den fulde transaktionshistorik.
Opgrader for at låse op for premium-data og eksportere til Excel ![]() .
.
| Sikkerhed | Type | Gennemsnitlig aktiekurs | Aktier (MM) |
Δ Aktier (%) |
Δ Aktier (%) |
Værdi ($MM) |
Portefølje (%) |
ΔPortefølje (%) |
|
|---|---|---|---|---|---|---|---|---|---|
| ASPS / Altisource Portfolio Solutions S.A. | 0,65 | 6,08 | 15,54 | -17,86 | 13,2431 | 2,7387 | |||
| XLF / The Select Sector SPDR Trust - The Financial Select Sector SPDR Fund | Put | 0,60 | -65,71 | 13,60 | -68,13 | 11,5879 | -12,1034 | ||
| AIG / American International Group, Inc. | 0,15 | 0,00 | 8,49 | 7,2327 | 7,2327 | ||||
| C / Citigroup Inc. - Corporate Bond/Note | 0,17 | 0,00 | 8,36 | 7,1210 | 7,1210 | ||||
| US35904G1076 / Altisource Residential Corp | 0,58 | 307,24 | 8,05 | 236,44 | 6,8619 | 5,5331 | |||
| DFS / Discover Financial Services | 0,15 | 51,18 | 7,74 | 36,42 | 6,5951 | 3,4455 | |||
| IBKR / Interactive Brokers Group, Inc. | 0,12 | -59,54 | 4,93 | -61,58 | 4,1985 | -2,9203 | |||
| RF / Regions Financial Corporation | 0,39 | 6,94 | 3,47 | -6,97 | 2,9575 | 0,8863 | |||
| US2692464017 / E*TRADE Financial, Inc. | 0,13 | 3,41 | 2,9081 | 2,9081 | |||||
| ZION / Zions Bancorporation, National Association | 0,12 | 3,32 | 2,8271 | 2,8271 | |||||
| GS / The Goldman Sachs Group, Inc. | 0,02 | 3,30 | 2,8109 | 2,8109 | |||||
| AER / AerCap Holdings N.V. | 0,09 | 89,31 | 3,26 | 58,14 | 2,7751 | 1,6318 | |||
| VER / VEREIT Inc | 0,40 | 411,32 | 3,10 | 385,42 | 2,6396 | 2,2853 | |||
| SWAY / Starwood Waypoint Residential Trust | 0,11 | -36,16 | 2,67 | -35,98 | 2,2782 | -0,0401 | |||
| US8766641034 / Taubman Centers, Inc. | 0,03 | 2,38 | 2,0310 | 2,0310 | |||||
| APO / Apollo Global Management, Inc. | 0,13 | 55,59 | 2,18 | 20,71 | 1,8580 | 1,8580 | |||
| AX / Axos Financial, Inc. | Put | 0,02 | -54,95 | 2,11 | -45,11 | 1,8001 | 1,8001 | ||
| RLGY / Realogy Holdings Corp | 0,05 | 2,01 | 1,7131 | 1,7131 | |||||
| NRF / NorthStar Realty Finance Corp. | 0,14 | -81,17 | 1,76 | -85,38 | 1,5009 | -5,1859 | |||
| SCHW / The Charles Schwab Corporation | 0,06 | 1,71 | 1,4608 | 1,4608 | |||||
| / TD AmeriTrade Holding Corp. | 0,05 | 1,70 | 1,4489 | 1,4489 | |||||
| KCG / KCG Holdings, Inc. | 0,11 | 0,30 | 1,16 | -10,74 | 0,9921 | 0,2680 | |||
| US5249011058 / Legg Mason, Inc. | 0,03 | 1,16 | 0,9853 | 0,9853 | |||||
| NSAM / NorthStar Asset Management Group, Inc. | 0,08 | -80,00 | 1,10 | -84,47 | 0,9367 | -2,9936 | |||
| PPBI / Pacific Premier Bancorp, Inc. | 0,05 | 17,00 | 0,95 | 40,27 | 0,8105 | 0,4341 | |||
| KW / Kennedy-Wilson Holdings, Inc. | 0,04 | 41,34 | 0,91 | 27,45 | 0,7756 | 0,3791 | |||
| AF / Astoria Financial Corp. | 0,05 | 0,82 | 0,6997 | 0,6997 | |||||
| ALLY / Ally Financial Inc. | 0,04 | 0,81 | 0,6946 | 0,6946 | |||||
| AJX / Great Ajax Corp. | 0,06 | -47,93 | 0,75 | -54,57 | 0,6358 | -0,2760 | |||
| AAMC / Altisource Asset Management Corporation | 0,02 | -65,14 | 0,58 | -94,22 | 0,4909 | -5,0408 | |||
| BIF / Boulder Growth & Income Fund Inc | 0,07 | -25,02 | 0,56 | -33,81 | 0,4756 | 0,0075 | |||
| US1080351067 / Bridge Bancorp, Inc. | 0,02 | 0,45 | 0,54 | 0,56 | 0,4577 | 0,1612 | |||
| XBKS / Xenith Bankshares, Inc. | 0,08 | -15,25 | 0,53 | -9,81 | 0,4543 | 0,1261 | |||
| REXI / Resource America, Inc. | 0,07 | -61,83 | 0,49 | -69,83 | 0,4142 | -0,4803 | |||
| AFHIF / Atlas Financial Holdings, Inc. | 0,02 | -58,25 | 0,44 | -61,06 | 0,3750 | -0,2525 | |||
| OCFC / OceanFirst Financial Corp. | 0,02 | 0,40 | 0,3375 | 0,3375 | |||||
| DBRG / DigitalBridge Group, Inc. | 0,02 | 0,00 | 0,39 | 0,3333 | 0,3333 | ||||
| PMT / PennyMac Mortgage Investment Trust | 0,03 | -92,56 | 0,39 | -94,99 | 0,3298 | -3,2523 | |||
| FNBC / First NBC Bank Holding Company | 0,01 | 0,00 | 0,35 | -2,78 | 0,2983 | 0,0984 | |||
| US36268W1009 / Gain Capital Holdings, Inc. | 0,05 | -79,26 | 0,35 | -84,21 | 0,2949 | -0,9217 | |||
| BHR / Braemar Hotels & Resorts Inc. | 0,02 | 0,34 | 0,2898 | 0,2898 | |||||
| OCN / Ocwen Financial Corporation | 0,05 | 0,00 | 0,34 | 0,2864 | 0,2864 | ||||
| AHT / Ashford Hospitality Trust, Inc. | 0,05 | -92,60 | 0,28 | -94,67 | 0,2378 | -2,6675 | |||
| VBTX / Veritex Holdings, Inc. | 0,01 | 0,17 | 0,1466 | 0,1466 | |||||
| NBBC / NewBridge Bancorp | 0,02 | 0,17 | 0,1457 | 0,1457 | |||||
| FRBK / Republic First Bancorp, Inc. | 0,04 | 0,15 | 0,1270 | 0,1270 | |||||
| CSFL / Centerstate Banks, Inc. | 0,01 | -69,65 | 0,15 | -60,16 | 0,1253 | 0,1253 | |||
| IWM / iShares Trust - iShares Russell 2000 ETF | Put | 0,00 | -100,00 | 0,00 | -100,00 | -3,4661 | |||
| HVB / Hudson Valley Holding Corp | 0,00 | -100,00 | 0,00 | -100,00 | -2,3494 | ||||
| STC / Stewart Information Services Corporation | 0,00 | -100,00 | 0,00 | -100,00 | -0,8118 | ||||
| FSFR / Fifth Street Senior Floating Rate Corp. | 0,00 | -100,00 | 0,00 | -100,00 | -0,4925 | ||||
| TBBK / The Bancorp, Inc. | 0,00 | -100,00 | 0,00 | -100,00 | -0,2460 | ||||
| SPY / SPDR S&P 500 ETF | Put | 0,00 | -100,00 | 0,00 | -100,00 | -11,4328 | |||
| LXFT / Luxoft Holding, Inc. | 0,00 | -100,00 | 0,00 | -100,00 | -0,8873 |