Grundlæggende statistik
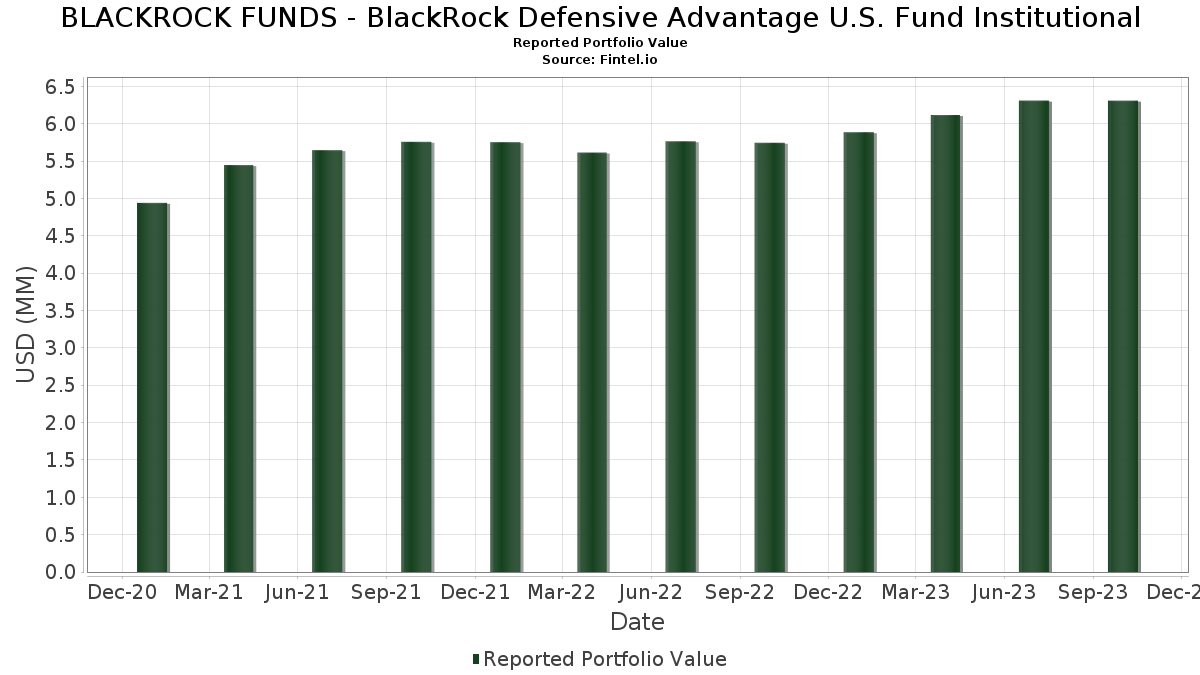
| Porteføljeværdi | $ 6.308.171 |
| Nuværende stillinger | 141 |
Seneste beholdninger, ydeevne, AUM (fra 13F, 13D)
BLACKROCK FUNDS - BlackRock Defensive Advantage U.S. Fund Institutional har afsløret 141 samlede besiddelser i deres seneste SEC-arkivering. Den seneste porteføljeværdi er beregnet til at være $ 6.308.171 USD. Faktiske aktiver under forvaltning (AUM) er denne værdi plus kontanter (som ikke er oplyst). BLACKROCK FUNDS - BlackRock Defensive Advantage U.S. Fund Institutionals største beholdninger er Microsoft Corporation (US:MSFT) , SL Liquidity Series, LLC, Money Market Series (US:590204509) , Walmart Inc. (US:WMT) , Motorola Solutions, Inc. (US:MSI) , and Gilead Sciences, Inc. (US:GILD) . BLACKROCK FUNDS - BlackRock Defensive Advantage U.S. Fund Institutionals nye stillinger omfatter Pioneer Natural Resources Company (US:PXD) , Flowers Foods, Inc. (US:FLO) , FedEx Corporation (US:FDX) , RPM International Inc. (US:RPM) , and HCA Healthcare, Inc. (US:HCA) .
Top øger dette kvartal
Vi bruger ændringen i porteføljeallokeringen, fordi dette er den mest meningsfulde metrik. Ændringer kan skyldes handler eller ændringer i aktiekurser.
| Sikkerhed | Aktier (MM) |
Værdi (MM$) |
Portefølje % | ΔPortefølje % |
|---|---|---|---|---|
| 0,16 | 0,16 | 2,6375 | 1,4833 | |
| 0,09 | 0,09 | 1,4626 | 1,4505 | |
| 0,00 | 0,11 | 1,7477 | 1,2062 | |
| 0,00 | 0,07 | 1,1058 | 1,1058 | |
| 0,00 | 0,06 | 0,9428 | 0,9428 | |
| 0,00 | 0,07 | 1,0945 | 0,8803 | |
| 0,00 | 0,05 | 0,8231 | 0,8080 | |
| 0,00 | 0,12 | 2,0054 | 0,7601 | |
| 0,00 | 0,04 | 0,7192 | 0,7192 | |
| 0,00 | 0,07 | 1,0573 | 0,7182 |
Top falder i dette kvartal
Vi bruger ændringen i porteføljeallokeringen, fordi dette er den mest meningsfulde metrik. Ændringer kan skyldes handler eller ændringer i aktiekurser.
| Sikkerhed | Aktier (MM) |
Værdi (MM$) |
Portefølje % | ΔPortefølje % |
|---|---|---|---|---|
| 0,00 | 0,00 | 0,0251 | -0,9128 | |
| 0,00 | 0,00 | 0,0516 | -0,8701 | |
| 0,00 | 0,01 | 0,0836 | -0,8573 | |
| 0,00 | 0,03 | 0,4189 | -0,6665 | |
| 0,00 | 0,00 | -0,6656 | ||
| 0,00 | 0,04 | 0,6660 | -0,5392 | |
| 0,00 | 0,02 | 0,3497 | -0,5096 | |
| 0,00 | 0,05 | 0,8335 | -0,4914 | |
| 0,00 | 0,04 | 0,6677 | -0,4720 | |
| 0,00 | 0,13 | 2,0543 | -0,4359 |
13F og Fondsarkivering
Denne formular blev indsendt den 2023-12-27 for rapporteringsperioden 2023-10-31. Klik på linkikonet for at se den fulde transaktionshistorik.
Opgrader for at låse op for premium-data og eksportere til Excel ![]() .
.
| Sikkerhed | Type | Gennemsnitlig aktiekurs | Aktier (MM) |
Δ Aktier (%) |
Δ Aktier (%) |
Værdi ($MM) |
Portefølje (%) |
ΔPortefølje (%) |
|
|---|---|---|---|---|---|---|---|---|---|
| MSFT / Microsoft Corporation | 0,00 | 4,36 | 0,17 | 5,59 | 2,7609 | 0,1820 | |||
| 590204509 / SL Liquidity Series, LLC, Money Market Series | 0,16 | 147,32 | 0,16 | 149,23 | 2,6375 | 1,4833 | |||
| WMT / Walmart Inc. | 0,00 | 0,55 | 0,15 | 3,45 | 2,4353 | 0,1106 | |||
| MSI / Motorola Solutions, Inc. | 0,00 | 2,29 | 0,15 | -0,67 | 2,4185 | 0,0308 | |||
| GILD / Gilead Sciences, Inc. | 0,00 | 0,00 | 0,14 | 3,03 | 2,2160 | 0,1083 | |||
| WM / Waste Management, Inc. | 0,00 | 20,47 | 0,13 | 20,91 | 2,1662 | 0,4079 | |||
| JNJ / Johnson & Johnson | 0,00 | 32,18 | 0,13 | 17,27 | 2,1072 | 0,3407 | |||
| PEP / PepsiCo, Inc. | 0,00 | -7,07 | 0,13 | -19,23 | 2,0543 | -0,4359 | |||
| LLY / Eli Lilly and Company | 0,00 | 29,65 | 0,12 | 57,69 | 2,0054 | 0,7601 | |||
| AAPL / Apple Inc. | 0,00 | 6,23 | 0,12 | -7,58 | 1,9850 | -0,1240 | |||
| TRV / The Travelers Companies, Inc. | 0,00 | 34,02 | 0,11 | 30,12 | 1,7669 | 0,4335 | |||
| MCD / McDonald's Corporation | 0,00 | 59,85 | 0,11 | 44,00 | 1,7620 | 0,5525 | |||
| V / Visa Inc. | 0,00 | -7,62 | 0,11 | -8,47 | 1,7595 | -0,1300 | |||
| RSG / Republic Services, Inc. | 0,00 | 222,22 | 0,11 | 224,24 | 1,7477 | 1,2062 | |||
| HSY / The Hershey Company | 0,00 | 0,00 | 0,11 | -19,08 | 1,7306 | -0,3657 | |||
| AMGN / Amgen Inc. | 0,00 | -10,69 | 0,10 | -2,86 | 1,6646 | -0,0100 | |||
| LMT / Lockheed Martin Corporation | 0,00 | 55,47 | 0,10 | 57,38 | 1,5721 | 0,5981 | |||
| BMY / Bristol-Myers Squibb Company | 0,00 | 1,03 | 0,10 | -15,79 | 1,5627 | -0,2688 | |||
| US09248U7182 / BlackRock Liquidity Funds: T-Fund, Institutional Shares | 0,09 | 11.785,75 | 0,09 | 13,92 | 1,4626 | 1,4505 | |||
| VRSN / VeriSign, Inc. | 0,00 | 0,00 | 0,09 | -5,32 | 1,4489 | -0,0530 | |||
| MA / Mastercard Incorporated | 0,00 | 6,82 | 0,09 | 2,33 | 1,4358 | 0,0542 | |||
| ED / Consolidated Edison, Inc. | 0,00 | 0,00 | 0,09 | -8,42 | 1,4280 | -0,0859 | |||
| VMW / Vmware Inc. - Class A | 0,00 | 4,65 | 0,09 | -3,41 | 1,3832 | -0,0202 | |||
| ANTM / Anthem Inc | 0,00 | 2,76 | 0,08 | -2,35 | 1,3591 | -0,0006 | |||
| VZ / Verizon Communications Inc. | 0,00 | -6,43 | 0,08 | -3,61 | 1,3032 | -0,0224 | |||
| KMB / Kimberly-Clark Corporation | 0,00 | 0,00 | 0,08 | -7,14 | 1,2683 | -0,0744 | |||
| INCY / Incyte Corporation | 0,00 | 8,65 | 0,08 | -8,33 | 1,2642 | -0,0846 | |||
| ABBV / AbbVie Inc. | 0,00 | 22,04 | 0,07 | 14,29 | 1,1804 | 0,1749 | |||
| MMC / Marsh & McLennan Companies, Inc. | 0,00 | 1,37 | 0,07 | 2,94 | 1,1392 | 0,0438 | |||
| OGE / OGE Energy Corp. | 0,00 | 34,64 | 0,07 | 36,00 | 1,1071 | 0,2295 | |||
| TEL / TE Connectivity plc | 0,00 | 0,07 | 1,1058 | 1,1058 | |||||
| REGN / Regeneron Pharmaceuticals, Inc. | 0,00 | -2,25 | 0,07 | 1,52 | 1,1015 | 0,0498 | |||
| ROP / Roper Technologies, Inc. | 0,00 | -23,33 | 0,07 | -23,86 | 1,0946 | -0,3190 | |||
| WRB / W. R. Berkley Corporation | 0,00 | 358,72 | 0,07 | 415,38 | 1,0945 | 0,8803 | |||
| FOXA / Fox Corporation | 0,00 | 22,39 | 0,07 | 11,86 | 1,0814 | 0,1272 | |||
| EG / Everest Group, Ltd. | 0,00 | -11,11 | 0,07 | -2,94 | 1,0790 | -0,0063 | |||
| ORLY / O'Reilly Automotive, Inc. | 0,00 | 204,35 | 0,07 | 209,52 | 1,0573 | 0,7182 | |||
| IDA / IDACORP, Inc. | 0,00 | 2,28 | 0,06 | -5,97 | 1,0363 | -0,0429 | |||
| CTAS / Cintas Corporation | 0,00 | -7,46 | 0,06 | -7,46 | 1,0209 | -0,0507 | |||
| MANH / Manhattan Associates, Inc. | 0,00 | -3,30 | 0,06 | -1,59 | 1,0192 | 0,0082 | |||
| MCO / Moody's Corporation | 0,00 | 9,19 | 0,06 | -4,62 | 1,0100 | -0,0294 | |||
| SYK / Stryker Corporation | 0,00 | -3,03 | 0,06 | -7,69 | 0,9826 | -0,0601 | |||
| GOOGL / Alphabet Inc. | 0,00 | 10,57 | 0,06 | 3,51 | 0,9689 | 0,0493 | |||
| EVRG / Evergy, Inc. | 0,00 | 3,68 | 0,06 | -15,71 | 0,9661 | -0,1496 | |||
| PXD / Pioneer Natural Resources Company | 0,00 | 0,06 | 0,9428 | 0,9428 | |||||
| WCN / Waste Connections, Inc. | 0,00 | 82,13 | 0,06 | 66,67 | 0,8998 | 0,3714 | |||
| ECL / Ecolab Inc. | 0,00 | -8,22 | 0,05 | -15,62 | 0,8823 | -0,1474 | |||
| OGS / ONE Gas, Inc. | 0,00 | 477,92 | 0,05 | 341,67 | 0,8727 | 0,6786 | |||
| THG / The Hanover Insurance Group, Inc. | 0,00 | 0,00 | 0,05 | 1,96 | 0,8563 | 0,0429 | |||
| TMUS / T-Mobile US, Inc. | 0,00 | 0,00 | 0,05 | 6,12 | 0,8454 | 0,0511 | |||
| GIS / General Mills, Inc. | 0,00 | -29,29 | 0,05 | -38,55 | 0,8335 | -0,4914 | |||
| CDW / CDW Corporation | 0,00 | 4.960,00 | 0,05 | 0,8231 | 0,8080 | ||||
| ROL / Rollins, Inc. | 0,00 | 66,12 | 0,05 | 53,13 | 0,8053 | 0,2890 | |||
| IT / Gartner, Inc. | 0,00 | 3,65 | 0,05 | -2,08 | 0,7654 | -0,0061 | |||
| VLO / Valero Energy Corporation | 0,00 | 0,00 | 0,05 | -2,13 | 0,7608 | 0,0031 | |||
| TXN / Texas Instruments Incorporated | 0,00 | 0,00 | 0,04 | -21,43 | 0,7216 | -0,1758 | |||
| FLO / Flowers Foods, Inc. | 0,00 | 0,04 | 0,7192 | 0,7192 | |||||
| EA / Electronic Arts Inc. | 0,00 | 0,00 | 0,04 | -8,33 | 0,7174 | -0,0579 | |||
| AKAM / Akamai Technologies, Inc. | 0,00 | -44,20 | 0,04 | -39,44 | 0,7096 | -0,4313 | |||
| META / Meta Platforms, Inc. | 0,00 | 1.280,00 | 0,04 | 1.266,67 | 0,6749 | 0,6242 | |||
| CVS / CVS Health Corporation | 0,00 | -37,79 | 0,04 | -42,25 | 0,6677 | -0,4720 | |||
| CSCO / Cisco Systems, Inc. | 0,00 | -45,87 | 0,04 | -45,33 | 0,6660 | -0,5392 | |||
| GM / General Motors Company | 0,00 | 107,59 | 0,04 | 53,85 | 0,6510 | 0,2324 | |||
| CHE / Chemed Corporation | 0,00 | 0,00 | 0,04 | 8,33 | 0,6485 | 0,0592 | |||
| CHRW / C.H. Robinson Worldwide, Inc. | 0,00 | 1.085,37 | 0,04 | 875,00 | 0,6456 | 0,5802 | |||
| MDT / Medtronic plc | 0,00 | 0,04 | 0,6243 | 0,6243 | |||||
| DELL / Dell Technologies Inc. | 0,00 | 923,21 | 0,04 | 1.800,00 | 0,6224 | 0,5752 | |||
| UNM / Unum Group | 0,00 | 246,33 | 0,04 | 260,00 | 0,5994 | 0,4306 | |||
| IBM / International Business Machines Corporation | 0,00 | 19,52 | 0,04 | 20,00 | 0,5894 | 0,1071 | |||
| FDX / FedEx Corporation | 0,00 | 0,04 | 0,5691 | 0,5691 | |||||
| ORCL / Oracle Corporation | 0,00 | 5,61 | 0,04 | -5,41 | 0,5691 | -0,0303 | |||
| LULU / lululemon athletica inc. | 0,00 | 58,18 | 0,03 | 70,00 | 0,5557 | 0,2241 | |||
| CHD / Church & Dwight Co., Inc. | 0,00 | 657,14 | 0,03 | 1.000,00 | 0,5477 | 0,4841 | |||
| ANET / Arista Networks Inc | 0,00 | 453,33 | 0,03 | 725,00 | 0,5400 | 0,4659 | |||
| BRK.B / Berkshire Hathaway Inc. | 0,00 | 11,49 | 0,03 | 10,00 | 0,5375 | 0,0498 | |||
| NSP / Insperity, Inc. | 0,00 | -20,60 | 0,03 | -27,91 | 0,5034 | -0,1880 | |||
| CMS / CMS Energy Corporation | 0,00 | -8,80 | 0,03 | -21,05 | 0,5028 | -0,1051 | |||
| SJM / The J. M. Smucker Company | 0,00 | 0,03 | 0,5027 | 0,5027 | |||||
| AFG / American Financial Group, Inc. | 0,00 | 26,24 | 0,03 | 15,38 | 0,4953 | 0,0673 | |||
| CW / Curtiss-Wright Corporation | 0,00 | 0,00 | 0,03 | 7,41 | 0,4712 | 0,0262 | |||
| UNH / UnitedHealth Group Incorporated | 0,00 | -12,07 | 0,03 | -6,90 | 0,4434 | -0,0244 | |||
| PAG / Penske Automotive Group, Inc. | 0,00 | 39,23 | 0,03 | 78,57 | 0,4204 | 0,1663 | |||
| PG / The Procter & Gamble Company | 0,00 | -60,55 | 0,03 | -63,24 | 0,4189 | -0,6665 | |||
| ADBE / Adobe Inc. | 0,00 | 53,33 | 0,02 | 50,00 | 0,3973 | 0,1364 | |||
| SGEN / Seagen Inc | 0,00 | 1,89 | 0,02 | 10,00 | 0,3731 | 0,0493 | |||
| KR / The Kroger Co. | 0,00 | -18,78 | 0,02 | -26,67 | 0,3727 | -0,1100 | |||
| POWI / Power Integrations, Inc. | 0,00 | 0,00 | 0,02 | -29,03 | 0,3647 | -0,1366 | |||
| GDDY / GoDaddy Inc. | 0,00 | -17,58 | 0,02 | -25,00 | 0,3566 | -0,0903 | |||
| PAYX / Paychex, Inc. | 0,00 | -54,88 | 0,02 | -60,38 | 0,3497 | -0,5096 | |||
| MPC / Marathon Petroleum Corporation | 0,00 | 363,33 | 0,02 | 600,00 | 0,3413 | 0,2777 | |||
| CPB / The Campbell's Company | 0,00 | 129,33 | 0,02 | 100,00 | 0,3385 | 0,1743 | |||
| RPM / RPM International Inc. | 0,00 | 0,02 | 0,3156 | 0,3156 | |||||
| DUK / Duke Energy Corporation | 0,00 | 4,81 | 0,02 | 0,00 | 0,3146 | 0,0044 | |||
| HUM / Humana Inc. | 0,00 | 0,02 | 0,3061 | 0,3061 | |||||
| RGA / Reinsurance Group of America, Incorporated | 0,00 | 242,86 | 0,02 | 325,00 | 0,2912 | 0,2129 | |||
| ACN / Accenture plc | 0,00 | 1,82 | 0,02 | -5,88 | 0,2701 | -0,0070 | |||
| MRK / Merck & Co., Inc. | 0,00 | 11,11 | 0,02 | 6,67 | 0,2668 | 0,0221 | |||
| SIGI / Selective Insurance Group, Inc. | 0,00 | -21,94 | 0,02 | -25,00 | 0,2586 | -0,0636 | |||
| PGR / The Progressive Corporation | 0,00 | -16,81 | 0,02 | 7,14 | 0,2541 | 0,0153 | |||
| HCA / HCA Healthcare, Inc. | 0,00 | 0,02 | 0,2496 | 0,2496 | |||||
| POR / Portland General Electric Company | 0,00 | 0,02 | 0,2475 | 0,2475 | |||||
| HON / Honeywell International Inc. | 0,00 | -28,70 | 0,02 | -31,82 | 0,2440 | -0,1116 | |||
| APD / Air Products and Chemicals, Inc. | 0,00 | 628,57 | 0,01 | 600,00 | 0,2338 | 0,1998 | |||
| AMAT / Applied Materials, Inc. | 0,00 | 0,01 | 0,2235 | 0,2235 | |||||
| POST / Post Holdings, Inc. | 0,00 | 0,01 | 0,2150 | 0,2150 | |||||
| GWW / W.W. Grainger, Inc. | 0,00 | 0,00 | 0,01 | 0,00 | 0,2133 | 0,0015 | |||
| OSK / Oshkosh Corporation | 0,00 | 0,01 | 0,2108 | 0,2108 | |||||
| COR / Cencora, Inc. | 0,00 | 0,01 | 0,2014 | 0,2014 | |||||
| NEM / Newmont Corporation | 0,00 | -30,58 | 0,01 | -42,11 | 0,1892 | -0,1171 | |||
| NOC / Northrop Grumman Corporation | 0,00 | 20,00 | 0,01 | 37,50 | 0,1837 | 0,0419 | |||
| TJX / The TJX Companies, Inc. | 0,00 | 0,00 | 0,01 | 10,00 | 0,1787 | 0,0064 | |||
| ARM / Arm Holdings plc - Depositary Receipt (Common Stock) | 0,00 | 0,01 | 0,1624 | 0,1624 | |||||
| HPQ / HP Inc. | 0,00 | -51,05 | 0,01 | -62,50 | 0,1590 | -0,2384 | |||
| AJG / Arthur J. Gallagher & Co. | 0,00 | -62,04 | 0,01 | -59,09 | 0,1567 | -0,2094 | |||
| APH / Amphenol Corporation | 0,00 | 23,91 | 0,01 | 12,50 | 0,1491 | 0,0197 | |||
| TXRH / Texas Roadhouse, Inc. | 0,00 | 0,01 | 0,1467 | 0,1467 | |||||
| AMZN / Amazon.com, Inc. | 0,00 | -76,60 | 0,01 | -77,14 | 0,1340 | -0,4303 | |||
| ENSG / The Ensign Group, Inc. | 0,00 | 97,62 | 0,01 | 100,00 | 0,1302 | 0,0654 | |||
| SHW / The Sherwin-Williams Company | 0,00 | 0,01 | 0,1121 | 0,1121 | |||||
| EXEL / Exelixis, Inc. | 0,00 | 0,01 | 0,1100 | 0,1100 | |||||
| GOOG / Alphabet Inc. | 0,00 | 0,00 | 0,01 | 0,00 | 0,0997 | -0,0042 | |||
| HIG / The Hartford Insurance Group, Inc. | 0,00 | -51,50 | 0,01 | -58,33 | 0,0966 | -0,1152 | |||
| ITW / Illinois Tool Works Inc. | 0,00 | 0,00 | 0,01 | -16,67 | 0,0946 | -0,0144 | |||
| CB / Chubb Limited | 0,00 | -91,70 | 0,01 | -91,53 | 0,0836 | -0,8573 | |||
| MCK / McKesson Corporation | 0,00 | -31,25 | 0,01 | -16,67 | 0,0813 | -0,0212 | |||
| PANW / Palo Alto Networks, Inc. | 0,00 | -57,50 | 0,00 | -55,56 | 0,0671 | -0,0922 | |||
| AOS / A. O. Smith Corporation | 0,00 | 0,00 | 0,0566 | 0,0566 | |||||
| WDAY / Workday, Inc. | 0,00 | -93,98 | 0,00 | -94,12 | 0,0516 | -0,8701 | |||
| FOX / Fox Corporation | 0,00 | 1,80 | 0,00 | 0,00 | 0,0512 | -0,0043 | |||
| NBIX / Neurocrine Biosciences, Inc. | 0,00 | 0,00 | 0,00 | 0,00 | 0,0450 | 0,0045 | |||
| NJR / New Jersey Resources Corporation | 0,00 | 0,00 | 0,00 | 0,00 | 0,0395 | -0,0032 | |||
| JAZZ / Jazz Pharmaceuticals plc | 0,00 | 0,00 | 0,00 | 0,00 | 0,0392 | -0,0003 | |||
| HUN / Huntsman Corporation | 0,00 | 0,00 | 0,00 | 0,00 | 0,0360 | -0,0091 | |||
| VIRT / Virtu Financial, Inc. | 0,00 | 0,00 | 0,00 | 0,00 | 0,0279 | 0,0004 | |||
| KNSL / Kinsale Capital Group, Inc. | 0,00 | -37,50 | 0,00 | -50,00 | 0,0271 | -0,0204 | |||
| IP / International Paper Company | 0,00 | 0,00 | 0,0257 | 0,0257 | |||||
| AON / Aon plc | 0,00 | -97,18 | 0,00 | -98,25 | 0,0251 | -0,9128 | |||
| KEX / Kirby Corporation | 0,00 | 0,00 | 0,0243 | 0,0243 | |||||
| KO / The Coca-Cola Company | 0,00 | -86,67 | 0,00 | -90,00 | 0,0238 | -0,1673 | |||
| EME / EMCOR Group, Inc. | 0,00 | 0,00 | 0,0101 | 0,0101 | |||||
| JKHY / Jack Henry & Associates, Inc. | 0,00 | -76,47 | 0,00 | -100,00 | 0,0092 | -0,0501 | |||
| NXPI / NXP Semiconductors N.V. | 0,00 | -100,00 | 0,00 | -100,00 | -0,0604 | ||||
| COP / ConocoPhillips | 0,00 | -100,00 | 0,00 | -100,00 | -0,6656 | ||||
| LYB / LyondellBasell Industries N.V. | 0,00 | -100,00 | 0,00 | -100,00 | -0,1401 | ||||
| VMC / Vulcan Materials Company | 0,00 | -100,00 | 0,00 | -100,00 | -0,0808 | ||||
| CBOE / Cboe Global Markets, Inc. | 0,00 | -100,00 | 0,00 | -100,00 | -0,1357 | ||||
| PFE / Pfizer Inc. | 0,00 | -100,00 | 0,00 | -100,00 | -0,2699 | ||||
| ACM / AECOM | 0,00 | -100,00 | 0,00 | -100,00 | -0,1538 | ||||
| CF / CF Industries Holdings, Inc. | 0,00 | -100,00 | 0,00 | -100,00 | -0,0967 |