Grundlæggende statistik
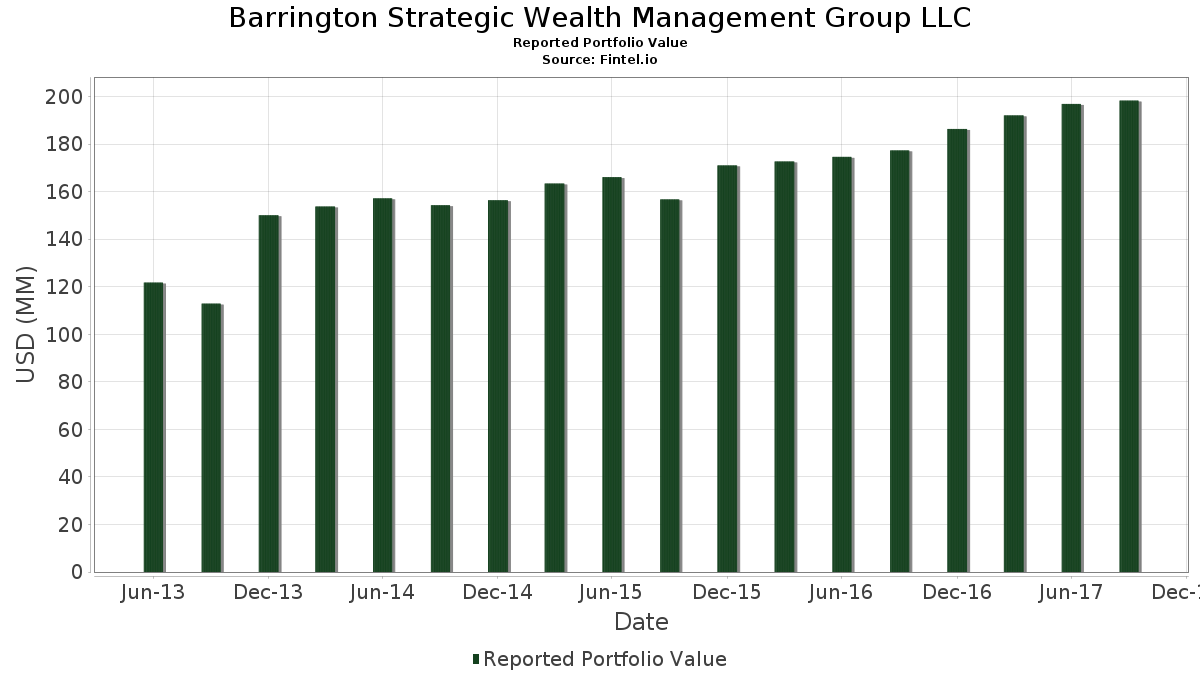
| Porteføljeværdi | $ 198.295.000 |
| Nuværende stillinger | 105 |
Seneste beholdninger, ydeevne, AUM (fra 13F, 13D)
Barrington Strategic Wealth Management Group LLC har afsløret 105 samlede besiddelser i deres seneste SEC-arkivering. Den seneste porteføljeværdi er beregnet til at være $ 198.295.000 USD. Faktiske aktiver under forvaltning (AUM) er denne værdi plus kontanter (som ikke er oplyst). Barrington Strategic Wealth Management Group LLCs største beholdninger er SPDR S&P 500 ETF (US:SPY) , Vanguard Bond Index Funds - Vanguard Short-Term Bond ETF (US:BSV) , iShares Trust - iShares 7-10 Year Treasury Bond ETF (US:IEF) , iShares Trust - iShares 1-3 Year Treasury Bond ETF (US:SHY) , and iShares Trust - iShares TIPS Bond ETF (US:TIP) . Barrington Strategic Wealth Management Group LLCs nye stillinger omfatter Ulta Beauty, Inc. (US:ULTA) , .
Top øger dette kvartal
Vi bruger ændringen i porteføljeallokeringen, fordi dette er den mest meningsfulde metrik. Ændringer kan skyldes handler eller ændringer i aktiekurser.
| Sikkerhed | Aktier (MM) |
Værdi (MM$) |
Portefølje % | ΔPortefølje % |
|---|---|---|---|---|
| 0,22 | 6,31 | 3,1826 | 3,1826 | |
| 0,05 | 6,13 | 3,0934 | 3,0934 | |
| 0,18 | 5,77 | 2,9083 | 2,9083 | |
| 0,07 | 1,67 | 0,8442 | 0,8442 | |
| 0,03 | 1,32 | 0,6637 | 0,6637 | |
| 0,01 | 0,82 | 0,4160 | 0,4160 | |
| 0,19 | 15,52 | 7,8282 | 0,3613 | |
| 0,01 | 0,71 | 0,3606 | 0,3606 | |
| 0,01 | 0,56 | 0,2814 | 0,2814 | |
| 0,00 | 0,55 | 0,2789 | 0,2789 |
Top falder i dette kvartal
Vi bruger ændringen i porteføljeallokeringen, fordi dette er den mest meningsfulde metrik. Ændringer kan skyldes handler eller ændringer i aktiekurser.
| Sikkerhed | Aktier (MM) |
Værdi (MM$) |
Portefølje % | ΔPortefølje % |
|---|---|---|---|---|
| 0,00 | 0,00 | -0,5059 | ||
| 0,02 | 2,55 | 1,2855 | -0,4526 | |
| 0,02 | 1,78 | 0,8992 | -0,3112 | |
| 0,09 | 8,00 | 4,0349 | -0,2702 | |
| 0,01 | 1,42 | 0,7151 | -0,2205 | |
| 0,09 | 2,21 | 1,1155 | -0,1629 | |
| 0,01 | 0,85 | 0,4276 | -0,1422 | |
| 0,06 | 4,85 | 2,4438 | -0,1303 | |
| 0,03 | 2,48 | 1,2507 | -0,1294 | |
| 0,02 | 1,17 | 0,5895 | -0,1287 |
13F og Fondsarkivering
Denne formular blev indsendt den 2017-10-31 for rapporteringsperioden 2017-09-30. Klik på linkikonet for at se den fulde transaktionshistorik.
Opgrader for at låse op for premium-data og eksportere til Excel ![]() .
.
| Sikkerhed | Type | Gennemsnitlig aktiekurs | Aktier (MM) |
Δ Aktier (%) |
Δ Aktier (%) |
Værdi ($MM) |
Portefølje (%) |
ΔPortefølje (%) |
|
|---|---|---|---|---|---|---|---|---|---|
| SPY / SPDR S&P 500 ETF | 0,07 | -0,85 | 17,93 | 3,01 | 9,0406 | 0,2013 | |||
| BSV / Vanguard Bond Index Funds - Vanguard Short-Term Bond ETF | 0,19 | 5,64 | 15,52 | 5,59 | 7,8282 | 0,3613 | |||
| IEF / iShares Trust - iShares 7-10 Year Treasury Bond ETF | 0,08 | 2,40 | 8,86 | 2,31 | 4,4691 | 0,0695 | |||
| SHY / iShares Trust - iShares 1-3 Year Treasury Bond ETF | 0,09 | -5,57 | 8,00 | -5,60 | 4,0349 | -0,2702 | |||
| TIP / iShares Trust - iShares TIPS Bond ETF | 0,06 | 1,51 | 7,29 | 1,63 | 3,6738 | 0,0331 | |||
| HEFA / iShares Trust - iShares Currency Hedged MSCI EAFE ETF | 0,22 | 1,70 | 6,31 | 3,56 | 3,1826 | 3,1826 | |||
| IEI / iShares Trust - iShares 3-7 Year Treasury Bond ETF | 0,05 | 12,79 | 6,13 | 12,74 | 3,0934 | 3,0934 | |||
| SH / ProShares Trust - ProShares Short S&P500 | 0,18 | 3,70 | 5,77 | -0,41 | 2,9083 | 2,9083 | |||
| MDY / SPDR S&P MidCap 400 ETF Trust | 0,02 | -1,74 | 5,74 | 0,95 | 2,8957 | 0,0066 | |||
| AAPL / Apple Inc. | 0,03 | -1,00 | 5,07 | 5,95 | 2,5578 | 0,1264 | |||
| VYM / Vanguard Whitehall Funds - Vanguard High Dividend Yield ETF | 0,06 | -7,81 | 4,85 | -4,38 | 2,4438 | -0,1303 | |||
| JPM / JPMorgan Chase & Co. | 0,04 | -1,11 | 3,78 | 3,34 | 1,9052 | 0,0483 | |||
| MSFT / Microsoft Corporation | 0,04 | -0,93 | 3,35 | 7,07 | 1,6874 | 0,1001 | |||
| TBF / ProShares Trust - ProShares Short 20+ Year Treasury | 0,15 | -1,11 | 3,28 | -1,41 | 1,6521 | -0,0357 | |||
| ACWI / iShares Trust - iShares MSCI ACWI ETF | 0,04 | -3,95 | 3,02 | 0,90 | 1,5230 | 0,0028 | |||
| NEE / NextEra Energy, Inc. | 0,02 | -28,78 | 2,55 | -25,51 | 1,2855 | -0,4526 | |||
| DIS / The Walt Disney Company | 0,03 | -1,63 | 2,48 | -8,72 | 1,2507 | -0,1294 | |||
| MA / Mastercard Incorporated | 0,02 | -1,68 | 2,31 | 14,32 | 1,1634 | 0,1384 | |||
| GE / General Electric Company | 0,09 | -1,83 | 2,21 | -12,12 | 1,1155 | -0,1629 | |||
| HD / The Home Depot, Inc. | 0,01 | -1,66 | 2,17 | 4,82 | 1,0963 | 0,0429 | |||
| HUM / Humana Inc. | 0,01 | -1,78 | 2,16 | -0,55 | 1,0878 | -0,0139 | |||
| WFC / Wells Fargo & Company | 0,04 | -2,41 | 2,15 | -2,84 | 1,0863 | -0,0398 | |||
| BK / The Bank of New York Mellon Corporation | 0,04 | -1,28 | 2,12 | 2,57 | 1,0686 | 0,0193 | |||
| TLT / iShares Trust - iShares 20+ Year Treasury Bond ETF | 0,02 | -0,27 | 2,06 | -0,58 | 1,0414 | -0,0136 | |||
| VOD / Vodafone Group Public Limited Company - Depositary Receipt (Common Stock) | 0,07 | -0,37 | 2,01 | -1,32 | 1,0141 | -0,0210 | |||
| COF / Capital One Financial Corporation | 0,02 | -2,20 | 1,89 | 0,21 | 0,9511 | -0,0048 | |||
| LAZ / Lazard, Inc. | 0,04 | -0,31 | 1,85 | -2,68 | 0,9355 | -0,0326 | |||
| DEO / Diageo plc - Depositary Receipt (Common Stock) | 0,01 | -1,48 | 1,85 | 8,58 | 0,9314 | 0,0675 | |||
| IGE / iShares Trust - iShares North American Natural Resources ETF | 0,05 | -0,19 | 1,82 | 6,11 | 0,9198 | 0,0467 | |||
| MCD / McDonald's Corporation | 0,01 | -0,77 | 1,78 | 1,48 | 0,8997 | 0,0067 | |||
| XOM / Exxon Mobil Corporation | 0,02 | -26,30 | 1,78 | -25,18 | 0,8992 | -0,3112 | |||
| NVS / Novartis AG - Depositary Receipt (Common Stock) | 0,02 | 0,20 | 1,73 | 3,04 | 0,8729 | 0,0196 | |||
| CVX / Chevron Corporation | 0,01 | -0,98 | 1,72 | 11,50 | 0,8654 | 0,0837 | |||
| UUP / Invesco DB US Dollar Index Trust - Invesco DB US Dollar Index Bullish Fund | 0,07 | -1,47 | 1,67 | -3,68 | 0,8442 | 0,8442 | |||
| PFE / Pfizer Inc. | 0,04 | -1,17 | 1,52 | 5,04 | 0,7670 | 0,0316 | |||
| EFX / Equifax Inc. | 0,01 | -0,22 | 1,42 | -23,02 | 0,7151 | -0,2205 | |||
| FDX / FedEx Corporation | 0,01 | -0,89 | 1,38 | 2,92 | 0,6939 | 0,0148 | |||
| 153501101 / Central Fund of Canada Ltd. | 0,11 | 3,33 | 1,36 | 6,17 | 0,6853 | 0,0352 | |||
| LMT / Lockheed Martin Corporation | 0,00 | 1,75 | 1,35 | 13,69 | 0,6828 | 0,0779 | |||
| AIG / American International Group, Inc. | 0,02 | -1,51 | 1,34 | -3,24 | 0,6778 | -0,0277 | |||
| MCHP / Microchip Technology Incorporated | 0,01 | -1,06 | 1,34 | 15,08 | 0,6773 | 0,0845 | |||
| NEP / XPLR Infrastructure, LP - Limited Partnership | 0,03 | -1,24 | 1,32 | 7,60 | 0,6637 | 0,6637 | |||
| CVS / CVS Health Corporation | 0,02 | -1,99 | 1,28 | -0,93 | 0,6465 | -0,0107 | |||
| GOOGL / Alphabet Inc. | 0,00 | -1,87 | 1,27 | 2,82 | 0,6430 | 0,0132 | |||
| PEP / PepsiCo, Inc. | 0,01 | -2,37 | 1,24 | -5,77 | 0,6258 | -0,0431 | |||
| XEC / Cimarex Energy Co. | 0,01 | -0,55 | 1,23 | 20,25 | 0,6198 | 0,1007 | |||
| IWS / iShares Trust - iShares Russell Mid-Cap Value ETF | 0,01 | -2,59 | 1,20 | -1,56 | 0,6042 | -0,0140 | |||
| IUSV / iShares Trust - iShares Core S&P U.S. Value ETF | 0,02 | 7,21 | 1,19 | 10,18 | 0,6006 | 0,0516 | |||
| MUB / iShares Trust - iShares National Muni Bond ETF | 0,01 | 13,95 | 1,18 | 14,81 | 0,5941 | 0,0729 | |||
| GOLD / Barrick Mining Corporation | 0,07 | -0,60 | 1,18 | 0,51 | 0,5931 | -0,0012 | |||
| EQR / Equity Residential | 0,02 | -11,71 | 1,18 | -11,59 | 0,5926 | -0,0825 | |||
| MO / Altria Group, Inc. | 0,02 | -2,92 | 1,17 | -17,33 | 0,5895 | -0,1287 | |||
| FAST / Fastenal Company | 0,02 | -0,16 | 1,02 | 4,50 | 0,5149 | 0,0187 | |||
| BMY / Bristol-Myers Squibb Company | 0,02 | -3,33 | 0,98 | 10,57 | 0,4957 | 0,0442 | |||
| MRK / Merck & Co., Inc. | 0,01 | -0,67 | 0,96 | -0,73 | 0,4821 | -0,0070 | |||
| INTC / Intel Corporation | 0,03 | 12,94 | 0,95 | 27,54 | 0,4811 | 0,1012 | |||
| CTSH / Cognizant Technology Solutions Corporation | 0,01 | -1,81 | 0,94 | 7,28 | 0,4756 | 0,0291 | |||
| WMT / Walmart Inc. | 0,01 | -3,30 | 0,94 | -0,11 | 0,4740 | -0,0039 | |||
| ABBV / AbbVie Inc. | 0,01 | -0,05 | 0,89 | 22,53 | 0,4498 | 0,0801 | |||
| DVY / iShares Trust - iShares Select Dividend ETF | 0,01 | -25,53 | 0,85 | -24,42 | 0,4276 | -0,1422 | |||
| BAX / Baxter International Inc. | 0,01 | -1,90 | 0,84 | 1,69 | 0,4251 | 0,0041 | |||
| IJR / iShares Trust - iShares Core S&P Small-Cap ETF | 0,01 | -6,17 | 0,82 | -0,60 | 0,4160 | 0,4160 | |||
| VZ / Verizon Communications Inc. | 0,02 | -15,66 | 0,80 | -6,56 | 0,4024 | -0,0313 | |||
| PSX / Phillips 66 | 0,01 | -0,97 | 0,79 | 9,70 | 0,3994 | 0,0327 | |||
| ABT / Abbott Laboratories | 0,01 | 0,10 | 0,79 | 9,94 | 0,3959 | 0,0332 | |||
| RWT / Redwood Trust, Inc. | 0,05 | -1,06 | 0,78 | -5,48 | 0,3913 | -0,0257 | |||
| CSCO / Cisco Systems, Inc. | 0,02 | -0,26 | 0,77 | 7,24 | 0,3883 | 0,0236 | |||
| PG / The Procter & Gamble Company | 0,01 | -1,58 | 0,77 | 2,82 | 0,3868 | 0,0079 | |||
| ROST / Ross Stores, Inc. | 0,01 | -2,01 | 0,74 | 9,64 | 0,3727 | 0,0303 | |||
| WES / Western Midstream Partners, LP - Limited Partnership | 0,01 | -9,70 | 0,73 | -17,18 | 0,3697 | -0,0799 | |||
| HEDJ / WisdomTree Trust - WisdomTree Europe Hedged Equity Fund | 0,01 | 0,71 | 0,3606 | 0,3606 | |||||
| EXPE / Expedia Group, Inc. | 0,00 | -0,65 | 0,70 | -3,98 | 0,3530 | -0,0173 | |||
| RYN / Rayonier Inc. | 0,02 | -1,77 | 0,70 | -1,27 | 0,3515 | -0,0071 | |||
| MDT / Medtronic plc | 0,01 | -3,10 | 0,69 | -15,18 | 0,3495 | -0,0655 | |||
| F / Ford Motor Company | 0,06 | -2,73 | 0,69 | 4,10 | 0,3459 | 0,0112 | |||
| WTW / Willis Towers Watson Public Limited Company | 0,00 | -2,41 | 0,66 | 3,47 | 0,3308 | 0,0088 | |||
| GILD / Gilead Sciences, Inc. | 0,01 | -0,98 | 0,66 | 13,32 | 0,3303 | 0,0367 | |||
| AWK / American Water Works Company, Inc. | 0,01 | 0,12 | 0,65 | 4,00 | 0,3278 | 0,0103 | |||
| 74005P104 / Praxair, Inc. | 0,00 | -0,85 | 0,65 | 4,51 | 0,3273 | 0,0119 | |||
| RWO / SPDR Index Shares Funds - SPDR Dow Jones Global Real Estate ETF | 0,01 | -4,13 | 0,64 | -3,89 | 0,3243 | -0,0155 | |||
| IVZ / Invesco Ltd. | 0,02 | 0,27 | 0,64 | -0,16 | 0,3222 | -0,0028 | |||
| SCHM / Schwab Strategic Trust - Schwab U.S. Mid-Cap ETF | 0,01 | -7,21 | 0,56 | -3,46 | 0,2814 | 0,2814 | |||
| 018490100 / Allergan plc | 0,00 | -1,46 | 0,55 | -16,97 | 0,2789 | 0,2789 | |||
| SLB / Schlumberger Limited | 0,01 | -3,03 | 0,54 | 2,68 | 0,2703 | 0,0052 | |||
| INTU / Intuit Inc. | 0,00 | -1,11 | 0,51 | 5,85 | 0,2557 | 0,2557 | |||
| EEM / iShares, Inc. - iShares MSCI Emerging Markets ETF | 0,01 | -6,00 | 0,50 | 1,84 | 0,2511 | 0,0028 | |||
| CCI / Crown Castle Inc. | 0,00 | -1,13 | 0,48 | -1,44 | 0,2421 | 0,2421 | |||
| BRK.B / Berkshire Hathaway Inc. | 0,00 | 71,85 | 0,43 | 85,65 | 0,2153 | 0,0985 | |||
| KO / The Coca-Cola Company | 0,01 | -16,03 | 0,42 | -15,80 | 0,2123 | -0,0416 | |||
| COL / Rockwell Collins, Inc. | 0,00 | -42,13 | 0,41 | -28,05 | 0,2083 | -0,0833 | |||
| FMBI / First Midwest Bancorp, Inc. | 0,02 | -0,60 | 0,41 | 0,00 | 0,2063 | 0,2063 | |||
| GOOG / Alphabet Inc. | 0,00 | -5,38 | 0,41 | 0,00 | 0,2042 | -0,0015 | |||
| MMM / 3M Company | 0,00 | -1,29 | 0,40 | -0,50 | 0,2022 | -0,0025 | |||
| NXRT / NexPoint Residential Trust, Inc. | 0,02 | 0,00 | 0,39 | -4,62 | 0,1977 | 0,1977 | |||
| ULTA / Ulta Beauty, Inc. | 0,00 | 0,35 | 0,1775 | 0,1775 | |||||
| SHPG / Shire Plc. | 0,00 | 3,13 | 0,34 | -4,46 | 0,1730 | 0,1730 | |||
| ESRX / Express Scripts Holding Co. | 0,01 | -1,10 | 0,34 | -2,01 | 0,1725 | -0,0048 | |||
| LOW / Lowe's Companies, Inc. | 0,00 | 0,00 | 0,33 | 3,11 | 0,1674 | 0,0039 | |||
| META / Meta Platforms, Inc. | 0,00 | -2,29 | 0,33 | 10,81 | 0,1654 | 0,1654 | |||
| VTI / Vanguard Index Funds - Vanguard Total Stock Market ETF | 0,00 | -6,47 | 0,30 | -2,63 | 0,1493 | 0,1493 | |||
| ADM / Archer-Daniels-Midland Company | 0,01 | -1,09 | 0,27 | 1,51 | 0,1357 | 0,0011 | |||
| HAL / Halliburton Company | 0,01 | -1,42 | 0,24 | 6,19 | 0,1210 | 0,0062 | |||
| LEG / Leggett & Platt, Incorporated | 0,00 | -1,41 | 0,23 | -10,38 | 0,1175 | -0,0146 | |||
| VEU / Vanguard International Equity Index Funds - Vanguard FTSE All-World ex-US ETF | 0,00 | -7,05 | 0,23 | -1,73 | 0,1145 | 0,1145 | |||
| T / AT&T Inc. | 0,01 | 0,00 | 0,22 | 4,23 | 0,1120 | 0,0038 | |||
| DBC / Invesco DB Commodity Index Tracking Fund | 0,00 | -100,00 | 0,00 | -100,00 | 0,0000 | 0,0000 | |||
| QCOM / QUALCOMM Incorporated | 0,00 | -100,00 | 0,00 | -100,00 | -0,5059 |