Grundlæggende statistik
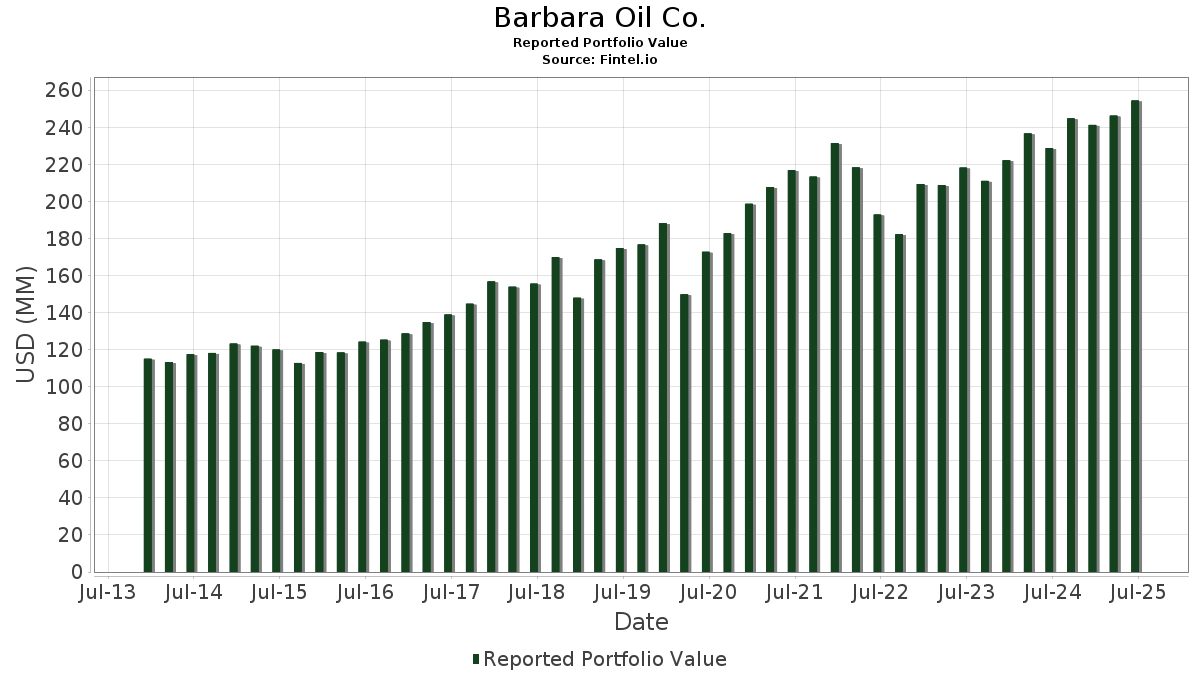
| Porteføljeværdi | $ 254.393.302 |
| Nuværende stillinger | 74 |
Seneste beholdninger, ydeevne, AUM (fra 13F, 13D)
Barbara Oil Co. har afsløret 74 samlede besiddelser i deres seneste SEC-arkivering. Den seneste porteføljeværdi er beregnet til at være $ 254.393.302 USD. Faktiske aktiver under forvaltning (AUM) er denne værdi plus kontanter (som ikke er oplyst). Barbara Oil Co.s største beholdninger er JPMorgan Chase & Co. (US:JPM) , Johnson & Johnson (US:JNJ) , Walmart Inc. (US:WMT) , Microsoft Corporation (US:MSFT) , and The Home Depot, Inc. (US:HD) . Barbara Oil Co.s nye stillinger omfatter AAON, Inc. (US:AAON) , .
Top øger dette kvartal
Vi bruger ændringen i porteføljeallokeringen, fordi dette er den mest meningsfulde metrik. Ændringer kan skyldes handler eller ændringer i aktiekurser.
| Sikkerhed | Aktier (MM) |
Værdi (MM$) |
Portefølje % | ΔPortefølje % |
|---|---|---|---|---|
| 0,07 | 19,42 | 7,6354 | 0,9608 | |
| 0,02 | 10,75 | 4,2273 | 0,9313 | |
| 0,01 | 0,96 | 0,3769 | 0,3769 | |
| 0,01 | 4,56 | 1,7910 | 0,3422 | |
| 0,14 | 14,08 | 5,4485 | 0,3144 | |
| 0,04 | 5,67 | 2,1927 | 0,3003 | |
| 0,02 | 4,71 | 1,8532 | 0,2948 | |
| 0,02 | 1,80 | 0,7065 | 0,2217 | |
| 0,01 | 4,85 | 1,8778 | 0,2035 | |
| 0,07 | 1,59 | 0,6141 | 0,2035 |
Top falder i dette kvartal
Vi bruger ændringen i porteføljeallokeringen, fordi dette er den mest meningsfulde metrik. Ændringer kan skyldes handler eller ændringer i aktiekurser.
| Sikkerhed | Aktier (MM) |
Værdi (MM$) |
Portefølje % | ΔPortefølje % |
|---|---|---|---|---|
| 0,01 | 3,59 | 1,4103 | -1,0358 | |
| 0,10 | 15,58 | 6,0290 | -0,8408 | |
| 0,05 | 7,97 | 3,0825 | -0,3780 | |
| 0,07 | 8,39 | 3,2464 | -0,3644 | |
| 0,06 | 4,93 | 1,9082 | -0,3627 | |
| 0,05 | 5,55 | 2,1825 | -0,3051 | |
| 0,04 | 1,94 | 0,7642 | -0,2761 | |
| 0,01 | 2,07 | 0,8006 | -0,2756 | |
| 0,02 | 5,28 | 2,0439 | -0,2695 | |
| 0,02 | 3,71 | 1,4365 | -0,2653 |
13F og Fondsarkivering
Denne formular blev indsendt den 2025-08-13 for rapporteringsperioden 2025-06-30. Klik på linkikonet for at se den fulde transaktionshistorik.
Opgrader for at låse op for premium-data og eksportere til Excel ![]() .
.
| Sikkerhed | Type | Gennemsnitlig aktiekurs | Aktier (MM) |
Δ Aktier (%) |
Δ Aktier (%) |
Værdi ($MM) |
Portefølje (%) |
ΔPortefølje (%) |
|
|---|---|---|---|---|---|---|---|---|---|
| JPM / JPMorgan Chase & Co. | 0,07 | 0,00 | 19,42 | 18,18 | 7,6354 | 0,9608 | |||
| JNJ / Johnson & Johnson | 0,10 | 0,00 | 15,58 | -7,89 | 6,0290 | -0,8408 | |||
| WMT / Walmart Inc. | 0,14 | 0,00 | 14,08 | 11,38 | 5,4485 | 0,3144 | |||
| MSFT / Microsoft Corporation | 0,02 | 0,00 | 10,75 | 32,52 | 4,2273 | 0,9313 | |||
| HD / The Home Depot, Inc. | 0,02 | 0,00 | 8,80 | 0,05 | 3,4590 | -0,1132 | |||
| GL / Globe Life Inc. | 0,07 | 0,00 | 8,39 | -5,65 | 3,2464 | -0,3644 | |||
| GJR / Strats Trust For Procter & Gambel Security - Preferred Security | 0,05 | 0,00 | 7,97 | -6,51 | 3,0825 | -0,3780 | |||
| TDG / TransDigm Group Incorporated | 0,01 | 0,00 | 7,70 | 9,93 | 2,9804 | 0,1349 | |||
| BK / The Bank of New York Mellon Corporation | 0,08 | 0,00 | 7,29 | 8,63 | 2,8205 | 0,0956 | |||
| EMR / Emerson Electric Co. | 0,04 | 0,00 | 5,67 | 21,61 | 2,1927 | 0,3003 | |||
| XOM / Exxon Mobil Corporation | 0,05 | 0,00 | 5,55 | -9,36 | 2,1825 | -0,3051 | |||
| AJG / Arthur J. Gallagher & Co. | 0,02 | 0,00 | 5,28 | -7,29 | 2,0439 | -0,2695 | |||
| MRK / Merck & Co., Inc. | 0,06 | 0,00 | 4,93 | -11,80 | 1,9082 | -0,3627 | |||
| CAT / Caterpillar Inc. | 0,01 | 0,00 | 4,85 | 17,71 | 1,8778 | 0,2035 | |||
| CSCO / Cisco Systems, Inc. | 0,07 | 0,00 | 4,78 | 12,44 | 1,8805 | 0,1525 | |||
| BA / The Boeing Company | 0,02 | 0,00 | 4,71 | 22,86 | 1,8532 | 0,2948 | |||
| IDXX / IDEXX Laboratories, Inc. | 0,01 | 0,00 | 4,56 | 27,73 | 1,7910 | 0,3422 | |||
| MA / Mastercard Incorporated | 0,01 | 0,00 | 4,43 | 2,52 | 1,7406 | -0,0135 | |||
| LMT / Lockheed Martin Corporation | 0,01 | 0,00 | 3,94 | 3,66 | 1,5475 | 0,0054 | |||
| PFE / Pfizer Inc. | 0,16 | 0,00 | 3,82 | -4,34 | 1,5006 | -0,1201 | |||
| HON / Honeywell International Inc. | 0,02 | 0,00 | 3,73 | 9,98 | 1,4418 | 0,0659 | |||
| ABBV / AbbVie Inc. | 0,02 | 0,00 | 3,71 | -11,41 | 1,4365 | -0,2653 | |||
| ITW / Illinois Tool Works Inc. | 0,01 | 0,00 | 3,71 | -0,32 | 1,4351 | -0,0757 | |||
| UNH / UnitedHealth Group Incorporated | 0,01 | 0,00 | 3,59 | -40,44 | 1,4103 | -1,0358 | |||
| UNP / Union Pacific Corporation | 0,01 | 0,00 | 3,45 | -2,60 | 1,3355 | -0,1037 | |||
| NSC / Norfolk Southern Corporation | 0,01 | 0,00 | 3,20 | 8,07 | 1,2577 | 0,0554 | |||
| PGR / The Progressive Corporation | 0,01 | 0,00 | 3,10 | -5,70 | 1,2168 | -0,1164 | |||
| AVY / Avery Dennison Corporation | 0,02 | 0,00 | 2,72 | -1,41 | 1,0524 | -0,0679 | |||
| CPRT / Copart, Inc. | 0,05 | 0,00 | 2,69 | -13,29 | 1,0570 | -0,2024 | |||
| CSGP / CoStar Group, Inc. | 0,03 | 0,00 | 2,57 | 1,46 | 1,0113 | -0,0183 | |||
| LHX / L3Harris Technologies, Inc. | 0,01 | 0,00 | 2,51 | 19,83 | 0,9860 | 0,1360 | |||
| GWRE / Guidewire Software, Inc. | 0,01 | 0,00 | 2,47 | 25,67 | 0,9566 | 0,1577 | |||
| V / Visa Inc. | 0,01 | 0,00 | 2,47 | 1,31 | 0,9700 | -0,0192 | |||
| WSO / Watsco, Inc. | 0,01 | 0,00 | 2,21 | -13,11 | 0,8680 | -0,1642 | |||
| GOOG / Alphabet Inc. | 0,01 | 0,00 | 2,13 | 13,55 | 0,8368 | 0,0754 | |||
| TXN / Texas Instruments Incorporated | 0,01 | 0,00 | 2,08 | 15,53 | 0,8034 | 0,0736 | |||
| FI / Fiserv, Inc. | 0,01 | 0,00 | 2,07 | -21,93 | 0,8006 | -0,2756 | |||
| ABT / Abbott Laboratories | 0,01 | 0,00 | 2,04 | 2,56 | 0,8020 | -0,0061 | |||
| ADI / Analog Devices, Inc. | 0,01 | 0,00 | 2,02 | 18,03 | 0,7829 | 0,0867 | |||
| LYV / Live Nation Entertainment, Inc. | 0,01 | 0,00 | 1,97 | 15,90 | 0,7616 | 0,0717 | |||
| BMY / Bristol-Myers Squibb Company | 0,04 | 0,00 | 1,94 | -24,09 | 0,7642 | -0,2761 | |||
| AMZN / Amazon.com, Inc. | 0,01 | 0,00 | 1,93 | 15,29 | 0,7589 | 0,0790 | |||
| INTC / Intel Corporation | 0,09 | 0,00 | 1,90 | -1,35 | 0,7484 | -0,0355 | |||
| BAC / Bank of America Corporation | 0,04 | 0,00 | 1,89 | 13,36 | 0,7440 | 0,0662 | |||
| ADBE / Adobe Inc. | 0,00 | 0,00 | 1,89 | 0,91 | 0,7414 | -0,0179 | |||
| VEEV / Veeva Systems Inc. | 0,01 | 0,00 | 1,86 | 24,35 | 0,7330 | 0,1239 | |||
| APPLIED MATLS INC / (308222105) | 0,01 | 1,83 | 0,0000 | ||||||
| APH / Amphenol Corporation | 0,02 | 0,00 | 1,80 | 50,63 | 0,7065 | 0,2217 | |||
| NVDA / NVIDIA Corporation | 0,01 | 0,00 | 1,76 | 45,82 | 0,6918 | 0,2015 | |||
| BWXT / BWX Technologies, Inc. | 0,01 | 0,00 | 1,68 | 46,05 | 0,6508 | 0,1831 | |||
| UBER / Uber Technologies, Inc. | 0,02 | 0,00 | 1,68 | 28,07 | 0,6499 | 0,1172 | |||
| AMT / American Tower Corporation | 0,01 | 0,00 | 1,64 | 1,55 | 0,6346 | -0,0211 | |||
| CWAN / Clearwater Analytics Holdings, Inc. | 0,07 | 91,81 | 1,59 | 56,97 | 0,6141 | 0,2035 | |||
| ADP / Automatic Data Processing, Inc. | 0,01 | 0,00 | 1,54 | 0,98 | 0,6061 | -0,0143 | |||
| ZTS / Zoetis Inc. | 0,01 | 0,00 | 1,50 | -5,31 | 0,5891 | -0,0535 | |||
| INTU / Intuit Inc. | 0,00 | 0,00 | 1,50 | 28,30 | 0,5791 | 0,1053 | |||
| WFC / Wells Fargo & Company | 0,02 | 0,00 | 1,44 | 11,61 | 0,5669 | 0,0421 | |||
| CVX / Chevron Corporation | 0,01 | 0,00 | 1,43 | -14,41 | 0,5629 | -0,1165 | |||
| TYL / Tyler Technologies, Inc. | 0,00 | 0,00 | 1,42 | 1,94 | 0,5506 | -0,0161 | |||
| ICE / Intercontinental Exchange, Inc. | 0,01 | 0,00 | 1,38 | 6,42 | 0,5325 | 0,0070 | |||
| ORLY / O'Reilly Automotive, Inc. | 0,01 | 1.400,00 | 1,35 | -5,66 | 0,5314 | -0,0504 | |||
| FAST / Fastenal Company | 0,03 | 100,00 | 1,34 | 8,39 | 0,5283 | 0,0244 | |||
| BAX / Baxter International Inc. | 0,04 | 0,00 | 1,21 | -11,54 | 0,4687 | -0,0874 | |||
| RTX / RTX Corporation | 0,01 | 0,00 | 1,17 | 10,29 | 0,4520 | 0,0217 | |||
| WM / Waste Management, Inc. | 0,01 | 0,00 | 1,14 | -1,12 | 0,4497 | -0,0204 | |||
| APD / Air Products and Chemicals, Inc. | 0,00 | 0,00 | 1,13 | -4,33 | 0,4435 | -0,0356 | |||
| PCOR / Procore Technologies, Inc. | 0,02 | 0,00 | 1,03 | 3,73 | 0,3978 | -0,0051 | |||
| VZ / Verizon Communications Inc. | 0,02 | 0,00 | 0,97 | -4,61 | 0,3827 | -0,0318 | |||
| AAON / AAON, Inc. | 0,01 | 0,96 | 0,3769 | 0,3769 | |||||
| RYAN / Ryan Specialty Holdings, Inc. | 0,01 | 0,00 | 0,90 | -7,95 | 0,3495 | -0,0490 | |||
| BDX / Becton, Dickinson and Company | 0,01 | 0,00 | 0,86 | -24,80 | 0,3333 | -0,1319 | |||
| WST / West Pharmaceutical Services, Inc. | 0,00 | 0,00 | 0,81 | -2,29 | 0,3133 | -0,0231 | |||
| ACN / Accenture plc | 0,00 | 0,00 | 0,54 | -4,10 | 0,2082 | -0,0199 | |||
| T / AT&T Inc. | 0,01 | 0,00 | 0,43 | 2,36 | 0,1706 | -0,0016 | |||
| LANC / Lancaster Colony Corporation | 0,00 | -100,00 | 0,00 | 0,0000 | |||||
| POOL / Pool Corporation | 0,00 | -100,00 | 0,00 | 0,0000 |