Grundlæggende statistik
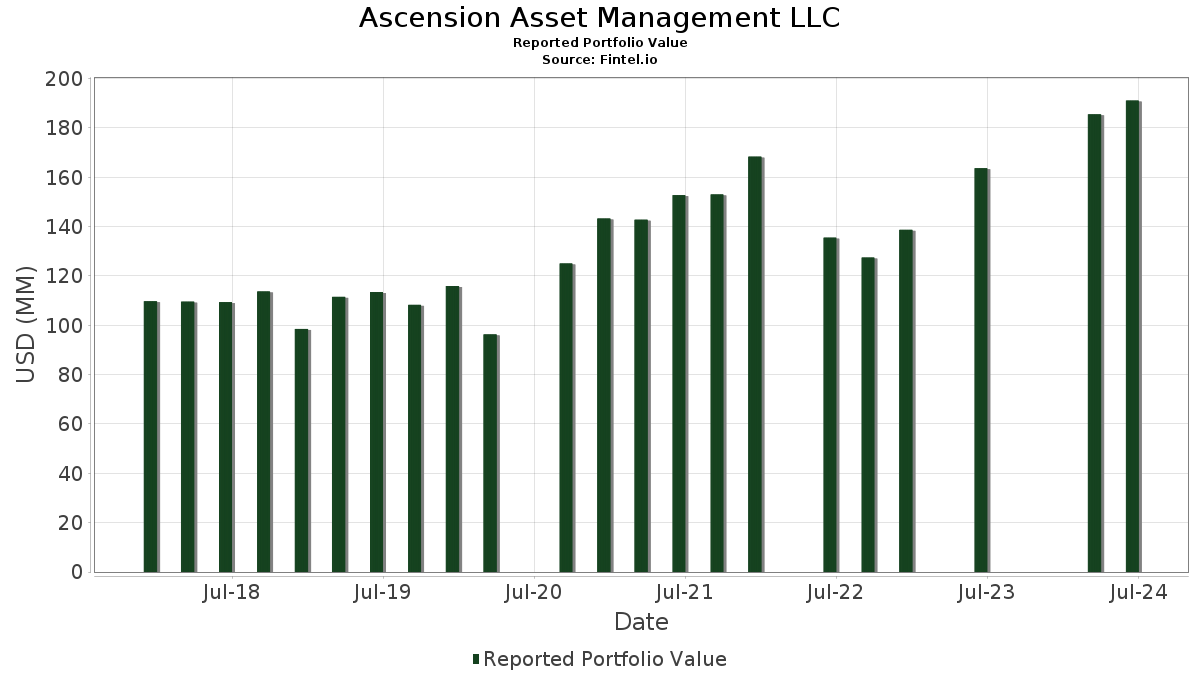
| Porteføljeværdi | $ 191.071.390 |
| Nuværende stillinger | 86 |
Seneste beholdninger, ydeevne, AUM (fra 13F, 13D)
Ascension Asset Management LLC har afsløret 86 samlede besiddelser i deres seneste SEC-arkivering. Den seneste porteføljeværdi er beregnet til at være $ 191.071.390 USD. Faktiske aktiver under forvaltning (AUM) er denne værdi plus kontanter (som ikke er oplyst). Ascension Asset Management LLCs største beholdninger er NVIDIA Corporation (US:NVDA) , Microsoft Corporation (US:MSFT) , Apple Inc. (US:AAPL) , Applied Materials, Inc. (US:AMAT) , and Vanguard World Fund - Vanguard Information Technology ETF (US:VGT) . Ascension Asset Management LLCs nye stillinger omfatter Nucor Corporation (US:NUE) , Eaton Corporation plc (US:ETN) , .
Top øger dette kvartal
Vi bruger ændringen i porteføljeallokeringen, fordi dette er den mest meningsfulde metrik. Ændringer kan skyldes handler eller ændringer i aktiekurser.
| Sikkerhed | Aktier (MM) |
Værdi (MM$) |
Portefølje % | ΔPortefølje % |
|---|---|---|---|---|
| 0,17 | 21,43 | 11,2147 | 2,2521 | |
| 0,01 | 1,55 | 0,8112 | 0,8112 | |
| 0,04 | 8,29 | 4,3402 | 0,5826 | |
| 0,01 | 0,89 | 0,4633 | 0,4633 | |
| 0,00 | 0,78 | 0,4061 | 0,4061 | |
| 0,02 | 3,96 | 2,0725 | 0,2947 | |
| 0,02 | 4,10 | 2,1440 | 0,2304 | |
| 0,01 | 3,06 | 1,6013 | 0,2189 | |
| 0,03 | 6,72 | 3,5152 | 0,2037 | |
| 0,01 | 2,01 | 1,0155 | 0,1557 |
Top falder i dette kvartal
Vi bruger ændringen i porteføljeallokeringen, fordi dette er den mest meningsfulde metrik. Ændringer kan skyldes handler eller ændringer i aktiekurser.
| Sikkerhed | Aktier (MM) |
Værdi (MM$) |
Portefølje % | ΔPortefølje % |
|---|---|---|---|---|
| 0,03 | 4,86 | 2,5449 | -0,3604 | |
| 0,01 | 4,08 | 2,1329 | -0,3043 | |
| 0,01 | 2,54 | 1,3305 | -0,2721 | |
| 0,01 | 3,96 | 2,0720 | -0,2620 | |
| 0,03 | 0,94 | 0,4928 | -0,2311 | |
| 0,00 | 1,66 | 0,8383 | -0,2227 | |
| 0,01 | 2,70 | 1,4108 | -0,2145 | |
| 0,01 | 2,25 | 1,1752 | -0,2028 | |
| 0,01 | 2,69 | 1,4054 | -0,1765 | |
| 0,01 | 2,05 | 1,0718 | -0,1584 |
13F og Fondsarkivering
Denne formular blev indsendt den 2024-08-16 for rapporteringsperioden 2024-06-30. Klik på linkikonet for at se den fulde transaktionshistorik.
Opgrader for at låse op for premium-data og eksportere til Excel ![]() .
.
| Sikkerhed | Type | Gennemsnitlig aktiekurs | Aktier (MM) |
Δ Aktier (%) |
Δ Aktier (%) |
Værdi ($MM) |
Portefølje (%) |
ΔPortefølje (%) |
|
|---|---|---|---|---|---|---|---|---|---|
| NVDA / NVIDIA Corporation | 0,17 | 842,66 | 21,43 | 28,89 | 11,2147 | 2,2521 | |||
| MSFT / Microsoft Corporation | 0,02 | -3,48 | 10,55 | 2,55 | 5,5228 | -0,0248 | |||
| AAPL / Apple Inc. | 0,04 | -3,14 | 8,29 | 18,97 | 4,3402 | 0,5826 | |||
| AMAT / Applied Materials, Inc. | 0,03 | -4,45 | 6,72 | 9,35 | 3,5152 | 0,2037 | |||
| VGT / Vanguard World Fund - Vanguard Information Technology ETF | 0,01 | -2,01 | 6,05 | 7,75 | 3,0605 | 0,1541 | |||
| JNJ / Johnson & Johnson | 0,03 | -2,35 | 4,86 | -9,78 | 2,5449 | -0,3604 | |||
| QCOM / QUALCOMM Incorporated | 0,02 | -1,91 | 4,10 | 15,41 | 2,1440 | 0,2304 | |||
| PH / Parker-Hannifin Corporation | 0,01 | -4,84 | 4,08 | -13,39 | 2,1329 | -0,3043 | |||
| GOOG / Alphabet Inc. | 0,02 | -0,32 | 3,96 | 20,11 | 2,0725 | 0,2947 | |||
| TMO / Thermo Fisher Scientific Inc. | 0,01 | -3,89 | 3,96 | -8,57 | 2,0720 | -0,2620 | |||
| RTX / RTX Corporation | 0,04 | -4,56 | 3,68 | -1,76 | 1,9263 | -0,0933 | |||
| ADI / Analog Devices, Inc. | 0,02 | -4,56 | 3,58 | 10,14 | 1,8756 | 0,1216 | |||
| COST / Costco Wholesale Corporation | 0,00 | -3,27 | 3,14 | 12,21 | 1,6460 | 0,1353 | |||
| TXN / Texas Instruments Incorporated | 0,02 | -3,05 | 3,09 | 8,26 | 1,6183 | 0,0786 | |||
| PANW / Palo Alto Networks, Inc. | 0,01 | 0,00 | 3,06 | 19,31 | 1,6013 | 0,2189 | |||
| AMZN / Amazon.com, Inc. | 0,01 | -3,31 | 2,85 | 3,60 | 1,4913 | 0,0084 | |||
| LLY / Eli Lilly and Company | 0,00 | -1,57 | 2,84 | 14,55 | 1,4879 | 0,1500 | |||
| LMT / Lockheed Martin Corporation | 0,01 | -1,26 | 2,75 | 1,36 | 1,4387 | -0,0228 | |||
| LIN / Linde plc | 0,01 | -5,39 | 2,70 | -10,58 | 1,4108 | -0,2145 | |||
| ADP / Automatic Data Processing, Inc. | 0,01 | -4,26 | 2,69 | -8,49 | 1,4054 | -0,1765 | |||
| MRK / Merck & Co., Inc. | 0,02 | -1,03 | 2,66 | -7,15 | 1,3946 | -0,1525 | |||
| NSC / Norfolk Southern Corporation | 0,01 | -2,47 | 2,54 | -17,84 | 1,3305 | -0,2721 | |||
| GJR / Strats Trust For Procter & Gambel Security - Preferred Security | 0,01 | -1,74 | 2,46 | -0,12 | 1,2464 | -0,0307 | |||
| LHX / L3Harris Technologies, Inc. | 0,01 | -1,41 | 2,36 | 3,92 | 1,2366 | 0,0107 | |||
| ITW / Illinois Tool Works Inc. | 0,01 | -0,52 | 2,25 | -12,17 | 1,1752 | -0,2028 | |||
| HON / Honeywell International Inc. | 0,01 | -0,95 | 2,22 | 3,02 | 1,1612 | 0,0005 | |||
| FTXP / Foothills Exploration, Inc. | 0,00 | 0,00 | 2,19 | 18,03 | 1,1100 | 0,1476 | |||
| AMGN / Amgen Inc. | 0,01 | -0,37 | 2,10 | 9,47 | 1,1017 | 0,0652 | |||
| HD / The Home Depot, Inc. | 0,01 | 0,00 | 2,05 | -10,30 | 1,0718 | -0,1584 | |||
| UNP / Union Pacific Corporation | 0,01 | -0,82 | 2,05 | -8,79 | 1,0707 | -0,1380 | |||
| AMD / Advanced Micro Devices, Inc. | 0,01 | -0,20 | 2,02 | -10,32 | 1,0548 | -0,1566 | |||
| ANET / Arista Networks Inc | 0,01 | 0,00 | 2,01 | 20,84 | 1,0155 | 0,1557 | |||
| CME / CME Group Inc. | 0,01 | -0,74 | 1,98 | -9,38 | 1,0372 | -0,1414 | |||
| LRCX / Lam Research Corporation | 0,00 | 0,00 | 1,98 | 9,57 | 1,0029 | 0,0665 | |||
| CINF / Cincinnati Financial Corporation | 0,02 | 0,00 | 1,92 | -4,86 | 1,0034 | -0,0833 | |||
| WAB / Westinghouse Air Brake Technologies Corporation | 0,01 | 0,00 | 1,89 | 8,49 | 0,9898 | 0,0501 | |||
| CSCO / Cisco Systems, Inc. | 0,04 | 0,00 | 1,86 | -4,81 | 0,9745 | -0,0800 | |||
| APD / Air Products and Chemicals, Inc. | 0,01 | -1,74 | 1,75 | 4,67 | 0,9157 | 0,0145 | |||
| PEP / PepsiCo, Inc. | 0,01 | -1,09 | 1,72 | -6,79 | 0,8990 | -0,0944 | |||
| CDNS / Cadence Design Systems, Inc. | 0,01 | 0,00 | 1,72 | -1,15 | 0,8979 | -0,0376 | |||
| BRK.A / Berkshire Hathaway Inc. | 0,00 | -16,42 | 1,66 | -19,14 | 0,8383 | -0,2227 | |||
| ABBV / AbbVie Inc. | 0,01 | -6,49 | 1,61 | -11,96 | 0,8404 | -0,1424 | |||
| XOM / Exxon Mobil Corporation | 0,01 | 1,55 | 0,8112 | 0,8112 | |||||
| EW / Edwards Lifesciences Corporation | 0,02 | -7,11 | 1,54 | -10,22 | 0,8049 | -0,1185 | |||
| CMI / Cummins Inc. | 0,01 | 0,00 | 1,51 | -6,02 | 0,7928 | -0,0761 | |||
| AWK / American Water Works Company, Inc. | 0,01 | 0,00 | 1,51 | 5,68 | 0,7886 | 0,0200 | |||
| AVAV / AeroVironment, Inc. | 0,01 | 0,00 | 1,48 | 18,86 | 0,7467 | 0,1037 | |||
| GPC / Genuine Parts Company | 0,01 | 0,00 | 1,47 | -10,72 | 0,7674 | -0,1180 | |||
| ADBE / Adobe Inc. | 0,00 | 0,00 | 1,43 | 10,15 | 0,7501 | 0,0483 | |||
| ROP / Roper Technologies, Inc. | 0,00 | 0,00 | 1,43 | 0,49 | 0,7493 | -0,0186 | |||
| CVX / Chevron Corporation | 0,01 | -1,94 | 1,38 | -2,74 | 0,7245 | -0,0429 | |||
| RMD / ResMed Inc. | 0,01 | 0,00 | 1,36 | -3,34 | 0,7128 | -0,0468 | |||
| BA / The Boeing Company | 0,01 | -3,98 | 1,34 | -9,46 | 0,7016 | -0,0964 | |||
| KMB / Kimberly-Clark Corporation | 0,01 | 0,00 | 1,32 | 6,88 | 0,6909 | 0,0248 | |||
| SYY / Sysco Corporation | 0,02 | 0,00 | 1,29 | -12,05 | 0,6725 | -0,1152 | |||
| UPS / United Parcel Service, Inc. | 0,01 | -3,16 | 1,26 | -10,83 | 0,6595 | -0,1023 | |||
| TECH / Bio-Techne Corporation | 0,02 | 0,00 | 1,26 | 1,78 | 0,6582 | -0,0078 | |||
| CTSH / Cognizant Technology Solutions Corporation | 0,02 | -2,14 | 1,25 | -9,19 | 0,6519 | -0,0876 | |||
| KO / The Coca-Cola Company | 0,02 | 0,00 | 1,22 | 4,09 | 0,6396 | 0,0064 | |||
| CRM / Salesforce, Inc. | 0,00 | 0,00 | 1,21 | -14,65 | 0,6344 | -0,1311 | |||
| XYL / Xylem Inc. | 0,01 | -5,24 | 1,10 | 0,64 | 0,5774 | -0,0137 | |||
| ABT / Abbott Laboratories | 0,01 | -1,88 | 1,08 | -10,28 | 0,5663 | -0,0840 | |||
| CTRA / Coterra Energy Inc. | 0,04 | -1,24 | 1,06 | -5,52 | 0,5555 | -0,0502 | |||
| SNOW / Snowflake Inc. | 0,01 | 0,00 | 0,96 | -16,39 | 0,5047 | -0,1172 | |||
| INTC / Intel Corporation | 0,03 | 0,00 | 0,94 | -29,88 | 0,4928 | -0,2311 | |||
| DVN / Devon Energy Corporation | 0,02 | -1,00 | 0,94 | -6,48 | 0,4912 | -0,0498 | |||
| NUE / Nucor Corporation | 0,01 | 0,89 | 0,4633 | 0,4633 | |||||
| MTD / Mettler-Toledo International Inc. | 0,00 | 0,00 | 0,84 | 5,01 | 0,4244 | 0,0107 | |||
| ETN / Eaton Corporation plc | 0,00 | 0,78 | 0,4061 | 0,4061 | |||||
| CI / The Cigna Group | 0,00 | 0,00 | 0,76 | -8,93 | 0,3953 | -0,0521 | |||
| GLW / Corning Incorporated | 0,02 | -6,07 | 0,72 | 10,58 | 0,3779 | 0,0263 | |||
| DHR / Danaher Corporation | 0,00 | 0,00 | 0,72 | 0,14 | 0,3759 | -0,0111 | |||
| JPM / JPMorgan Chase & Co. | 0,00 | -8,73 | 0,70 | -7,93 | 0,3652 | -0,0430 | |||
| CLX / The Clorox Company | 0,00 | 0,00 | 0,61 | -10,95 | 0,3196 | -0,0497 | |||
| DELL / Dell Technologies Inc. | 0,00 | 0,00 | 0,59 | 20,86 | 0,3095 | 0,0457 | |||
| MMM / 3M Company | 0,01 | -14,96 | 0,54 | -18,02 | 0,2812 | -0,0723 | |||
| MCD / McDonald's Corporation | 0,00 | 0,00 | 0,51 | -9,59 | 0,2667 | -0,0372 | |||
| FITB / Fifth Third Bancorp | 0,01 | -3,53 | 0,50 | -5,50 | 0,2524 | -0,0206 | |||
| GIS / General Mills, Inc. | 0,01 | 0,00 | 0,49 | -9,48 | 0,2549 | -0,0355 | |||
| MLI / Mueller Industries, Inc. | 0,01 | 0,00 | 0,46 | 5,57 | 0,2305 | 0,0071 | |||
| AVGO / Broadcom Inc. | 0,00 | 900,00 | 0,37 | 21,38 | 0,1933 | 0,0289 | |||
| SO / The Southern Company | 0,00 | 0,00 | 0,33 | 8,12 | 0,1746 | 0,0083 | |||
| BAX / Baxter International Inc. | 0,01 | 0,00 | 0,33 | -21,67 | 0,1724 | -0,0456 | |||
| WEC / WEC Energy Group, Inc. | 0,00 | 0,00 | 0,27 | -4,53 | 0,1390 | -0,0099 | |||
| VOO / Vanguard Index Funds - Vanguard S&P 500 ETF | 0,00 | -28,57 | 0,25 | -25,60 | 0,1266 | -0,0477 | |||
| KEY / KeyCorp | 0,01 | 0,00 | 0,17 | -10,05 | 0,0893 | -0,0130 | |||
| NOC / Northrop Grumman Corporation | 0,00 | -100,00 | 0,00 | 0,0000 | |||||
| PXD / Pioneer Natural Resources Company | 0,00 | -100,00 | 0,00 | 0,0000 | |||||
| GE / General Electric Company | 0,00 | -100,00 | 0,00 | -100,00 | -0,1146 |