Grundlæggende statistik
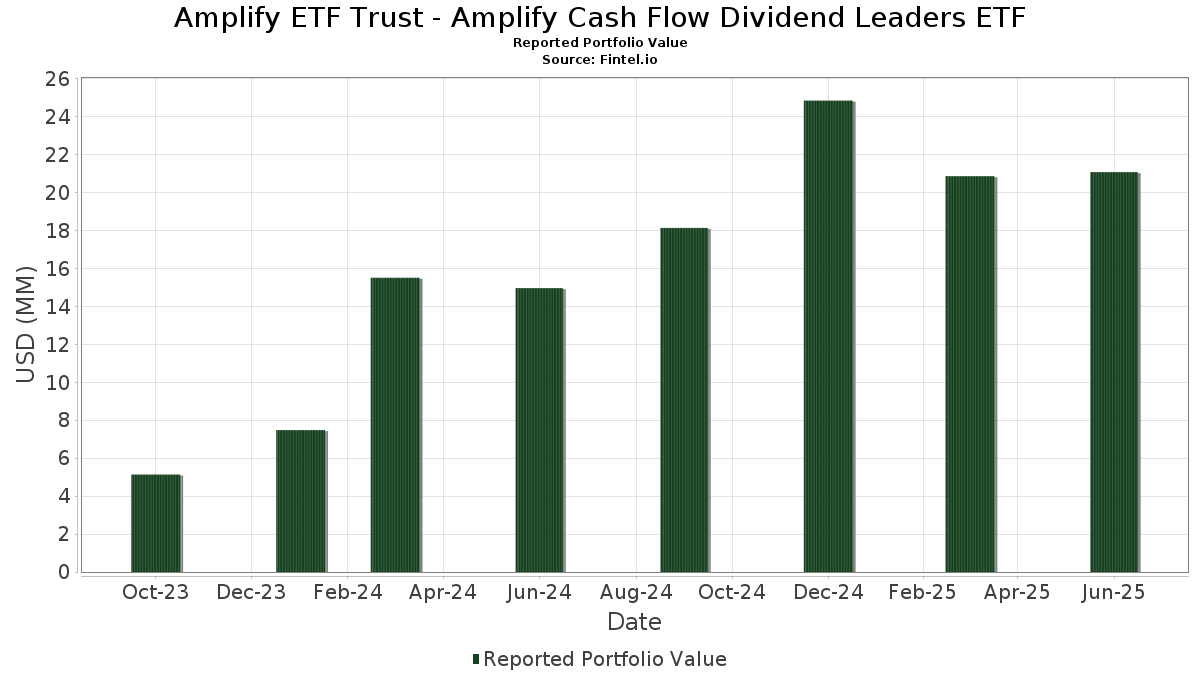
| Porteføljeværdi | $ 21.073.607 |
| Nuværende stillinger | 51 |
Seneste beholdninger, ydeevne, AUM (fra 13F, 13D)
Amplify ETF Trust - Amplify Cash Flow Dividend Leaders ETF har afsløret 51 samlede besiddelser i deres seneste SEC-arkivering. Den seneste porteføljeværdi er beregnet til at være $ 21.073.607 USD. Faktiske aktiver under forvaltning (AUM) er denne værdi plus kontanter (som ikke er oplyst). Amplify ETF Trust - Amplify Cash Flow Dividend Leaders ETFs største beholdninger er Dell Technologies Inc. (US:DELL) , Tapestry, Inc. (US:TPR) , WESCO International, Inc. (US:WCC) , Alcoa Corporation (US:AA) , and FedEx Corporation (US:FDX) . Amplify ETF Trust - Amplify Cash Flow Dividend Leaders ETFs nye stillinger omfatter WESCO International, Inc. (US:WCC) , Alcoa Corporation (US:AA) , WEX Inc. (US:WEX) , Crocs, Inc. (US:CROX) , and .
Top øger dette kvartal
Vi bruger ændringen i porteføljeallokeringen, fordi dette er den mest meningsfulde metrik. Ændringer kan skyldes handler eller ændringer i aktiekurser.
| Sikkerhed | Aktier (MM) |
Værdi (MM$) |
Portefølje % | ΔPortefølje % |
|---|---|---|---|---|
| 0,00 | 0,54 | 2,5834 | 2,5834 | |
| 0,02 | 0,54 | 2,5452 | 2,5452 | |
| 0,02 | 0,48 | 2,2625 | 2,2625 | |
| 0,01 | 0,44 | 2,0794 | 2,0794 | |
| 0,00 | 0,44 | 2,0720 | 2,0720 | |
| 0,00 | 0,41 | 1,9256 | 1,9256 | |
| 0,01 | 0,38 | 1,8115 | 1,0784 | |
| 0,01 | 0,41 | 1,9609 | 0,7182 | |
| 0,02 | 0,40 | 1,8782 | 0,5538 | |
| 0,00 | 0,42 | 2,0036 | 0,5319 |
Top falder i dette kvartal
Vi bruger ændringen i porteføljeallokeringen, fordi dette er den mest meningsfulde metrik. Ændringer kan skyldes handler eller ændringer i aktiekurser.
| Sikkerhed | Aktier (MM) |
Værdi (MM$) |
Portefølje % | ΔPortefølje % |
|---|---|---|---|---|
| 0,00 | 0,00 | -2,6773 | ||
| 0,00 | 0,00 | -1,3253 | ||
| 0,00 | 0,00 | -1,3242 | ||
| 0,00 | 0,00 | -1,2316 | ||
| 0,00 | 0,00 | -0,9617 | ||
| 0,01 | 0,39 | 1,8575 | -0,5417 | |
| 0,00 | 0,45 | 2,1361 | -0,3687 | |
| 0,03 | 0,39 | 1,8437 | -0,2523 | |
| 0,01 | 0,48 | 2,3028 | -0,1853 | |
| 0,01 | 0,51 | 2,4128 | -0,1555 |
13F og Fondsarkivering
Denne formular blev indsendt den 2025-08-27 for rapporteringsperioden 2025-06-30. Klik på linkikonet for at se den fulde transaktionshistorik.
Opgrader for at låse op for premium-data og eksportere til Excel ![]() .
.
| Sikkerhed | Type | Gennemsnitlig aktiekurs | Aktier (MM) |
Δ Aktier (%) |
Δ Aktier (%) |
Værdi ($MM) |
Portefølje (%) |
ΔPortefølje (%) |
|
|---|---|---|---|---|---|---|---|---|---|
| DELL / Dell Technologies Inc. | 0,00 | 81,91 | 0,57 | 169,48 | 2,7314 | -0,1246 | |||
| TPR / Tapestry, Inc. | 0,01 | -9,57 | 0,56 | 12,90 | 2,6627 | 0,2787 | |||
| WCC / WESCO International, Inc. | 0,00 | 0,54 | 2,5834 | 2,5834 | |||||
| AA / Alcoa Corporation | 0,02 | 0,54 | 2,5452 | 2,5452 | |||||
| FDX / FedEx Corporation | 0,00 | 12,09 | 0,53 | 4,35 | 2,5148 | 0,0853 | |||
| FNF / Fidelity National Financial, Inc. | 0,01 | 14,30 | 0,53 | -1,50 | 2,4973 | -0,0638 | |||
| G / Genpact Limited | 0,01 | 15,46 | 0,52 | 0,97 | 2,4878 | -0,0027 | |||
| OC / Owens Corning | 0,00 | 6,83 | 0,52 | 2,77 | 2,4753 | 0,0455 | |||
| QCOM / QUALCOMM Incorporated | 0,00 | 52,12 | 0,52 | 43,25 | 2,4752 | 0,1278 | |||
| MTDR / Matador Resources Company | 0,01 | 1,56 | 0,51 | -5,23 | 2,4128 | -0,1555 | |||
| TAP / Molson Coors Beverage Company | 0,01 | 18,29 | 0,48 | -6,56 | 2,3028 | -0,1853 | |||
| BBWI / Bath & Body Works, Inc. | 0,02 | 0,48 | 2,2625 | 2,2625 | |||||
| WBD / Warner Bros. Discovery, Inc. | 0,04 | -16,94 | 0,45 | -10,10 | 2,1623 | 0,1257 | |||
| NRG / NRG Energy, Inc. | 0,00 | -48,81 | 0,45 | -13,82 | 2,1361 | -0,3687 | |||
| ANF / Abercrombie & Fitch Co. | 0,01 | 0,44 | 2,0794 | 2,0794 | |||||
| WEX / WEX Inc. | 0,00 | 0,44 | 2,0720 | 2,0720 | |||||
| PVH / PVH Corp. | 0,01 | 34,58 | 0,43 | -12,85 | 2,0678 | 0,0588 | |||
| SIRI / Sirius XM Holdings Inc. | 0,02 | 2,81 | 0,42 | 4,95 | 2,0165 | 0,0726 | |||
| CMCSA / Comcast Corporation | 0,01 | 26,24 | 0,42 | 22,25 | 2,0117 | 0,3481 | |||
| FOXA / Fox Corporation | 0,01 | 29,59 | 0,42 | 28,66 | 2,0068 | 0,4276 | |||
| LEA / Lear Corporation | 0,00 | 27,68 | 0,42 | 37,58 | 2,0036 | 0,5319 | |||
| GPN / Global Payments Inc. | 0,01 | 63,69 | 0,42 | 33,87 | 1,9932 | 0,4890 | |||
| NXST / Nexstar Media Group, Inc. | 0,00 | 1,17 | 0,42 | -2,34 | 1,9890 | -0,0680 | |||
| TKR / The Timken Company | 0,01 | 57,83 | 0,41 | 59,69 | 1,9609 | 0,7182 | |||
| OMC / Omnicom Group Inc. | 0,01 | 42,57 | 0,41 | 23,94 | 1,9461 | 0,3577 | |||
| MTCH / Match Group, Inc. | 0,01 | 12,26 | 0,41 | 11,17 | 1,9422 | 0,1777 | |||
| GAP / The Gap, Inc. | 0,02 | -8,95 | 0,41 | -15,91 | 1,9353 | -0,0180 | |||
| EXPE / Expedia Group, Inc. | 0,00 | 20,41 | 0,41 | 20,83 | 1,9303 | 0,3172 | |||
| CROX / Crocs, Inc. | 0,00 | 0,41 | 1,9256 | 1,9256 | |||||
| PR / Permian Resources Corporation | 0,03 | 25,21 | 0,40 | 22,98 | 1,8862 | 0,3395 | |||
| IPG / The Interpublic Group of Companies, Inc. | 0,02 | 58,87 | 0,40 | 43,64 | 1,8782 | 0,5538 | |||
| SLB / Schlumberger Limited | 0,01 | 61,61 | 0,39 | 30,77 | 1,8607 | 0,4230 | |||
| OVV / Ovintiv Inc. | 0,01 | 142,86 | 0,39 | 117,88 | 1,8575 | -0,5417 | |||
| APA / APA Corporation | 0,02 | 23,36 | 0,39 | 7,46 | 1,8496 | 0,1097 | |||
| NOV / NOV Inc. | 0,03 | 8,75 | 0,39 | -11,24 | 1,8437 | -0,2523 | |||
| FAF / First American Financial Corporation | 0,01 | 41,63 | 0,39 | 32,65 | 1,8370 | 0,4369 | |||
| BBY / Best Buy Co., Inc. | 0,01 | 650,79 | 0,38 | 605,56 | 1,8115 | 1,0784 | |||
| VFC / V.F. Corporation | 0,03 | 100,34 | 0,38 | 74,19 | 1,7991 | 0,3464 | |||
| MGY / Magnolia Oil & Gas Corporation | 0,02 | 31,05 | 0,36 | 16,77 | 1,7232 | 0,2313 | |||
| HAL / Halliburton Company | 0,02 | 49,60 | 0,35 | 20,48 | 1,6786 | 0,2683 | |||
| VNT / Vontier Corporation | 0,01 | 26,78 | 0,35 | 42,39 | 1,6478 | 0,4795 | |||
| OSK / Oshkosh Corporation | 0,00 | 7,27 | 0,34 | 29,66 | 1,6248 | 0,3575 | |||
| ALSN / Allison Transmission Holdings, Inc. | 0,00 | 35,66 | 0,34 | 34,92 | 1,6168 | 0,4048 | |||
| NTAP / NetApp, Inc. | 0,00 | 12,12 | 0,33 | 36,21 | 1,5749 | 0,4056 | |||
| CBT / Cabot Corporation | 0,00 | 58,03 | 0,32 | 42,60 | 1,5119 | 0,4410 | |||
| SEE / Sealed Air Corporation | 0,01 | 33,55 | 0,31 | 43,38 | 1,4946 | 0,4421 | |||
| VLO / Valero Energy Corporation | 0,00 | -3,35 | 0,31 | -1,57 | 1,4935 | -0,0395 | |||
| GNTX / Gentex Corporation | 0,01 | 53,87 | 0,30 | 45,10 | 1,4104 | 0,4297 | |||
| EOG / EOG Resources, Inc. | 0,00 | 39,11 | 0,28 | 30,09 | 1,3369 | 0,2965 | |||
| ZBH / Zimmer Biomet Holdings, Inc. | 0,00 | 33,67 | 0,28 | 7,42 | 1,3118 | 0,0822 | |||
| US8252528851 / Invesco Government & Agency Portfolio, Institutional Class | 0,21 | 88,73 | 0,21 | 89,29 | 1,0116 | 0,4704 | |||
| EME / EMCOR Group, Inc. | 0,00 | -100,00 | 0,00 | -100,00 | -0,9617 | ||||
| UHS / Universal Health Services, Inc. | 0,00 | -100,00 | 0,00 | -100,00 | -1,3242 | ||||
| HCA / HCA Healthcare, Inc. | 0,00 | -100,00 | 0,00 | -100,00 | -2,6773 | ||||
| HPE / Hewlett Packard Enterprise Company | 0,00 | -100,00 | 0,00 | -100,00 | -1,3253 | ||||
| VZ / Verizon Communications Inc. | 0,00 | -100,00 | 0,00 | -100,00 | -1,2316 |