Grundlæggende statistik
| Porteføljeværdi | $ 49.375.000 |
| Nuværende stillinger | 98 |
Seneste beholdninger, ydeevne, AUM (fra 13F, 13D)
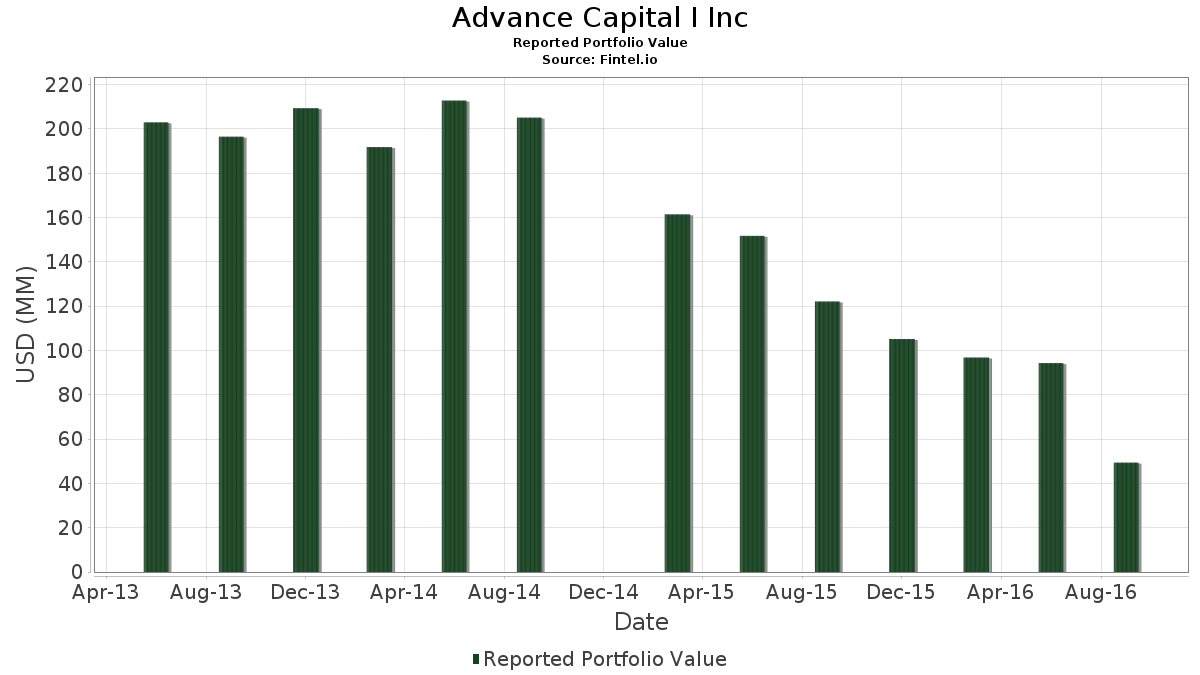
Advance Capital I Inc har afsløret 98 samlede besiddelser i deres seneste SEC-arkivering. Den seneste porteføljeværdi er beregnet til at være $ 49.375.000 USD. Faktiske aktiver under forvaltning (AUM) er denne værdi plus kontanter (som ikke er oplyst). Advance Capital I Incs største beholdninger er Xilinx, Inc. (US:XLNX) , Sysco Corporation (US:SYY) , Hormel Foods Corporation (US:HRL) , UGI Corporation (US:UGI) , and Global Payments Inc. (US:GPN) . Advance Capital I Incs nye stillinger omfatter Huntington Bancshares Incorporated (US:HBAN) , WestRock Company (US:WRK) , .
Top øger dette kvartal
Vi bruger ændringen i porteføljeallokeringen, fordi dette er den mest meningsfulde metrik. Ændringer kan skyldes handler eller ændringer i aktiekurser.
| Sikkerhed | Aktier (MM) |
Værdi (MM$) |
Portefølje % | ΔPortefølje % |
|---|---|---|---|---|
| 0,03 | 1,25 | 2,5276 | 2,5276 | |
| 0,01 | 0,90 | 1,8147 | 1,8147 | |
| 0,03 | 1,33 | 2,6896 | 1,8128 | |
| 0,02 | 1,12 | 2,2724 | 1,3606 | |
| 0,03 | 1,40 | 2,8294 | 1,2942 | |
| 0,01 | 0,62 | 1,2618 | 1,2618 | |
| 0,01 | 0,90 | 1,8309 | 1,2297 | |
| 0,00 | 0,58 | 1,1787 | 1,1787 | |
| 0,02 | 0,55 | 1,1058 | 1,1058 | |
| 0,00 | 0,53 | 1,0653 | 1,0653 |
Top falder i dette kvartal
Vi bruger ændringen i porteføljeallokeringen, fordi dette er den mest meningsfulde metrik. Ændringer kan skyldes handler eller ændringer i aktiekurser.
| Sikkerhed | Aktier (MM) |
Værdi (MM$) |
Portefølje % | ΔPortefølje % |
|---|---|---|---|---|
| 0,00 | 0,43 | 0,8729 | -1,1585 | |
| 0,00 | 0,00 | -1,1503 | ||
| 0,00 | 0,00 | -0,9107 | ||
| 0,00 | 0,00 | -0,9001 | ||
| 0,00 | 0,00 | -0,7962 | ||
| 0,00 | 0,00 | -0,7634 | ||
| 0,00 | 0,00 | -0,7634 | ||
| 0,00 | 0,00 | -0,7581 | ||
| 0,00 | 0,00 | -0,7379 | ||
| 0,00 | 0,00 | -0,7019 |
13F og Fondsarkivering
Denne formular blev indsendt den 2016-11-01 for rapporteringsperioden 2016-09-30. Klik på linkikonet for at se den fulde transaktionshistorik.
Opgrader for at låse op for premium-data og eksportere til Excel ![]() .
.
| Sikkerhed | Type | Gennemsnitlig aktiekurs | Aktier (MM) |
Δ Aktier (%) |
Δ Aktier (%) |
Værdi ($MM) |
Portefølje (%) |
ΔPortefølje (%) |
|
|---|---|---|---|---|---|---|---|---|---|
| XLNX / Xilinx, Inc. | 0,03 | -18,15 | 1,40 | -3,52 | 2,8294 | 1,2942 | |||
| SYY / Sysco Corporation | 0,03 | 66,26 | 1,33 | 60,58 | 2,6896 | 1,8128 | |||
| HRL / Hormel Foods Corporation | 0,03 | 0,00 | 1,25 | 2,5276 | 2,5276 | ||||
| UGI / UGI Corporation | 0,02 | 30,53 | 1,12 | 30,47 | 2,2724 | 1,3606 | |||
| GPN / Global Payments Inc. | 0,01 | -33,03 | 1,12 | -27,96 | 2,2704 | 0,6207 | |||
| ADI / Analog Devices, Inc. | 0,02 | -41,61 | 1,08 | -33,58 | 2,1792 | 0,4617 | |||
| HSY / The Hershey Company | 0,01 | -41,58 | 1,06 | -50,79 | 2,1489 | -0,1370 | |||
| XRAY / DENTSPLY SIRONA Inc. | 0,02 | -29,92 | 1,06 | -32,87 | 2,1428 | 0,4719 | |||
| DOV / Dover Corporation | 0,01 | -38,64 | 0,99 | -34,82 | 2,0132 | 0,3963 | |||
| BCR / C. R. Bard, Inc. - Corporate Bond/Note | 0,00 | -42,67 | 0,96 | -45,35 | 1,9524 | 0,0822 | |||
| VFC / V.F. Corporation | 0,02 | -21,20 | 0,96 | -28,19 | 1,9403 | 0,5259 | |||
| GPC / Genuine Parts Company | 0,01 | 60,71 | 0,90 | 59,44 | 1,8309 | 1,2297 | |||
| EXPD / Expeditors International of Washington, Inc. | 0,02 | -38,81 | 0,90 | -35,71 | 1,8268 | 0,3393 | |||
| HAS / Hasbro, Inc. | 0,01 | -26,14 | 0,90 | -30,27 | 1,8147 | 1,8147 | |||
| MAT / Mattel, Inc. | 0,03 | -18,96 | 0,89 | -21,60 | 1,8086 | 0,6010 | |||
| CHRW / C.H. Robinson Worldwide, Inc. | 0,01 | -41,08 | 0,77 | -44,10 | 1,5554 | 0,0987 | |||
| AYI / Acuity Inc. | 0,00 | -50,00 | 0,77 | -46,66 | 1,5534 | 0,0288 | |||
| IFF / International Flavors & Fragrances Inc. | 0,00 | -35,62 | 0,67 | -26,96 | 1,3610 | 0,3856 | |||
| AAP / Advance Auto Parts, Inc. | 0,00 | -40,00 | 0,67 | -44,64 | 1,3590 | 0,0740 | |||
| US8865471085 / Tiffany & Co. | 0,01 | 19,74 | 0,66 | 43,38 | 1,3387 | 0,8500 | |||
| SYF / Synchrony Financial | 0,02 | -29,41 | 0,64 | -21,91 | 1,2922 | 0,4260 | |||
| ECL / Ecolab Inc. | 0,01 | -38,82 | 0,63 | -37,20 | 1,2820 | 0,2133 | |||
| INTC / Intel Corporation | 0,02 | -45,42 | 0,63 | -37,25 | 1,2759 | 0,2115 | |||
| WMT / Walmart Inc. | 0,01 | -38,30 | 0,63 | -39,13 | 1,2699 | 0,1778 | |||
| ITW / Illinois Tool Works Inc. | 0,01 | 0,00 | 0,62 | 1,2618 | 1,2618 | ||||
| PG / The Procter & Gamble Company | 0,01 | -44,07 | 0,59 | -40,74 | 1,1990 | 0,1398 | |||
| LEA / Lear Corporation | 0,00 | -33,33 | 0,58 | -20,60 | 1,1787 | 1,1787 | |||
| JNPR / Juniper Networks, Inc. | 0,02 | -32,39 | 0,58 | -27,69 | 1,1686 | 0,3226 | |||
| PEP / PepsiCo, Inc. | 0,01 | -45,26 | 0,57 | -43,74 | 1,1463 | 0,0797 | |||
| HD / The Home Depot, Inc. | 0,00 | -29,03 | 0,57 | -28,54 | 1,1463 | 0,3066 | |||
| EBAY / eBay Inc. | 0,02 | -36,88 | 0,55 | -11,36 | 1,1058 | 1,1058 | |||
| MDT / Medtronic plc | 0,01 | -51,16 | 0,54 | -51,39 | 1,1018 | -0,0846 | |||
| FLO / Flowers Foods, Inc. | 0,04 | -59,41 | 0,54 | -67,27 | 1,0896 | -0,6534 | |||
| FICO / Fair Isaac Corporation | 0,00 | -33,85 | 0,54 | -27,07 | 1,0856 | 0,3063 | |||
| JNJ / Johnson & Johnson | 0,00 | -50,00 | 0,53 | -51,28 | 1,0775 | -0,0803 | |||
| JW.A / John Wiley & Sons Inc. - Class A | 0,01 | -9,73 | 0,53 | -10,85 | 1,0653 | 0,4398 | |||
| SHW / The Sherwin-Williams Company | 0,00 | 0,00 | 0,53 | 1,0653 | 1,0653 | ||||
| EMR / Emerson Electric Co. | 0,01 | 0,00 | 0,51 | 1,0370 | 1,0370 | ||||
| WHR / Whirlpool Corporation | 0,00 | 0,00 | 0,50 | 1,0187 | 1,0187 | ||||
| / Wyndham Destinations, Inc. | 0,01 | -25,25 | 0,50 | -29,36 | 1,0086 | 0,2612 | |||
| GIS / General Mills, Inc. | 0,01 | -48,34 | 0,50 | -53,76 | 1,0086 | -0,1332 | |||
| MCD / McDonald's Corporation | 0,00 | -35,38 | 0,48 | -37,98 | 0,9823 | 0,1532 | |||
| AAN / The Aaron's Company, Inc. | 0,02 | -10,38 | 0,48 | 4,09 | 0,9782 | 0,4863 | |||
| NKE / NIKE, Inc. | 0,01 | -35,71 | 0,47 | -38,68 | 0,9600 | 0,1404 | |||
| KORS / Michael Kors Holdings Ltd. | 0,01 | 0,00 | 0,47 | 0,9580 | 0,9580 | ||||
| ADS / Bread Financial Holdings Inc | 0,00 | -42,11 | 0,47 | -36,56 | 0,9559 | 0,1671 | |||
| UNM / Unum Group | 0,01 | -38,57 | 0,46 | -31,89 | 0,9215 | 0,2133 | |||
| FDX / FedEx Corporation | 0,00 | -35,90 | 0,44 | -26,18 | 0,8851 | 0,2574 | |||
| POOL / Pool Corporation | 0,00 | -26,98 | 0,43 | -26,52 | 0,8810 | 0,8810 | |||
| ABT / Abbott Laboratories | 0,01 | -55,84 | 0,43 | -52,53 | 0,8729 | 0,8729 | |||
| BDX / Becton, Dickinson and Company | 0,00 | -78,76 | 0,43 | -77,51 | 0,8729 | -1,1585 | |||
| MSA / MSA Safety Incorporated | 0,01 | -40,65 | 0,42 | -34,37 | 0,8587 | 0,8587 | |||
| LII / Lennox International Inc. | 0,00 | -38,10 | 0,41 | -31,89 | 0,8263 | 0,1913 | |||
| LECO / Lincoln Electric Holdings, Inc. | 0,01 | -34,34 | 0,41 | -30,43 | 0,8243 | 0,2041 | |||
| KO / The Coca-Cola Company | 0,01 | -54,29 | 0,41 | -57,35 | 0,8223 | -0,1871 | |||
| CLC / CLARCOR Inc. | 0,01 | -39,22 | 0,40 | -35,00 | 0,8162 | 0,8162 | |||
| ALK / Alaska Air Group, Inc. | 0,01 | -43,52 | 0,40 | -36,19 | 0,8142 | 0,1462 | |||
| MMM / 3M Company | 0,00 | -62,71 | 0,39 | -62,44 | 0,7858 | -0,3094 | |||
| HUBB / Hubbell Incorporated | 0,00 | -34,55 | 0,39 | -33,10 | 0,7858 | 0,1709 | |||
| VLO / Valero Energy Corporation | 0,01 | -28,43 | 0,39 | -25,58 | 0,7838 | 0,2325 | |||
| LUV / Southwest Airlines Co. | 0,01 | -49,49 | 0,39 | -49,93 | 0,7797 | -0,0356 | |||
| AAPL / Apple Inc. | 0,00 | -47,46 | 0,35 | -37,94 | 0,7089 | 0,1109 | |||
| WBA / Walgreens Boots Alliance, Inc. | 0,00 | -37,88 | 0,33 | -39,82 | 0,6704 | 0,6704 | |||
| DAL / Delta Air Lines, Inc. | 0,01 | -39,42 | 0,33 | -34,47 | 0,6623 | 0,1332 | |||
| UHAL / U-Haul Holding Company | 0,00 | 11,11 | 0,32 | -3,86 | 0,6562 | 0,6562 | |||
| AMG / Affiliated Managers Group, Inc. | 0,00 | -46,34 | 0,32 | -44,89 | 0,6441 | 0,0323 | |||
| BRK.B / Berkshire Hathaway Inc. | 0,00 | -51,11 | 0,32 | -51,23 | 0,6441 | -0,0472 | |||
| 61166W101 / Monsanto Co. | 0,00 | -46,55 | 0,32 | -47,17 | 0,6420 | 0,6420 | |||
| CAH / Cardinal Health, Inc. | 0,00 | -49,37 | 0,31 | -49,51 | 0,6299 | -0,0232 | |||
| ATR / AptarGroup, Inc. | 0,00 | -27,27 | 0,31 | -28,74 | 0,6278 | 0,1667 | |||
| CI / The Cigna Group | 0,00 | -51,06 | 0,30 | -50,17 | 0,6076 | 0,6076 | |||
| AET / Aetna, Inc. | 0,00 | -55,17 | 0,30 | -57,63 | 0,6076 | -0,1430 | |||
| VOYA / Voya Financial, Inc. | 0,01 | 11,96 | 0,30 | 30,26 | 0,6015 | 0,6015 | |||
| EMN / Eastman Chemical Company | 0,00 | 0,00 | 0,26 | 0,5347 | 0,5347 | ||||
| BPOP / Popular, Inc. | 0,01 | -30,30 | 0,26 | -8,97 | 0,5347 | 0,5347 | |||
| AXP / American Express Company | 0,00 | 0,00 | 0,26 | 0,5327 | 0,5327 | ||||
| DFS / Discover Financial Services | 0,00 | 0,00 | 0,26 | 0,5266 | 0,5266 | ||||
| IVZ / Invesco Ltd. | 0,01 | 0,00 | 0,24 | 0,4942 | 0,4942 | ||||
| JLL / Jones Lang LaSalle Incorporated | 0,00 | -12,50 | 0,24 | 2,14 | 0,4841 | 0,2360 | |||
| ALLY / Ally Financial Inc. | 0,01 | -19,08 | 0,24 | -7,72 | 0,4841 | 0,4841 | |||
| ANTM / Anthem Inc | 0,00 | 0,00 | 0,24 | 0,4820 | 0,4820 | ||||
| NAVI / Navient Corporation | 0,02 | -31,09 | 0,24 | -16,55 | 0,4800 | 0,1789 | |||
| NRF / NorthStar Realty Finance Corp. | 0,02 | -18,06 | 0,23 | -5,67 | 0,4719 | 0,4719 | |||
| CIT / CIT Group Inc | 0,01 | -28,09 | 0,23 | -18,31 | 0,4699 | 0,1688 | |||
| MOH / Molina Healthcare, Inc. | 0,00 | -9,30 | 0,23 | 5,58 | 0,4597 | 0,4597 | |||
| HBAN / Huntington Bancshares Incorporated | 0,02 | 0,23 | 0,4597 | 0,4597 | |||||
| EWBC / East West Bancorp, Inc. | 0,01 | -28,24 | 0,22 | -23,02 | 0,4537 | 0,1451 | |||
| FTI / TechnipFMC plc | 0,01 | -27,45 | 0,22 | -19,12 | 0,4456 | 0,1572 | |||
| KEY / KeyCorp | 0,02 | -28,85 | 0,22 | -21,79 | 0,4435 | 0,1467 | |||
| AMP / Ameriprise Financial, Inc. | 0,00 | -26,67 | 0,22 | -18,89 | 0,4435 | 0,1573 | |||
| CBRE / CBRE Group, Inc. | 0,01 | -17,02 | 0,22 | -12,45 | 0,4415 | 0,1775 | |||
| AGO / Assured Guaranty Ltd. | 0,01 | -29,73 | 0,22 | -23,40 | 0,4375 | 0,4375 | |||
| RAX / Rackspace Hosting, Inc. | 0,01 | 0,00 | 0,21 | 0,4354 | 0,4354 | ||||
| WRK / WestRock Company | 0,00 | 0,21 | 0,4314 | 0,4314 | |||||
| BWA / BorgWarner Inc. | 0,01 | -71,70 | 0,21 | -66,29 | 0,4273 | -0,2364 | |||
| PVH / PVH Corp. | 0,00 | -75,32 | 0,21 | -71,07 | 0,4253 | -0,3444 | |||
| AFSIC / AmTrust Financial Services, Inc. - Preferred Stock | 0,01 | -28,44 | 0,21 | -21,72 | 0,4233 | 0,4233 | |||
| ON / ON Semiconductor Corporation | 0,02 | -36,05 | 0,20 | -10,96 | 0,4111 | 0,4111 | |||
| 887228104 / Time Inc. | 0,00 | -100,00 | 0,00 | -100,00 | 0,0000 | 0,0000 | |||
| VWR / VWR Corporation | 0,00 | -100,00 | 0,00 | -100,00 | 0,0000 | 0,0000 | |||
| CNC / Centene Corporation | 0,00 | -100,00 | 0,00 | -100,00 | -1,1503 | ||||
| STWD / Starwood Property Trust, Inc. | 0,00 | -100,00 | 0,00 | -100,00 | 0,0000 | 0,0000 | |||
| FNF / Fidelity National Financial, Inc. | 0,00 | -100,00 | 0,00 | -100,00 | 0,0000 | 0,0000 | |||
| TWO / Two Harbors Investment Corp. | 0,00 | -100,00 | 0,00 | -100,00 | 0,0000 | 0,0000 | |||
| DLX / Deluxe Corporation | 0,00 | -100,00 | 0,00 | -100,00 | 0,0000 | 0,0000 | |||
| VEA / Vanguard Tax-Managed Funds - Vanguard FTSE Developed Markets ETF | 0,00 | -100,00 | 0,00 | -100,00 | 0,0000 | 0,0000 | |||
| BIG / Big Lots, Inc. | 0,00 | -100,00 | 0,00 | -100,00 | 0,0000 | 0,0000 | |||
| GPK / Graphic Packaging Holding Company | 0,00 | -100,00 | 0,00 | -100,00 | 0,0000 | 0,0000 | |||
| R / Ryder System, Inc. | 0,00 | -100,00 | 0,00 | -100,00 | 0,0000 | 0,0000 | |||
| SAIC / Science Applications International Corporation | 0,00 | -100,00 | 0,00 | -100,00 | 0,0000 | 0,0000 | |||
| M / Macy's, Inc. | 0,00 | -100,00 | 0,00 | -100,00 | 0,0000 | 0,0000 | |||
| TMUS / T-Mobile US, Inc. | 0,00 | -100,00 | 0,00 | -100,00 | 0,0000 | 0,0000 | |||
| BRCD / Brocade Communications Systems, Inc. | 0,00 | -100,00 | 0,00 | -100,00 | 0,0000 | 0,0000 | |||
| JBL / Jabil Inc. | 0,00 | -100,00 | 0,00 | -100,00 | 0,0000 | 0,0000 | |||
| FOX / Fox Corporation | 0,00 | -100,00 | 0,00 | -100,00 | 0,0000 | 0,0000 | |||
| 872307903 / TCF Financial Corporation | 0,00 | -100,00 | 0,00 | -100,00 | 0,0000 | 0,0000 | |||
| FCE.A / Forest City Realty Trust, Inc. | 0,00 | -100,00 | 0,00 | -100,00 | -0,3117 | ||||
| MDY / SPDR S&P MidCap 400 ETF Trust | 0,00 | -100,00 | 0,00 | -100,00 | 0,0000 | 0,0000 | |||
| ARRS / ARRIS International plc | 0,00 | -100,00 | 0,00 | -100,00 | 0,0000 | 0,0000 | |||
| SPY / SPDR S&P 500 ETF | 0,00 | -100,00 | 0,00 | -100,00 | 0,0000 | 0,0000 | |||
| QRTEA / Qurate Retail Inc - Series A | 0,00 | -100,00 | 0,00 | -100,00 | 0,0000 | 0,0000 | |||
| CASY / Casey's General Stores, Inc. | 0,00 | -100,00 | 0,00 | -100,00 | 0,0000 | 0,0000 | |||
| POLY / Plantronics, Inc. | 0,00 | -100,00 | 0,00 | -100,00 | -0,3032 | ||||
| VEU / Vanguard International Equity Index Funds - Vanguard FTSE All-World ex-US ETF | 0,00 | -100,00 | 0,00 | -100,00 | 0,0000 | 0,0000 | |||
| TGNA / TEGNA Inc. | 0,00 | -100,00 | 0,00 | -100,00 | 0,0000 | 0,0000 | |||
| KSS / Kohl's Corporation | 0,00 | -100,00 | 0,00 | -100,00 | -0,2449 | ||||
| ARMK / Aramark | 0,00 | -100,00 | 0,00 | -100,00 | 0,0000 | 0,0000 | |||
| IPG / The Interpublic Group of Companies, Inc. | 0,00 | -100,00 | 0,00 | -100,00 | -0,7962 | ||||
| CSX / CSX Corporation | 0,00 | -100,00 | 0,00 | -100,00 | -0,6223 | ||||
| JBLU / JetBlue Airways Corporation | 0,00 | -100,00 | 0,00 | -100,00 | -0,1771 | ||||
| SATS / EchoStar Corporation | 0,00 | -100,00 | 0,00 | -100,00 | 0,0000 | 0,0000 | |||
| CNK / Cinemark Holdings, Inc. | 0,00 | -100,00 | 0,00 | -100,00 | -0,2163 | ||||
| KR / The Kroger Co. | 0,00 | -100,00 | 0,00 | -100,00 | 0,0000 | 0,0000 | |||
| AEO / American Eagle Outfitters, Inc. | 0,00 | -100,00 | 0,00 | -100,00 | -0,2014 | ||||
| ABC / Amerisource Bergen Corp. | 0,00 | -100,00 | 0,00 | -100,00 | -0,9001 | ||||
| SFM / Sprouts Farmers Market, Inc. | 0,00 | -100,00 | 0,00 | -100,00 | 0,0000 | 0,0000 | |||
| UHS / Universal Health Services, Inc. | 0,00 | -100,00 | 0,00 | -100,00 | -0,3128 | ||||
| LYB / LyondellBasell Industries N.V. | 0,00 | -100,00 | 0,00 | -100,00 | -0,2757 | ||||
| STI / Solidion Technology, Inc. | 0,00 | -100,00 | 0,00 | -100,00 | 0,0000 | 0,0000 | |||
| TSN / Tyson Foods, Inc. | 0,00 | -100,00 | 0,00 | -100,00 | -0,3753 | ||||
| RF / Regions Financial Corporation | 0,00 | -100,00 | 0,00 | -100,00 | -0,3181 | ||||
| NYT / The New York Times Company | 0,00 | -100,00 | 0,00 | -100,00 | 0,0000 | 0,0000 | |||
| LPNT / LifePoint Health, Inc. | 0,00 | -100,00 | 0,00 | -100,00 | -0,2767 | ||||
| ESRX / Express Scripts Holding Co. | 0,00 | -100,00 | 0,00 | -100,00 | -0,7634 | ||||
| DLTR / Dollar Tree, Inc. | 0,00 | -100,00 | 0,00 | -100,00 | -0,5799 | ||||
| UNH / UnitedHealth Group Incorporated | 0,00 | -100,00 | 0,00 | -100,00 | -0,7634 | ||||
| EVHC / Envision Healthcare Holdings, Inc. | 0,00 | -100,00 | 0,00 | -100,00 | -0,3849 | ||||
| FCN / FTI Consulting, Inc. | 0,00 | -100,00 | 0,00 | -100,00 | -0,2502 | ||||
| RSG / Republic Services, Inc. | 0,00 | -100,00 | 0,00 | -100,00 | 0,0000 | 0,0000 | |||
| QCOM / QUALCOMM Incorporated | 0,00 | -100,00 | 0,00 | -100,00 | -0,7379 | ||||
| BA / The Boeing Company | 0,00 | -100,00 | 0,00 | -100,00 | -0,7019 | ||||
| TXT / Textron Inc. | 0,00 | -100,00 | 0,00 | -100,00 | -0,9107 | ||||
| RRD / R.R. Donnelley & Sons Co. | 0,00 | -100,00 | 0,00 | -100,00 | -0,2279 | ||||
| CMCSA / Comcast Corporation | 0,00 | -100,00 | 0,00 | -100,00 | -0,6149 | ||||
| MOS / The Mosaic Company | 0,00 | -100,00 | 0,00 | -100,00 | -0,5439 | ||||
| 64126X201 / NeuStar, Inc. | 0,00 | -100,00 | 0,00 | -100,00 | -0,2545 | ||||
| MLHR / Herman Miller Inc. | 0,00 | -100,00 | 0,00 | -100,00 | -0,2216 | ||||
| UNP / Union Pacific Corporation | 0,00 | -100,00 | 0,00 | -100,00 | -0,7581 | ||||
| PLCM / Polycom, Inc. | 0,00 | -100,00 | 0,00 | -100,00 | -0,2735 | ||||
| HNI / HNI Corporation | 0,00 | -100,00 | 0,00 | -100,00 | 0,0000 | 0,0000 |