Grundlæggende statistik
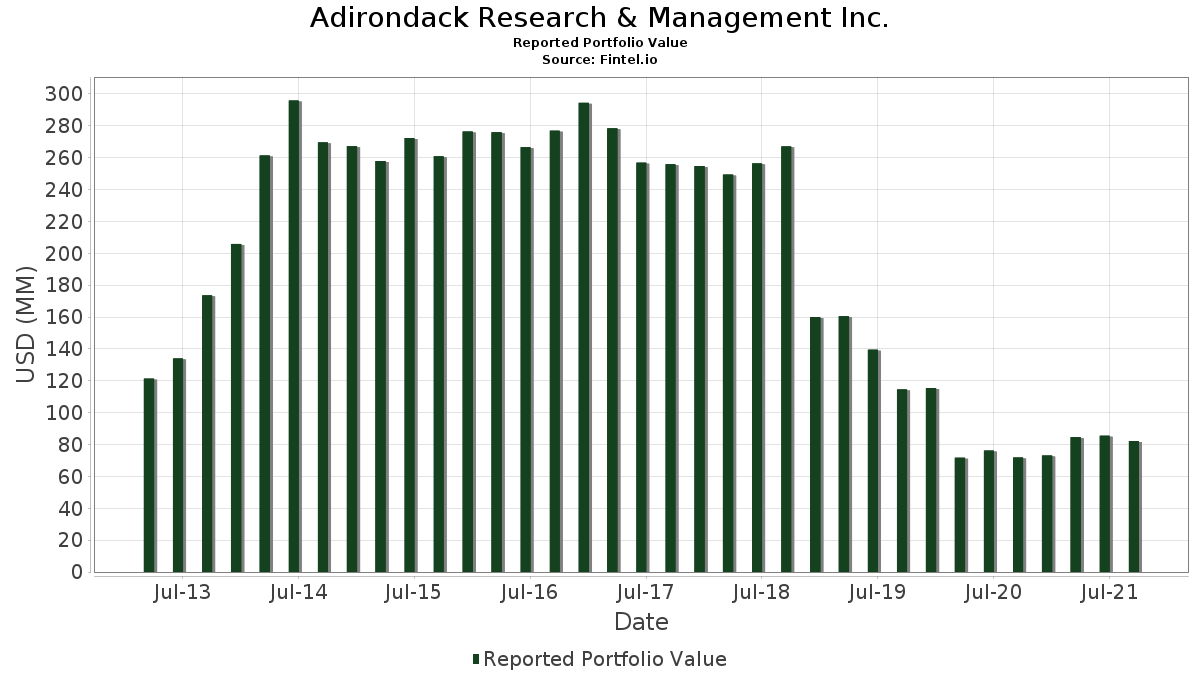
| Porteføljeværdi | $ 82.215.000 |
| Nuværende stillinger | 98 |
Seneste beholdninger, ydeevne, AUM (fra 13F, 13D)
Adirondack Research & Management Inc. har afsløret 98 samlede besiddelser i deres seneste SEC-arkivering. Den seneste porteføljeværdi er beregnet til at være $ 82.215.000 USD. Faktiske aktiver under forvaltning (AUM) er denne værdi plus kontanter (som ikke er oplyst). Adirondack Research & Management Inc.s største beholdninger er Conduent Incorporated (US:CNDT) , Unisys Corporation (US:UIS) , CNO Financial Group, Inc. (US:CNO) , Antero Resources Corporation (US:AR) , and Lazard, Inc. (US:LAZ) . Adirondack Research & Management Inc.s nye stillinger omfatter Hillman Solutions Corp. (US:) , Baxter International Inc. (US:BAX) , CNX Resources Corporation (US:CNX) , CDK Global Inc (US:CDK) , and Schweitzer-Mauduit International, Inc. (US:SWM) .
Top øger dette kvartal
Vi bruger ændringen i porteføljeallokeringen, fordi dette er den mest meningsfulde metrik. Ændringer kan skyldes handler eller ændringer i aktiekurser.
| Sikkerhed | Aktier (MM) |
Værdi (MM$) |
Portefølje % | ΔPortefølje % |
|---|---|---|---|---|
| 0,13 | 1,50 | 1,8306 | 1,8306 | |
| 0,01 | 1,01 | 1,2321 | 1,2321 | |
| 0,06 | 0,74 | 0,8964 | 0,8964 | |
| 0,10 | 1,88 | 2,2806 | 0,8689 | |
| 0,02 | 0,63 | 0,7687 | 0,7687 | |
| 0,00 | 0,52 | 0,6276 | 0,6276 | |
| 0,03 | 0,45 | 0,5486 | 0,5486 | |
| 0,05 | 1,58 | 1,9230 | 0,4377 | |
| 0,12 | 0,34 | 0,4196 | 0,4196 | |
| 0,04 | 0,85 | 1,0327 | 0,3122 |
Top falder i dette kvartal
Vi bruger ændringen i porteføljeallokeringen, fordi dette er den mest meningsfulde metrik. Ændringer kan skyldes handler eller ændringer i aktiekurser.
| Sikkerhed | Aktier (MM) |
Værdi (MM$) |
Portefølje % | ΔPortefølje % |
|---|---|---|---|---|
| 0,00 | 0,00 | -2,6116 | ||
| 0,00 | 0,00 | -1,7614 | ||
| 0,03 | 0,60 | 0,7359 | -0,8009 | |
| 0,05 | 1,04 | 1,2686 | -0,5068 | |
| 0,18 | 0,75 | 0,9135 | -0,5005 | |
| 0,04 | 0,55 | 0,6665 | -0,4679 | |
| 0,16 | 1,36 | 1,6578 | -0,3877 | |
| 0,48 | 3,19 | 3,8801 | -0,3666 | |
| 0,09 | 1,16 | 1,4158 | -0,3327 | |
| 0,00 | 0,00 | -0,2889 |
13F og Fondsarkivering
Denne formular blev indsendt den 2021-10-29 for rapporteringsperioden 2021-09-30. Klik på linkikonet for at se den fulde transaktionshistorik.
Opgrader for at låse op for premium-data og eksportere til Excel ![]() .
.
| Sikkerhed | Type | Gennemsnitlig aktiekurs | Aktier (MM) |
Δ Aktier (%) |
Δ Aktier (%) |
Værdi ($MM) |
Portefølje (%) |
ΔPortefølje (%) |
|
|---|---|---|---|---|---|---|---|---|---|
| CNDT / Conduent Incorporated | 0,48 | 0,00 | 3,19 | -12,15 | 3,8801 | -0,3666 | |||
| UIS / Unisys Corporation | 0,08 | -9,49 | 1,91 | -10,09 | 2,3195 | -0,1611 | |||
| CNO / CNO Financial Group, Inc. | 0,08 | 0,00 | 1,88 | -0,37 | 2,2879 | 0,0798 | |||
| AR / Antero Resources Corporation | 0,10 | 24,16 | 1,88 | 55,34 | 2,2806 | 0,8689 | |||
| LAZ / Lazard, Inc. | 0,04 | -3,57 | 1,78 | -2,36 | 2,1675 | 0,0330 | |||
| CLS / Celestica Inc. | 0,19 | -10,52 | 1,72 | 1,23 | 2,0957 | 0,1051 | |||
| ADTN / ADTRAN Holdings, Inc. | 0,09 | 1,89 | 1,72 | -7,48 | 2,0921 | -0,0821 | |||
| SPNT / SiriusPoint Ltd. | 0,18 | 0,00 | 1,69 | -8,07 | 2,0519 | -0,0942 | |||
| LYTS / LSI Industries Inc. | 0,21 | -0,71 | 1,62 | -3,92 | 1,9668 | -0,0016 | |||
| TRST / TrustCo Bank Corp NY | 0,05 | 33,83 | 1,58 | 24,49 | 1,9230 | 0,4377 | |||
| EAF / GrafTech International Ltd. | 0,15 | 0,00 | 1,57 | -11,21 | 1,9084 | -0,1582 | |||
| VG / Venture Global, Inc. | 0,10 | -10,60 | 1,55 | 0,00 | 1,8914 | 0,0727 | |||
| NWLI / National Western Life Group, Inc. | 0,01 | -7,23 | 1,54 | -12,94 | 1,8744 | -0,1958 | |||
| BRX / Brixmor Property Group Inc. | 0,07 | -0,85 | 1,52 | -4,21 | 1,8525 | -0,0071 | |||
| ASC / Ardmore Shipping Corporation | 0,37 | 3,40 | 1,52 | 1,67 | 1,8512 | 0,1004 | |||
| / Hillman Solutions Corp. | 0,13 | 1,50 | 1,8306 | 1,8306 | |||||
| MTG / MGIC Investment Corporation | 0,10 | -5,13 | 1,48 | 4,39 | 1,7941 | 0,1415 | |||
| INFN / Infinera Corporation | 0,16 | -4,46 | 1,36 | -22,07 | 1,6578 | -0,3877 | |||
| GNW / Genworth Financial, Inc. | 0,36 | 15,09 | 1,35 | 10,70 | 1,6481 | 0,2166 | |||
| PLAB / Photronics, Inc. | 0,09 | 0,00 | 1,23 | 3,20 | 1,4900 | 0,1017 | |||
| OI / O-I Glass, Inc. | 0,08 | -7,09 | 1,17 | -18,80 | 1,4182 | -0,2613 | |||
| MDRX / Veradigm Inc. | 0,09 | 7,80 | 1,16 | -22,14 | 1,4158 | -0,3327 | |||
| CODI.PRA / Compass Diversified - Preferred Stock | 0,04 | -1,13 | 1,15 | 9,20 | 1,4000 | 0,1673 | |||
| ADM / Archer-Daniels-Midland Company | 0,02 | 5,65 | 1,09 | 4,60 | 1,3270 | 0,1072 | |||
| COP / ConocoPhillips | 0,02 | -0,11 | 1,08 | 11,19 | 1,3173 | 0,1781 | |||
| TSN / Tyson Foods, Inc. | 0,01 | 0,01 | 1,07 | 7,03 | 1,2966 | 0,1317 | |||
| CSCO / Cisco Systems, Inc. | 0,02 | 4,31 | 1,04 | 7,08 | 1,2698 | 0,1295 | |||
| COG / Cabot Oil & Gas Corp. | 0,05 | -44,85 | 1,04 | -31,29 | 1,2686 | -0,5068 | |||
| BAX / Baxter International Inc. | 0,01 | 1,01 | 1,2321 | 1,2321 | |||||
| HIL / Hill International Inc | 0,47 | 12,11 | 0,96 | -6,78 | 1,1713 | -0,0368 | |||
| TIPT / Tiptree Inc. | 0,10 | 1,92 | 0,96 | 9,86 | 1,1652 | 0,1454 | |||
| DENN / Denny's Corporation | 0,06 | -0,48 | 0,94 | -1,46 | 1,1482 | 0,0278 | |||
| DCUE / Dominion Energy Inc - Units - 2019 Series A | 0,01 | 0,80 | 0,94 | 0,00 | 1,1421 | 0,0439 | |||
| WFC / Wells Fargo & Company | 0,02 | 0,01 | 0,92 | 2,56 | 1,1227 | 0,0701 | |||
| IMKTA / Ingles Markets, Incorporated | 0,01 | 0,00 | 0,92 | 13,19 | 1,1166 | 0,1681 | |||
| F / Ford Motor Company | 0,06 | 4,56 | 0,88 | -0,34 | 1,0655 | 0,0375 | |||
| PM / Philip Morris International Inc. | 0,01 | 0,02 | 0,86 | -4,32 | 1,0497 | -0,0053 | |||
| ARAY / Accuray Incorporated | 0,22 | 5,49 | 0,86 | -7,80 | 1,0497 | -0,0450 | |||
| TAP.A / Molson Coors Beverage Company | 0,02 | -0,34 | 0,86 | -13,89 | 1,0485 | -0,1223 | |||
| CGNT / Cognyte Software Ltd. | 0,04 | 64,43 | 0,85 | 37,82 | 1,0327 | 0,3122 | |||
| T / AT&T Inc. | 0,03 | 0,77 | 0,82 | -5,42 | 0,9974 | -0,0166 | |||
| KO / The Coca-Cola Company | 0,02 | 0,92 | 0,82 | -2,04 | 0,9925 | 0,0183 | |||
| TWNK / Hostess Brands Inc - Class A | 0,05 | 0,00 | 0,79 | 7,34 | 0,9609 | 0,1001 | |||
| RL / Ralph Lauren Corporation | 0,01 | 0,01 | 0,78 | -5,69 | 0,9475 | -0,0185 | |||
| SEB / Seaboard Corporation | 0,00 | -4,52 | 0,78 | 1,17 | 0,9475 | 0,0470 | |||
| MTRX / Matrix Service Company | 0,07 | -11,85 | 0,76 | -12,21 | 0,9268 | -0,0883 | |||
| ALE / ALLETE, Inc. | 0,01 | 0,00 | 0,76 | -14,93 | 0,9220 | -0,1201 | |||
| WLMS / Williams Industrial Services Group Inc | 0,18 | -15,08 | 0,75 | -37,88 | 0,9135 | -0,5005 | |||
| CNX / CNX Resources Corporation | 0,06 | 0,74 | 0,8964 | 0,8964 | |||||
| WLKP / Westlake Chemical Partners LP - Limited Partnership | 0,03 | 0,03 | 0,71 | -9,54 | 0,8648 | -0,0545 | |||
| KN / Knowles Corporation | 0,04 | 0,00 | 0,69 | -5,08 | 0,8417 | -0,0109 | |||
| MNTX / Manitex International, Inc. | 0,09 | 0,00 | 0,68 | -1,60 | 0,8235 | 0,0188 | |||
| CDK / CDK Global Inc | 0,02 | 0,67 | 0,0000 | ||||||
| B / Barrick Mining Corporation | 0,02 | 0,01 | 0,63 | -18,56 | 0,7687 | -0,1389 | |||
| SWM / Schweitzer-Mauduit International, Inc. | 0,02 | 0,63 | 0,7687 | 0,7687 | |||||
| HBIO / Harvard Bioscience, Inc. | 0,09 | -9,45 | 0,63 | -24,15 | 0,7639 | -0,2045 | |||
| ORI / Old Republic International Corporation | 0,03 | 0,00 | 0,62 | -7,13 | 0,7602 | -0,0269 | |||
| SANM / Sanmina Corporation | 0,02 | 0,00 | 0,62 | -0,96 | 0,7566 | 0,0221 | |||
| ECVT / Ecovyst Inc. | 0,05 | 0,46 | 0,61 | -23,72 | 0,7432 | -0,1936 | |||
| PTVE / Pactiv Evergreen Inc. | 0,05 | 0,00 | 0,61 | -16,83 | 0,7395 | -0,1154 | |||
| UAA / Under Armour, Inc. | 0,03 | -51,73 | 0,60 | -53,96 | 0,7359 | -0,8009 | |||
| GLW / Corning Incorporated | 0,02 | 15,58 | 0,57 | 3,07 | 0,6933 | 0,0465 | |||
| AMSWA / American Software Inc. - Class A | 0,02 | 0,01 | 0,57 | 7,97 | 0,6921 | 0,0757 | |||
| STC / Stewart Information Services Corporation | 0,01 | -38,72 | 0,55 | -31,68 | 0,6690 | -0,2725 | |||
| ATEN / A10 Networks, Inc. | 0,04 | -52,85 | 0,55 | -43,51 | 0,6665 | -0,4679 | |||
| PACW / Pacwest Bancorp | 0,01 | 0,02 | 0,54 | 10,20 | 0,6568 | 0,0837 | |||
| HGH / Hartford Financial Services Group Inc. - FXDFR DB REDEEM 15/04/2042 USD 25 | 0,01 | -4,73 | 0,52 | 8,06 | 0,6361 | 0,0701 | |||
| BABA / Alibaba Group Holding Limited - Depositary Receipt (Common Stock) | 0,00 | 0,52 | 0,6276 | 0,6276 | |||||
| MSFT / Microsoft Corporation | 0,00 | -3,84 | 0,51 | 0,20 | 0,6191 | 0,0250 | |||
| MET / MetLife, Inc. | 0,01 | -3,90 | 0,50 | -0,99 | 0,6106 | 0,0176 | |||
| CALM / Cal-Maine Foods, Inc. | 0,01 | -16,97 | 0,49 | -17,09 | 0,6021 | -0,0961 | |||
| QMCO / Quantum Corporation | 0,09 | 0,00 | 0,47 | -24,84 | 0,5705 | -0,1594 | |||
| CHS / Chico's FAS, Inc. | 0,10 | 32,67 | 0,47 | -9,50 | 0,5680 | -0,0355 | |||
| EZPW / EZCORP, Inc. | 0,06 | 37,23 | 0,45 | 71,97 | 0,5522 | 0,2434 | |||
| HBI / Hanesbrands Inc. | 0,03 | 0,45 | 0,5486 | 0,5486 | |||||
| EXC / Exelon Corporation | 0,01 | -0,95 | 0,43 | 8,10 | 0,5194 | 0,0574 | |||
| VSH / Vishay Intertechnology, Inc. | 0,02 | 0,00 | 0,42 | -10,85 | 0,5096 | -0,0401 | |||
| CLF / Cleveland-Cliffs Inc. | 0,02 | 11,36 | 0,39 | 2,37 | 0,4719 | 0,0287 | |||
| TECK / Teck Resources Limited | 0,02 | 0,49 | 0,38 | 8,81 | 0,4659 | 0,0542 | |||
| BSX / Boston Scientific Corporation | 0,01 | -3,41 | 0,38 | -2,06 | 0,4634 | 0,0085 | |||
| PFE / Pfizer Inc. | 0,01 | -7,42 | 0,35 | 1,75 | 0,4245 | 0,0233 | |||
| ABT / Abbott Laboratories | 0,00 | -3,92 | 0,35 | -1,97 | 0,4233 | 0,0081 | |||
| DS / Drive Shack Inc | 0,12 | 0,34 | 0,4196 | 0,4196 | |||||
| CCEP / Coca-Cola Europacific Partners PLC | 0,01 | -0,48 | 0,34 | -7,32 | 0,4160 | -0,0156 | |||
| PCYO / Pure Cycle Corporation | 0,02 | 0,00 | 0,32 | -3,57 | 0,3941 | 0,0011 | |||
| AA / Alcoa Corporation | 0,01 | -0,33 | 0,31 | 32,33 | 0,3734 | 0,1021 | |||
| ED / Consolidated Edison, Inc. | 0,00 | 0,00 | 0,30 | 1,35 | 0,3661 | 0,0188 | |||
| PBFX / Pbf Logistics Lp - Unit | 0,02 | -0,77 | 0,29 | -15,80 | 0,3564 | -0,0506 | |||
| NOK / Nokia Oyj - Depositary Receipt (Common Stock) | 0,05 | -1,52 | 0,28 | 1,07 | 0,3442 | 0,0167 | |||
| EMKR / Emcore Corporation | 0,04 | -9,58 | 0,28 | -26,75 | 0,3430 | -0,1073 | |||
| TWTR / Twitter Inc | 0,00 | -2,22 | 0,27 | -14,19 | 0,3235 | -0,0390 | |||
| MYE / Myers Industries, Inc. | 0,01 | 0,00 | 0,26 | -6,74 | 0,3199 | -0,0099 | |||
| GE / General Electric Company | 0,00 | -87,49 | 0,26 | -4,07 | 0,3150 | -0,0008 | |||
| HUN / Huntsman Corporation | 0,01 | 0,01 | 0,23 | 11,33 | 0,2749 | 0,0375 | |||
| DIN / Dine Brands Global, Inc. | 0,00 | -0,38 | 0,21 | -9,44 | 0,2566 | -0,0159 | |||
| SP / SP Plus Corporation | 0,01 | -1,04 | 0,21 | -0,94 | 0,2554 | 0,0075 | |||
| ABBV / AbbVie Inc. | 0,00 | 0,00 | 0,20 | -4,23 | 0,2481 | -0,0010 | |||
| VNTR / Venator Materials PLC | 0,06 | 0,16 | 0,1995 | 0,1995 | |||||
| AAPL / Apple Inc. | 0,00 | -100,00 | 0,00 | -100,00 | -0,2468 | ||||
| CHNG / Change Healthcare Inc | 0,00 | -100,00 | 0,00 | -100,00 | -0,2889 | ||||
| CVA / Covanta Holding Corporation | 0,00 | -100,00 | 0,00 | -100,00 | -2,6116 | ||||
| US51476H1005 / Landcadia Holdings III, Inc. Class A | 0,00 | -100,00 | 0,00 | -100,00 | -1,7614 |